The small-cap market has changed significantly over the last twenty years and most would say it has not been for the better. One reason: The ongoing expansion of private equity, which has been providing ample financing to companies that might have otherwise considered going public. Over the past 10 years, private equity has invested $2.1 trillion in the U.S., with a substantial portion in small and mid-sized companies.1 To put this in context, the average value of the entire Russell 2000® – which represents almost 40% of all U.S. public companies – was $2.5 trillion over this same period.2 As a result, a once-healthy supply of promising small and mid-cap companies that would have historically eyed an IPO has been siphoned away from the public markets.
Further, over the last 10 years private equity spent over $900 billion taking U.S. public companies private, including many attractive small-cap companies and those in desired sectors such as technology and health care.3 Essentially, private equity has relocated an entire group of companies to the private markets, resulting in an investable universe of small and mid-cap cap companies that are now spread across both the private and public markets.
What does this mean for the average investor? For a long time, the rule of thumb has been to own an index fund for diversification by gaining exposure to all the stocks that make up a particular index. But small-cap public market indices no longer represent the total market as private markets are a much larger share of this investable universe. Investors who rely on a traditional 60/40 portfolio for diversification should likely consider a different way to gain total market exposure—one that includes a private market allocation.
Small Caps Aren’t That Small Anymore
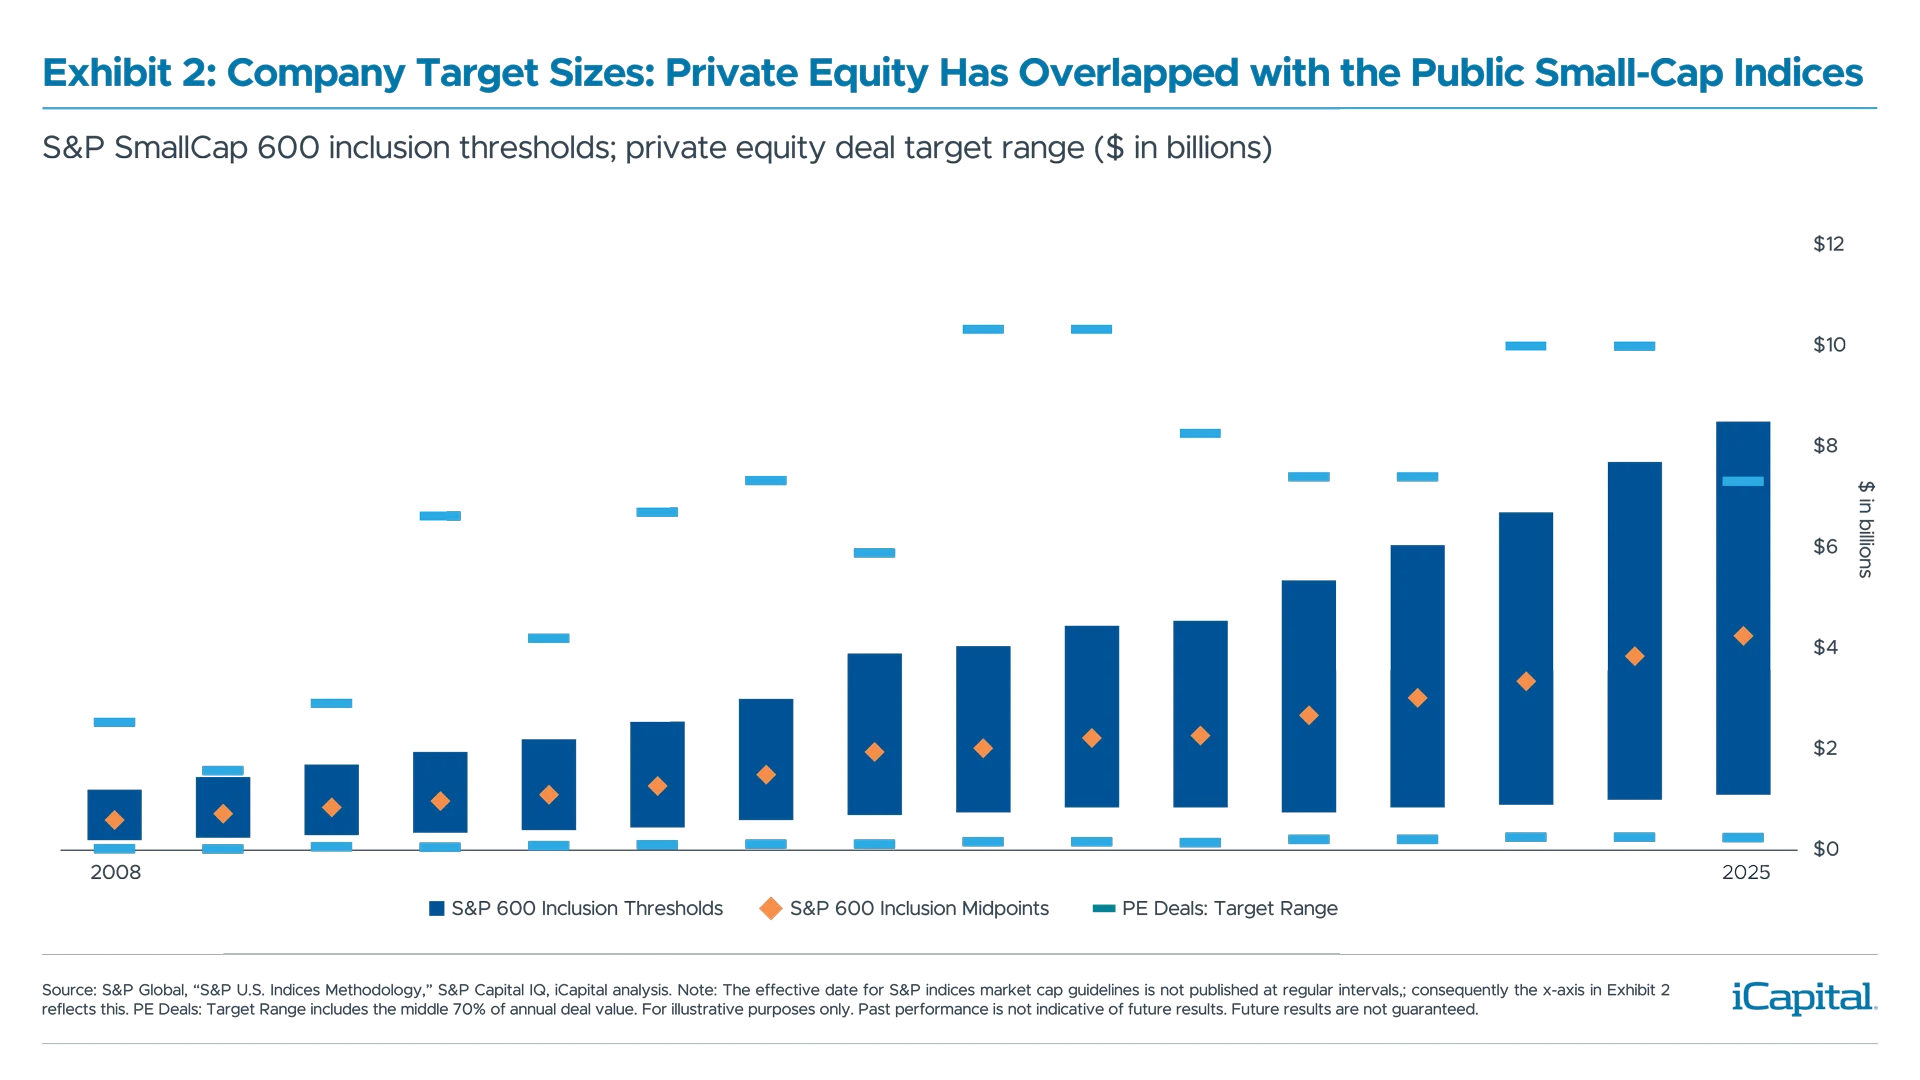
One consequence of fewer companies going public is that small-cap indices represent bigger and generally older companies than the small caps of the 1980s,1990s, and early 2000’s. The average company in the S&P SmallCap 600® (S&P 600) is now $2.5 billion in market capitalization, up from $950 million in 2005 (Exhibit 1), while the market caps of the largest companies in the S&P 600 and Russell 2000 are $9 billion and $16 billion, respectively.4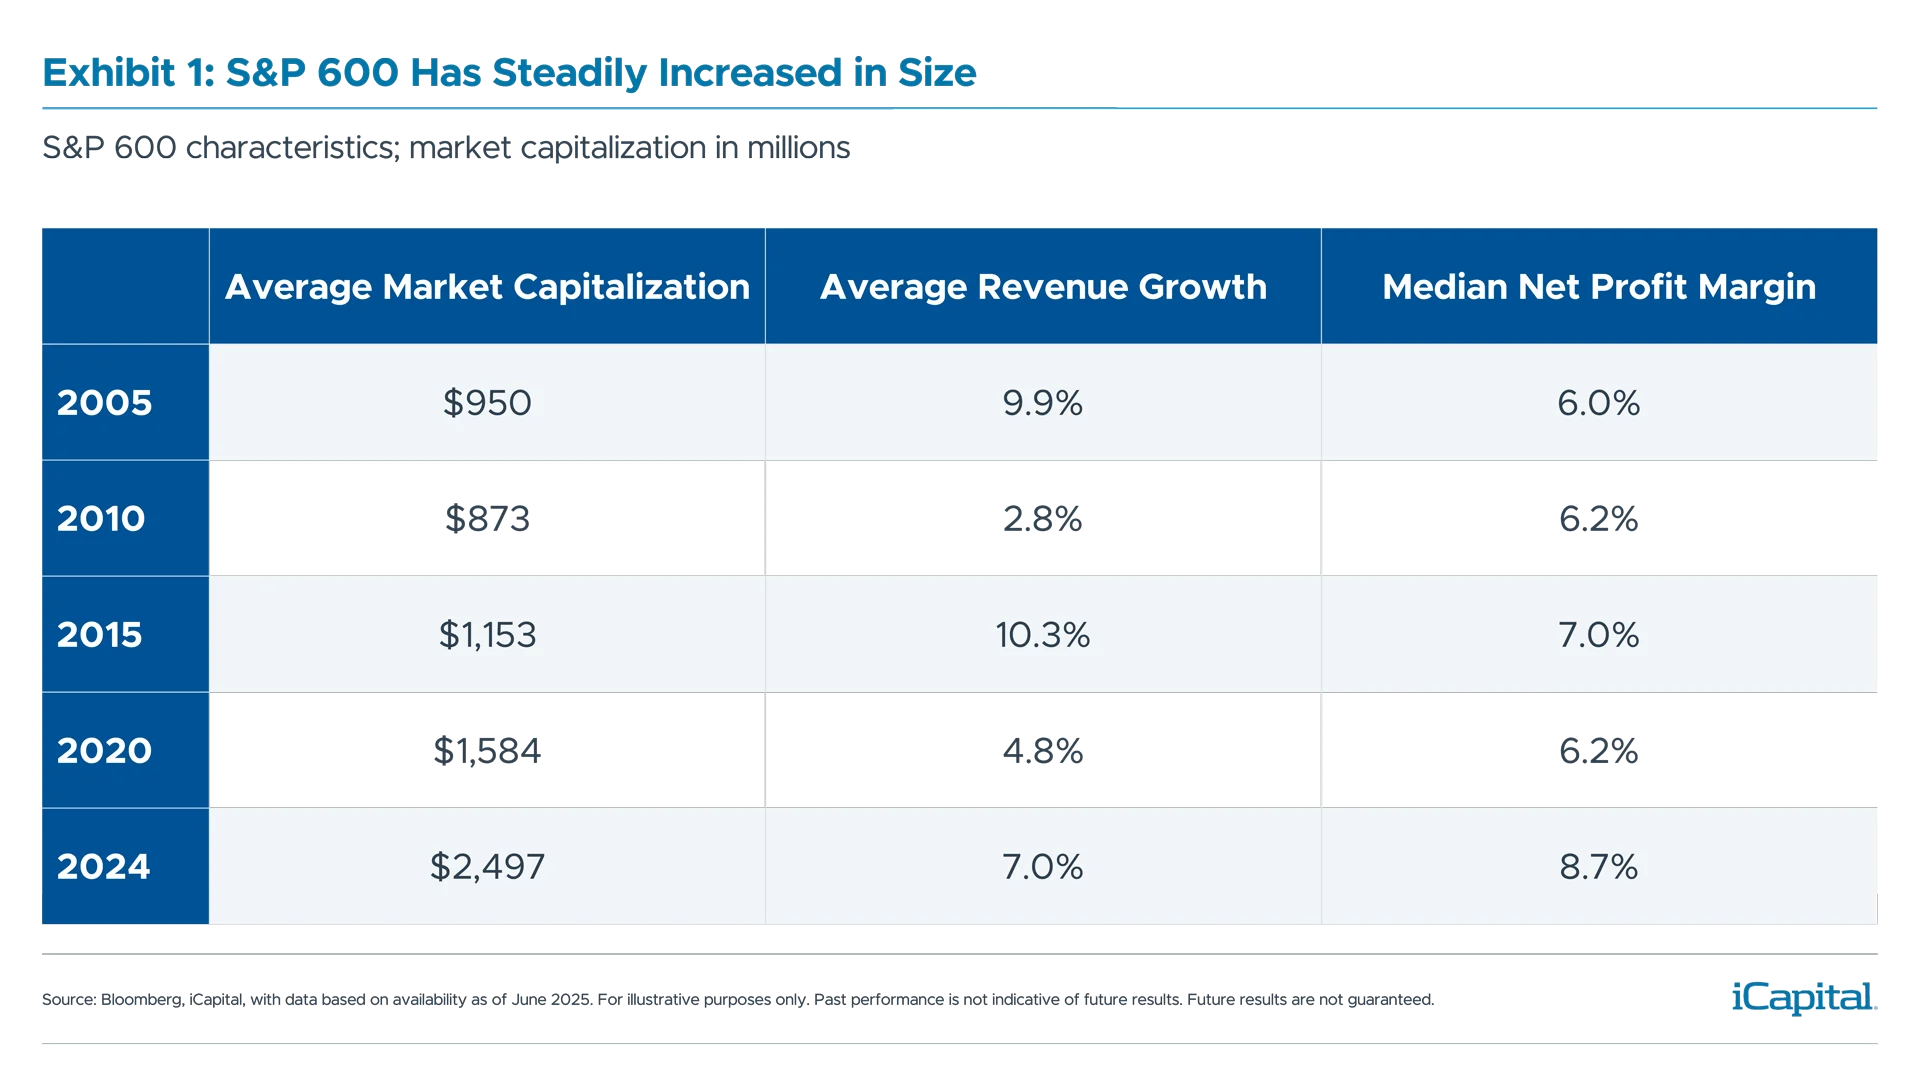 And just as the average small and mid-cap public company has grown in size, so too has the average private equity-backed company. In fact, as private equity assets increased more than tenfold over the past twenty years, the size range of companies that many private equity funds have targeted has tracked the public small-cap indices in a remarkable way (Exhibit 2).5
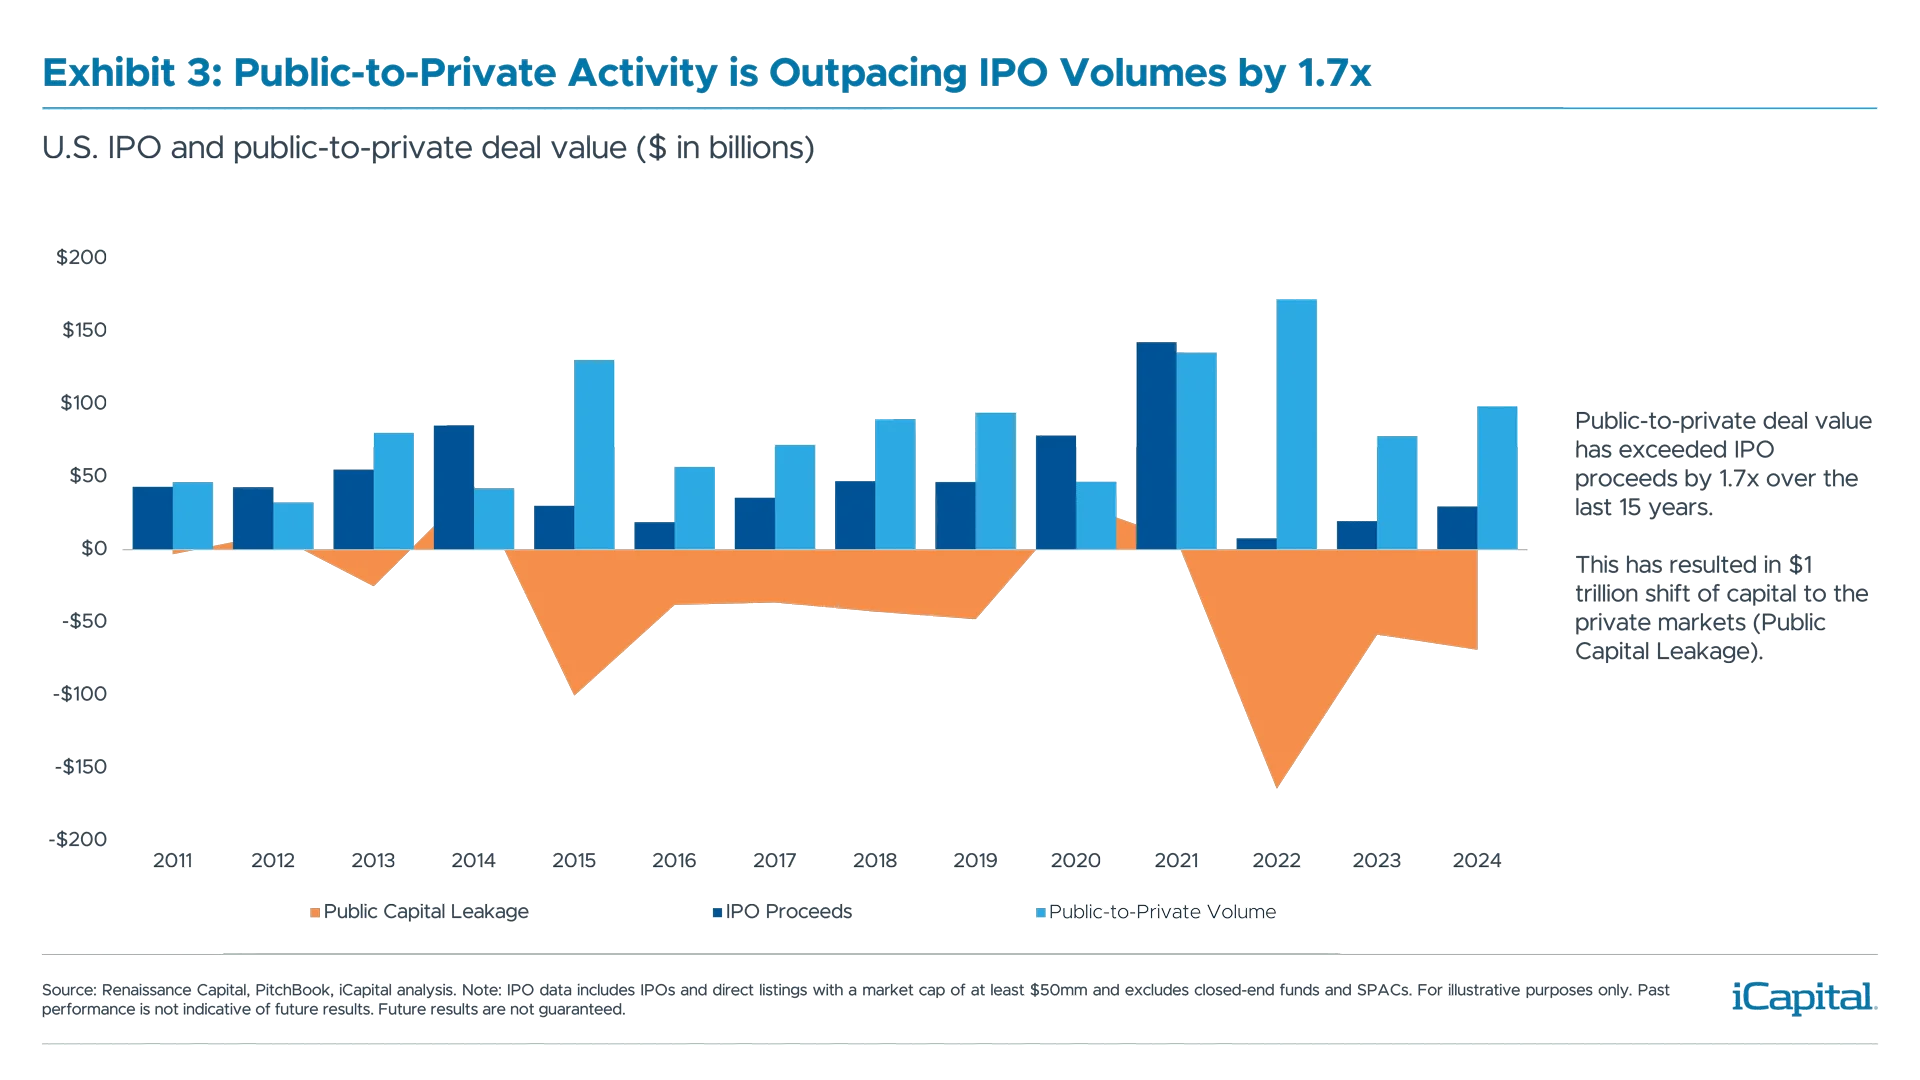
This trend is likely to continue as the investor universe in private equity expands and public markets aren’t replenished at the pace that they’re being privatized. Over the last fifteen years, U.S. public-to-private value have outpaced IPO proceeds by 1.7x (Exhibit 3). This amounts to a $1 trillion capital relocation to the private markets (Exhibit 3). Even in periods where IPO activity seemed to be recovering, its recovery has been relatively brief.
And the size of the largest private equity funds, once defined as those with $5 billion or more in assets, has increased dramatically—the average size of the five largest funds raised annually since 2016 is around $15 billion.6 More assets mean larger deals. These “mega funds” are increasingly likely to make $3 billion-plus transactions, focus on take-private transactions, and nurture companies in private ownership longer. To this point, the often-cited phrase “private companies are staying private longer” is becoming almost archaic since it implies that all private companies eventually want be public, when the reality is that many companies prefer to stay private and have no desire to go public. Why? Because they can secure ample equity and debt financing from the private capital markets and avoid the regulatory burdens, short-term scrutiny, and volatility of the public markets, which was not the case 20 years ago.
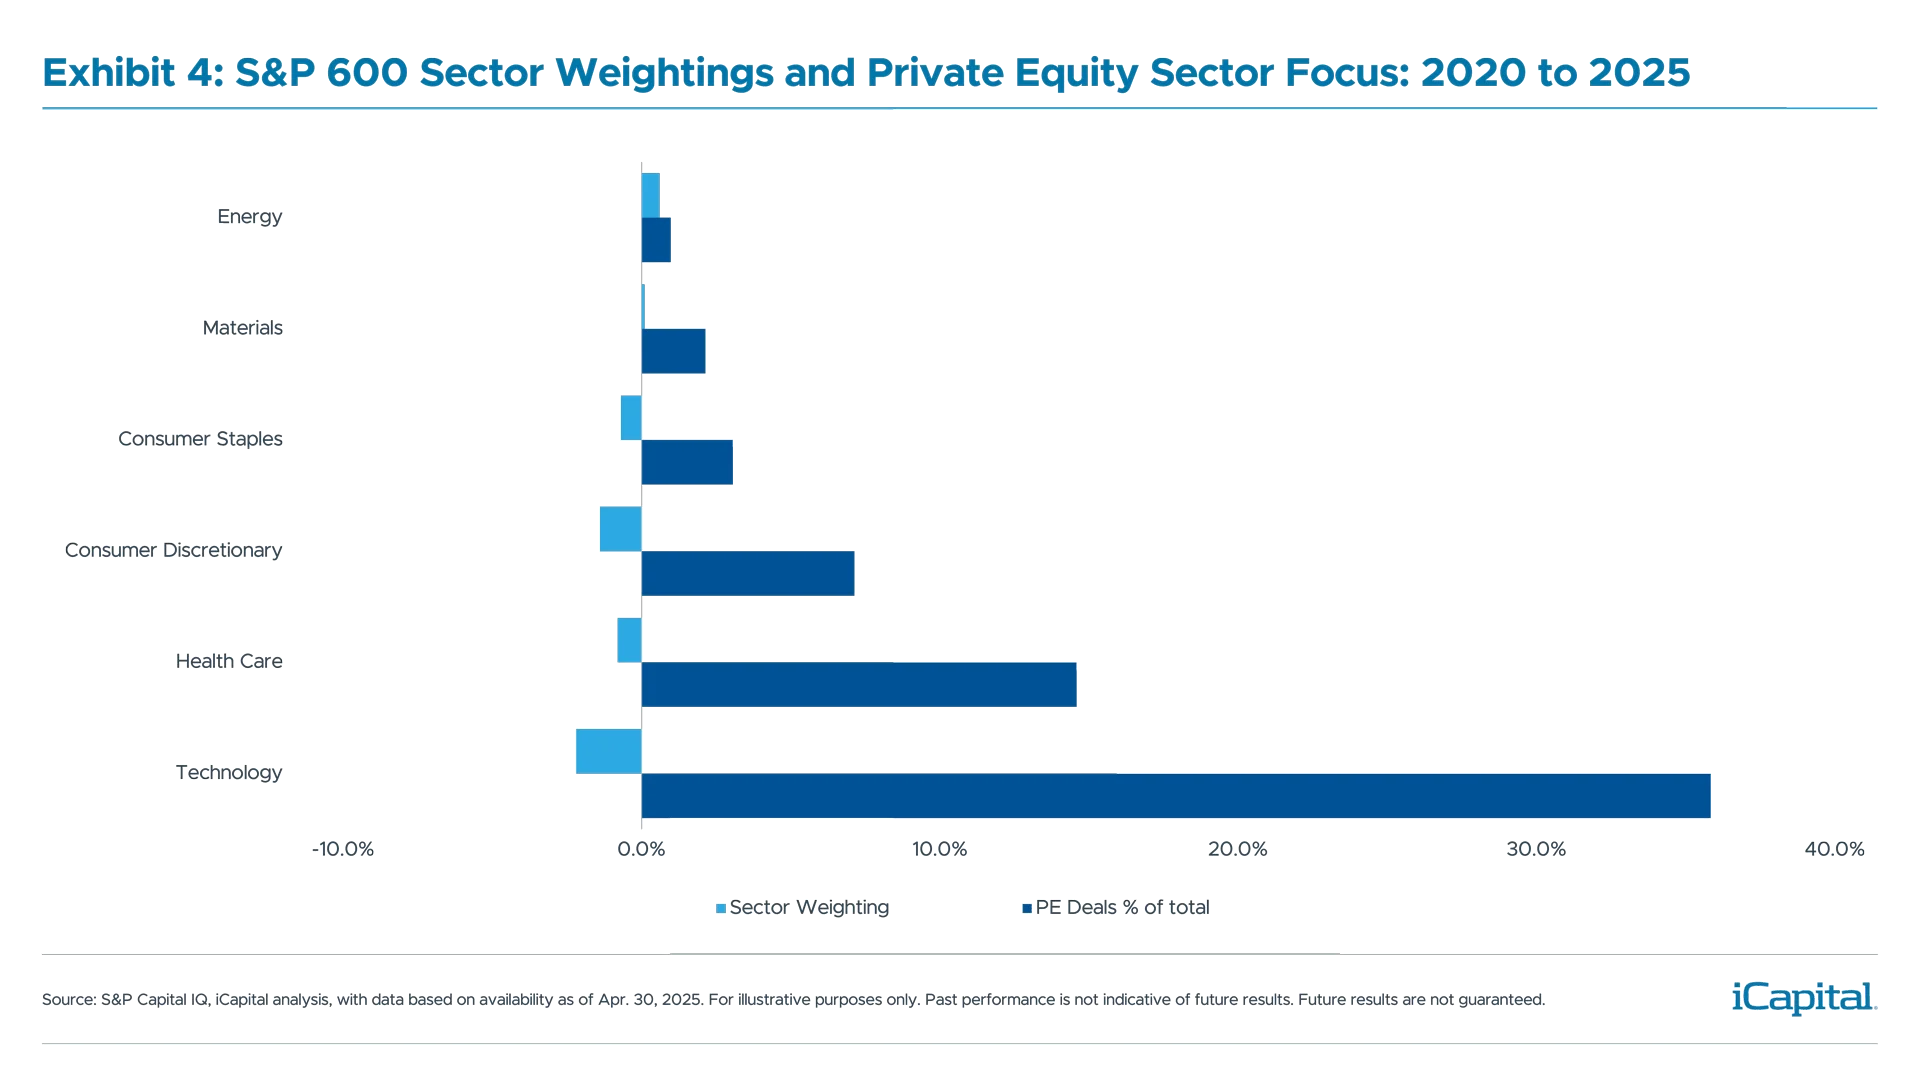
Not surprisingly, industries where private equity has been most actively focused – technology, health care, and consumer – have seen declines in their respective public market weightings. For instance, over the last five years 36% of private equity deal value has occurred in the technology sector. At the same time, technology’s weighting in the S&P 600 declined (Exhibit 4). Conversely, private equity has been less focused on energy and materials, which haven’t seen their weightings in the S&P 600 decrease.
Said another way, the replenishment process in sectors such as technology, health care and consumer has been more severely curtailed by private equity, resulting in an even more pronounced diversification shortfall for investors who are relying solely on public markets for comprehensive exposure to these sectors. At a moment when investors should have been increasing allocations to a sector like technology, some small-cap indices saw a relative reduction in technology exposure.
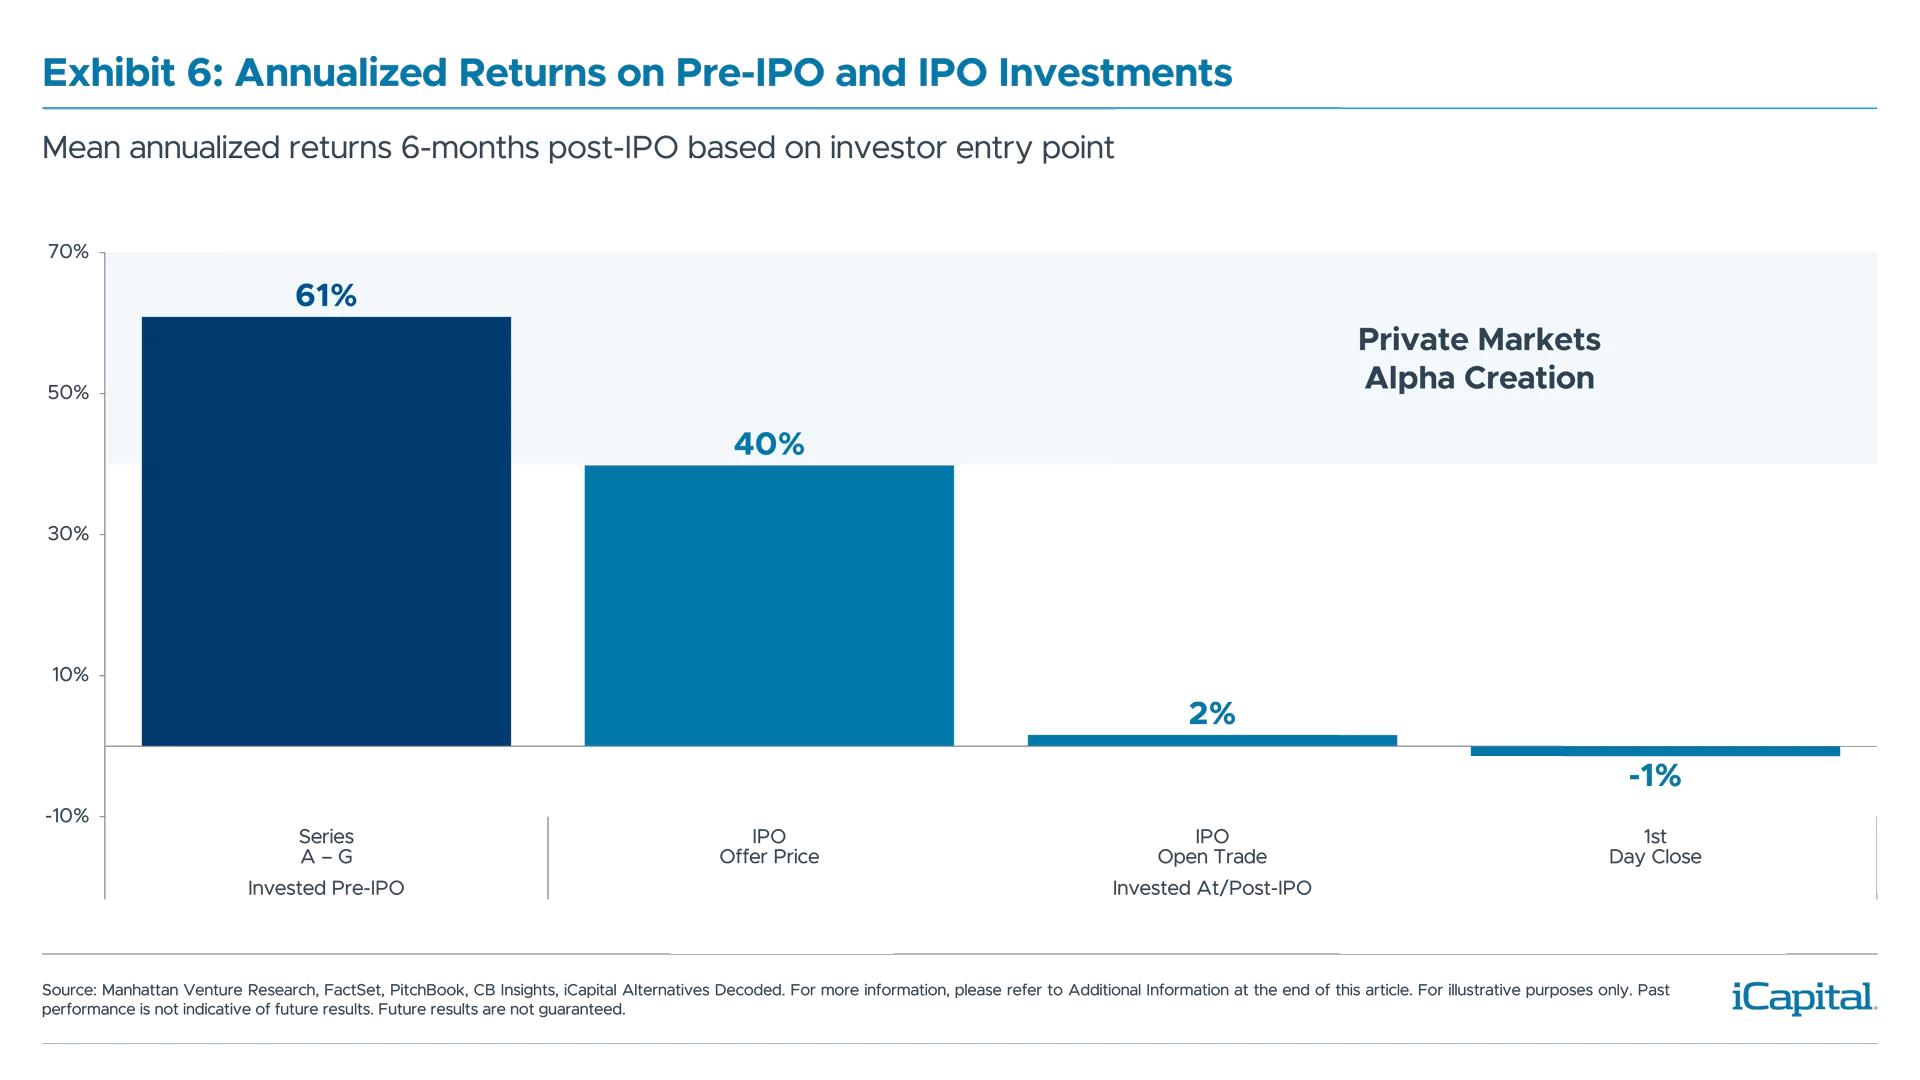
Moreover, the average investor has realized little benefit from the IPO market as most of the value creation has been occurring in the private markets. Almost two-thirds of IPO value creation is captured pre-IPO by the private markets (Exhibit 6).
A Hollowing Out of Public Equities Has Outcomes
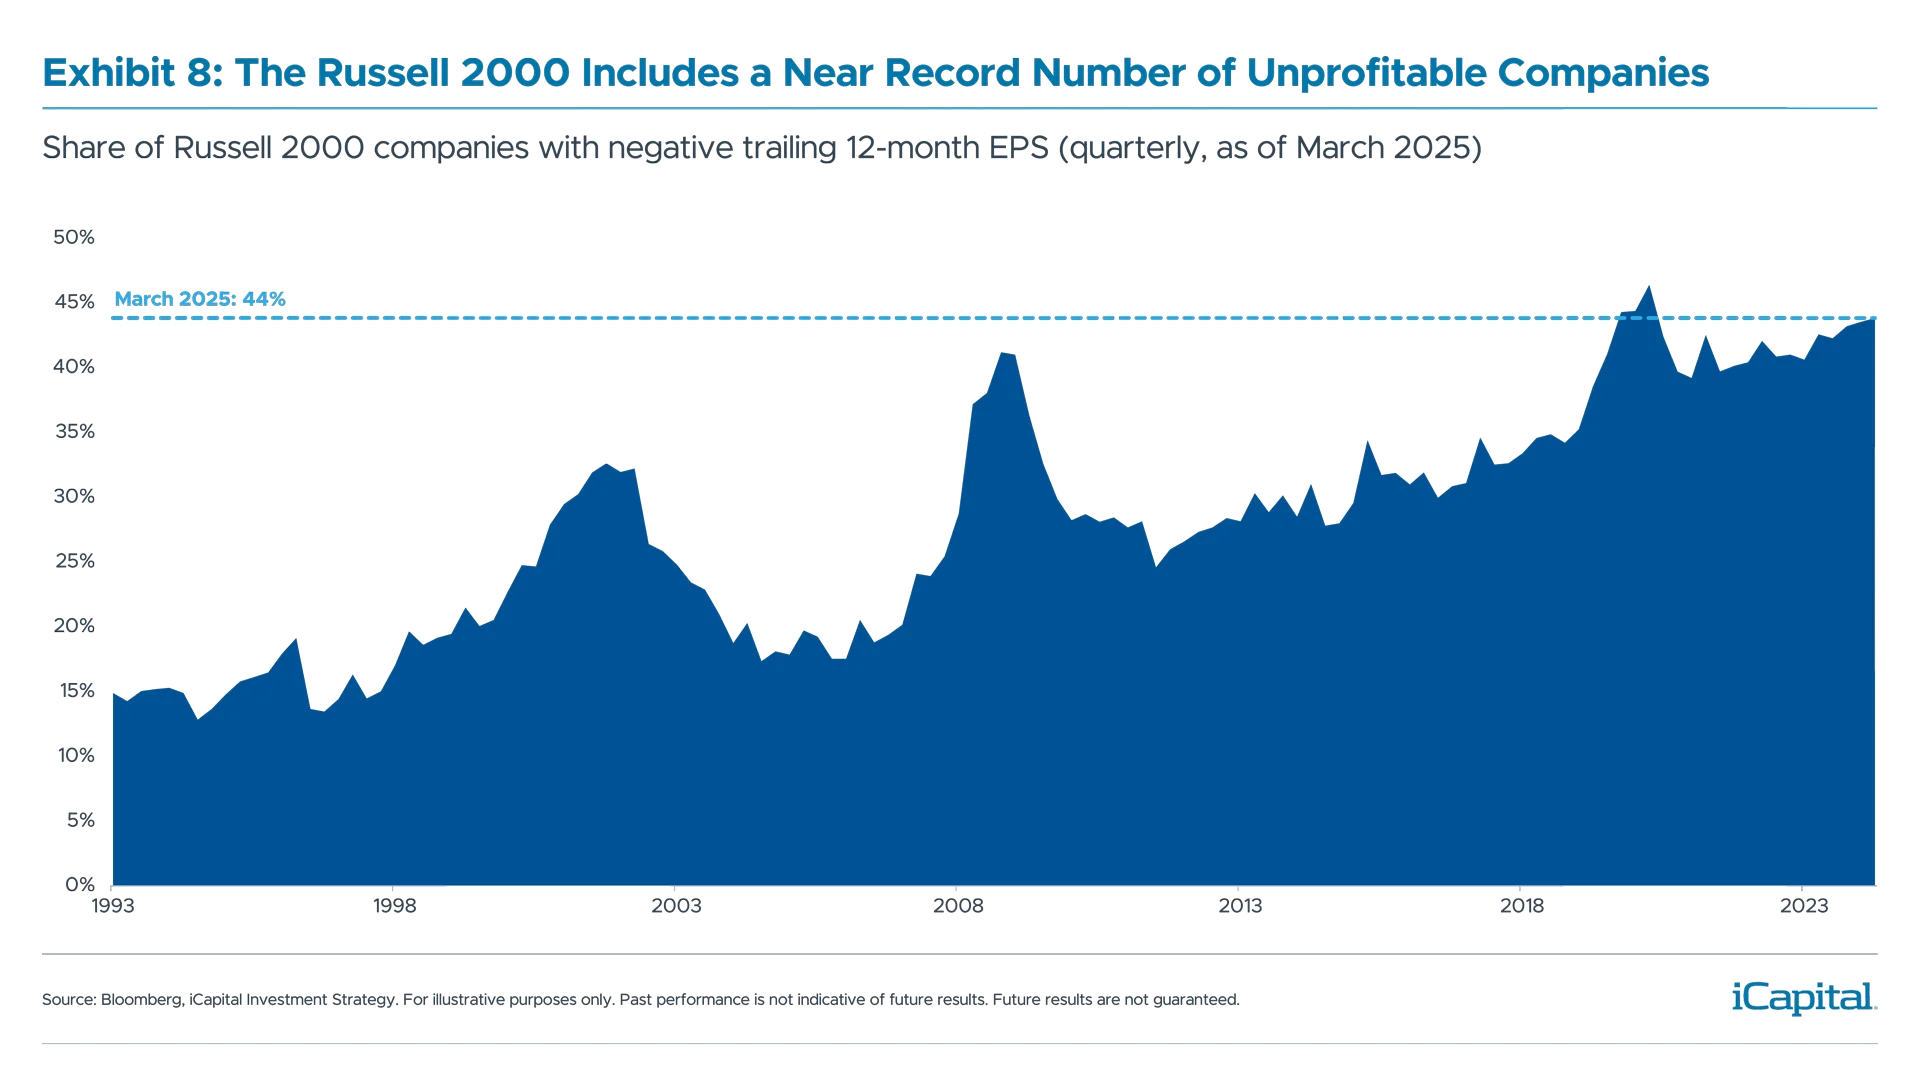
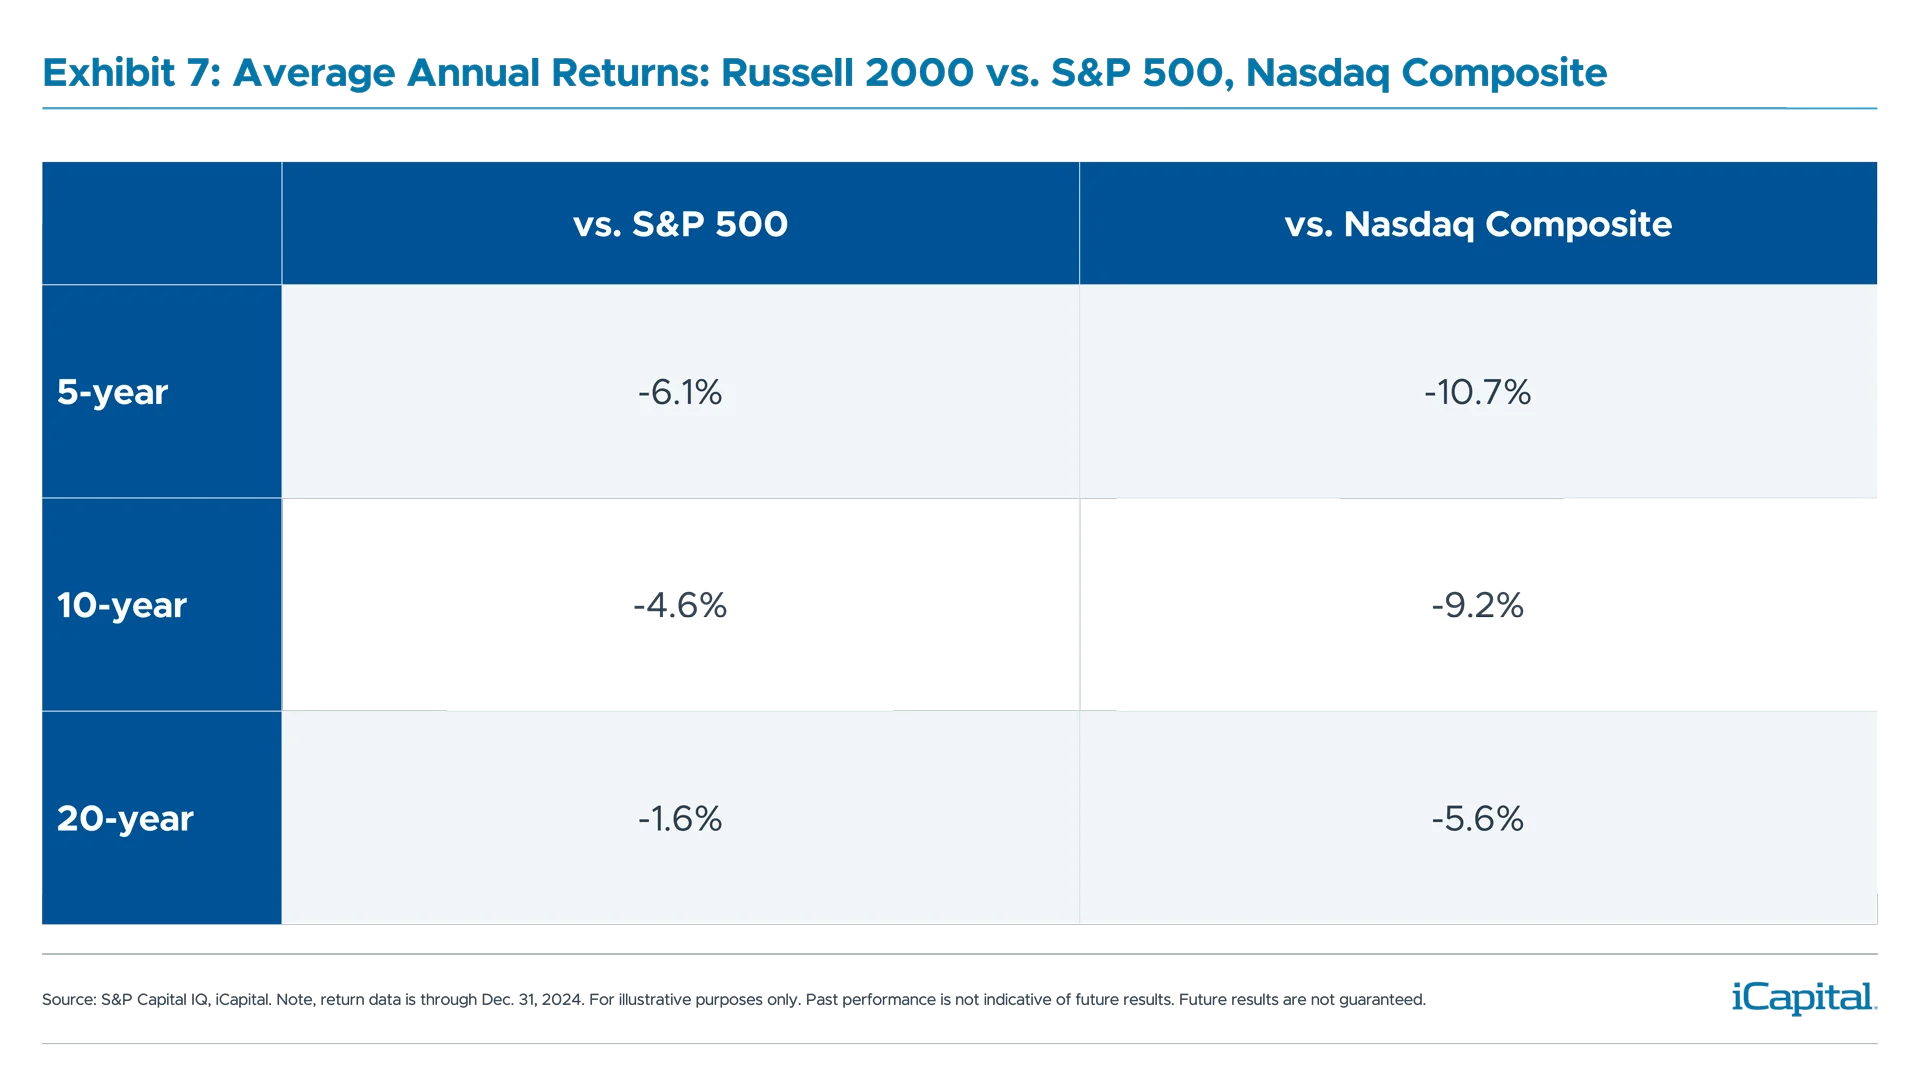
There are costly outcomes from these trends. Public small-caps are suffering from one of their worst runs of performance. The percentage of unprofitable companies in the Russell 2000 is now 44%, double the level from twenty years ago—and it has underperformed the S&P 500 Index by 600 basis points annually over the last five years (Exhibits 7,8). This underperformance has rapidly widened compared to 10- and 20-year performance comparisons, and would seem to defy long-term conventional thinking that smaller companies are expected to grow faster and provide outperformance over larger, more mature businesses.
Take what happened in 2021, for example, when a significant number of operating company IPOs priced.7 A record $120 billion was raised in the process yet, as of March 2025, the average three-year return for this IPO class was a 49% loss compared to an average three-year return of +19.4% for all IPOs from 1980-2023.8 In contrast, private equity returns have been more stable, with buyout strategies averaging 14.7% annual returns over the past 10 years.9
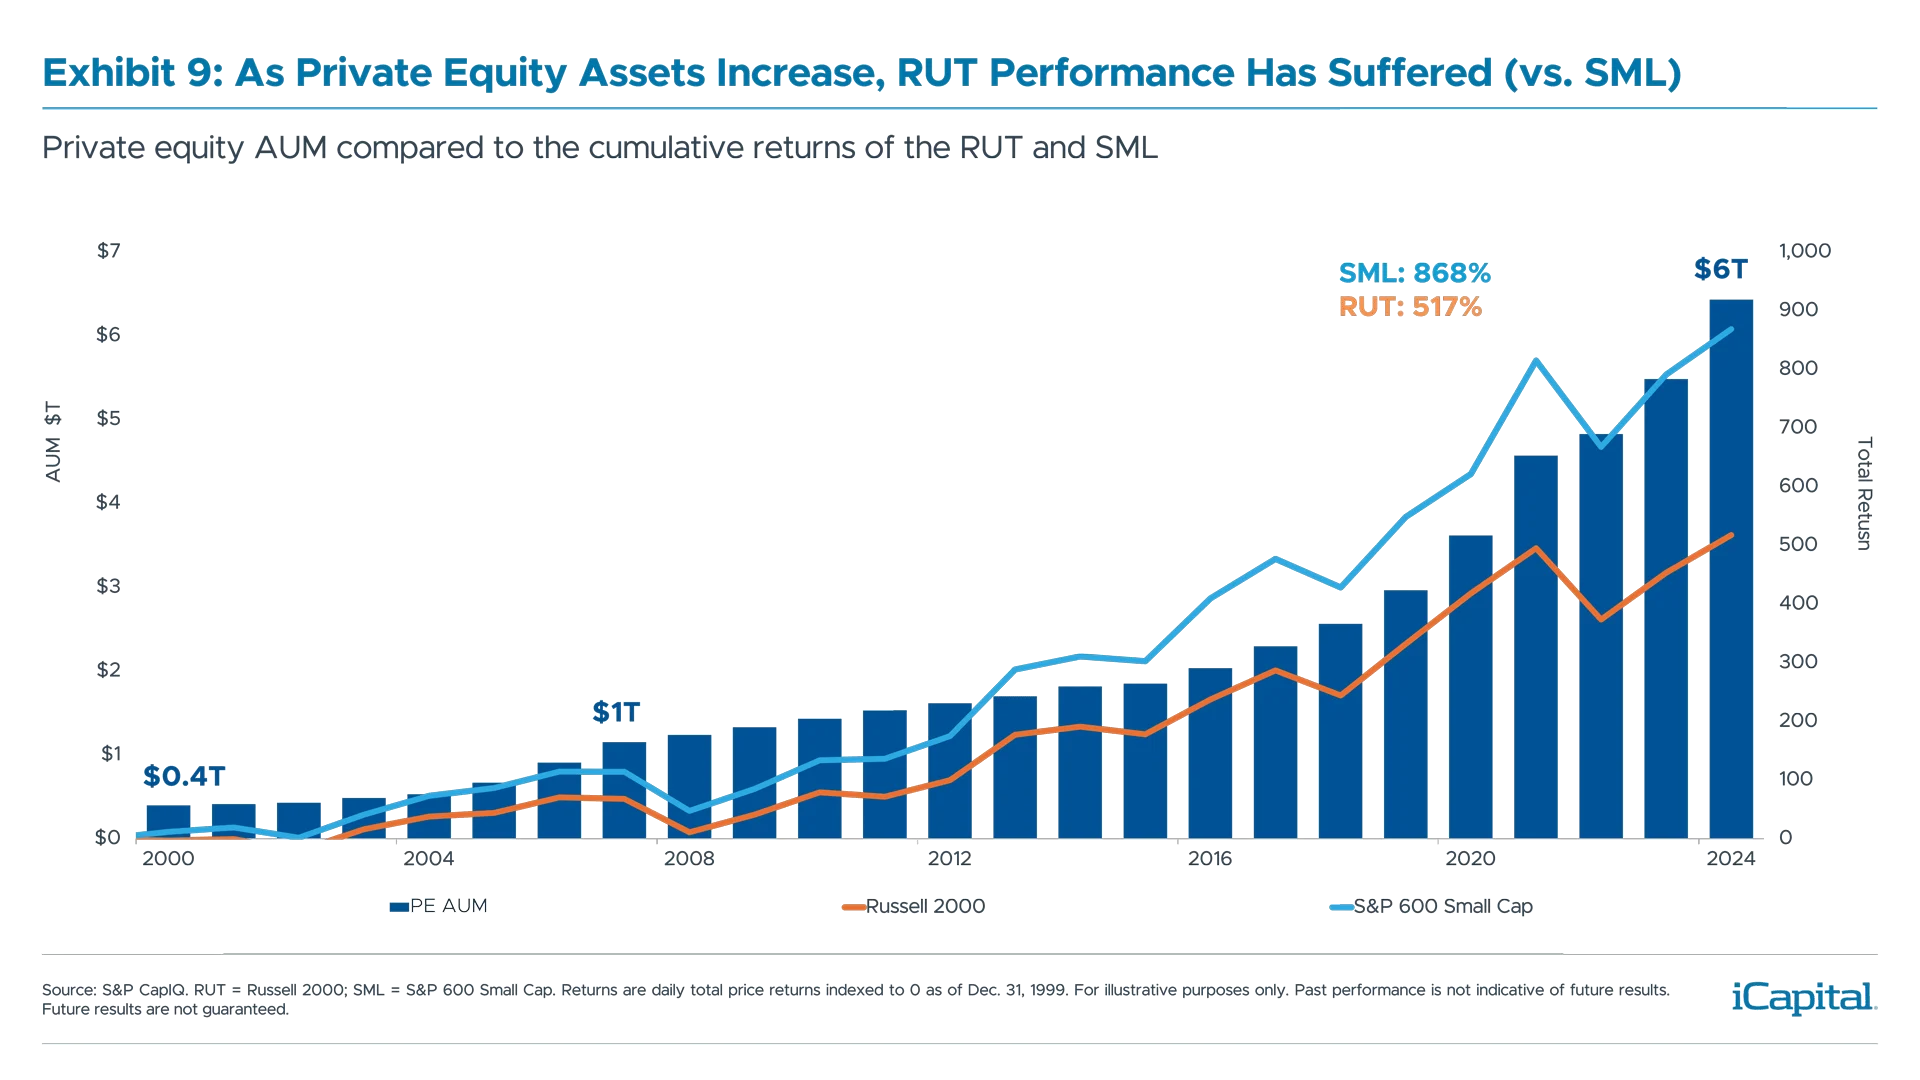
Historically, the Russell 2000 mirrored the performance of the S&P 600 Index. More recently, however, there has been a widening divergence between the two (Exhibit 9). Why? To be included in the S&P 600, companies must be profitable. Looking at it another way, private equity’s backing of increasingly larger, stable, positive cash flowing companies has changed the mix of companies entering the Russell 2000. In fact, only 25% of IPOs were profitable in 2021, a peak IPO year, compared to 80% in the early 1980s. And more recent IPOs are not more profitable. About 85% of U.S. unicorns ($1 billion-plus pre-IPO valuation) that have gone public were unprofitable in 2023.10
Private + Public = Investable Opportunity
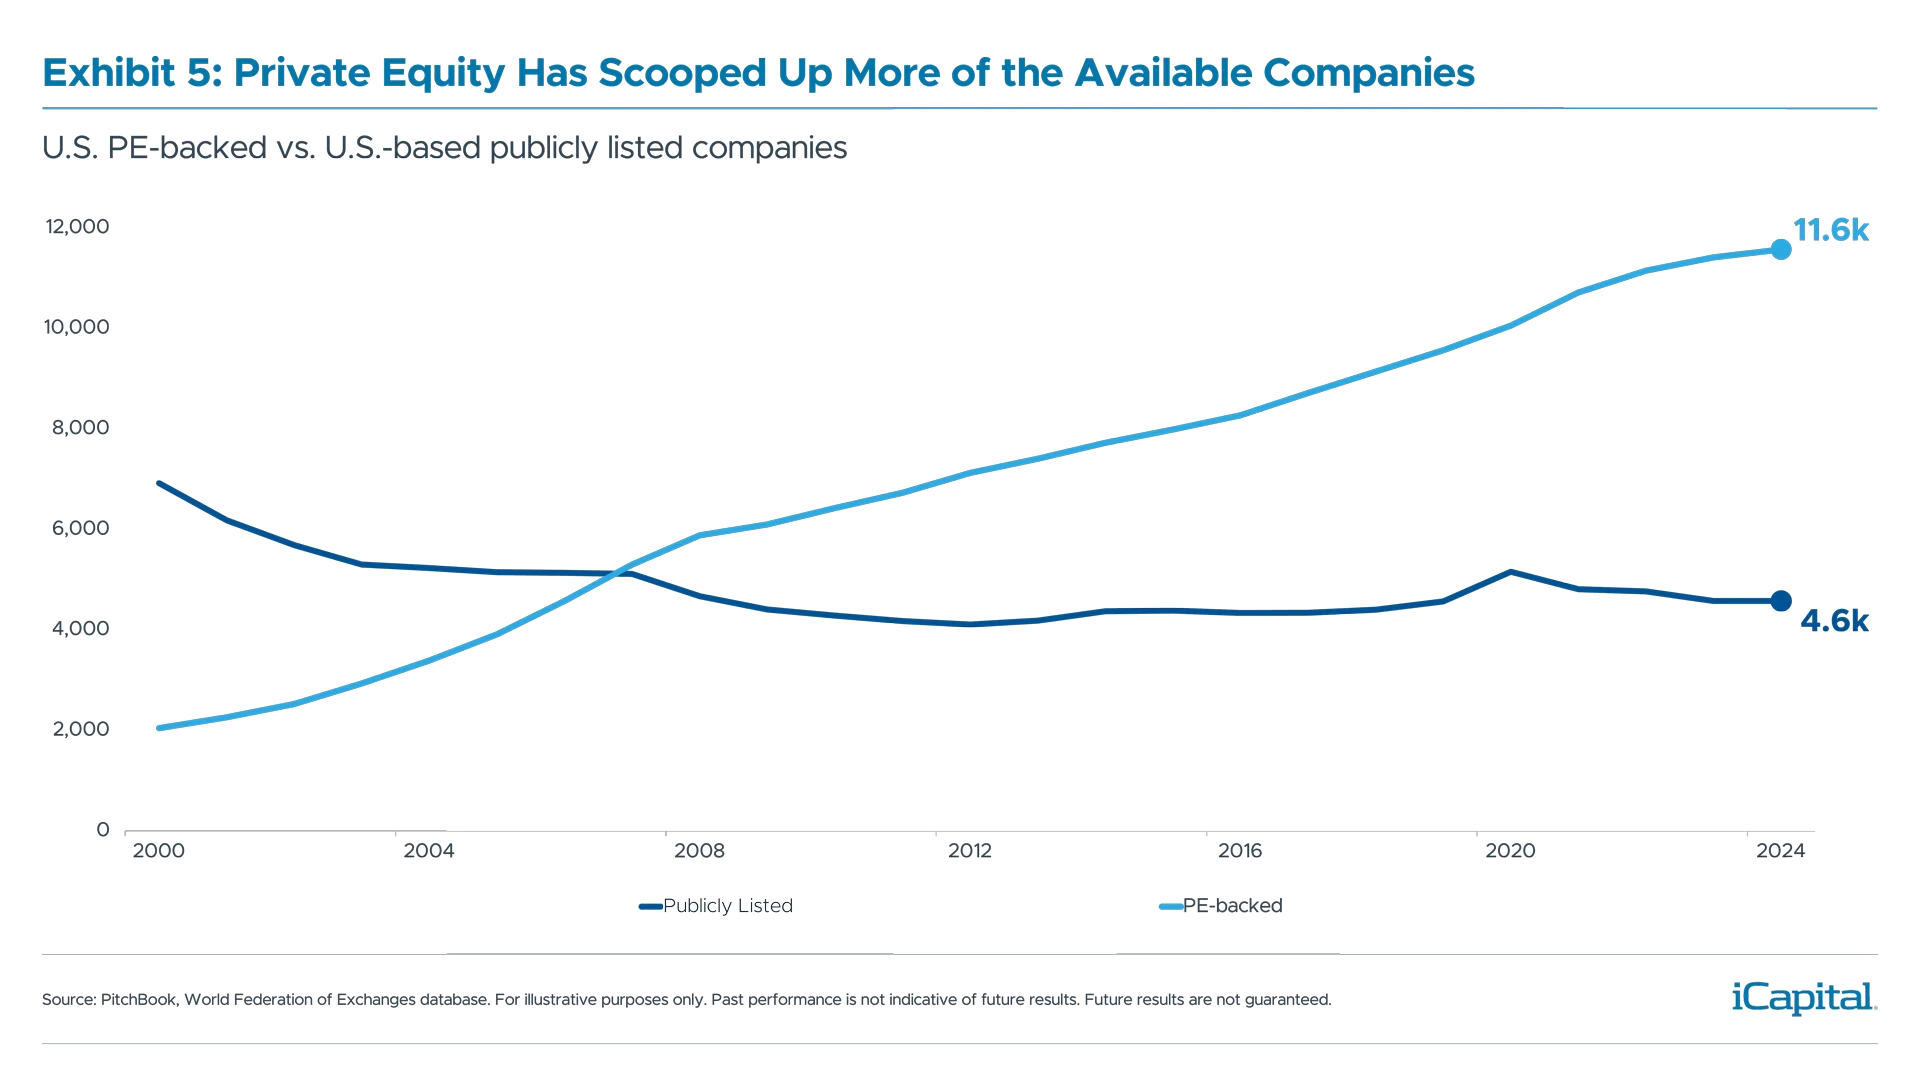
With the continued expansion of private equity-backed companies – which have increased from about 2,000 to 11,500 since 2000 – it makes sense that individual investors should reevaluate how they achieve diversification and market exposure.11
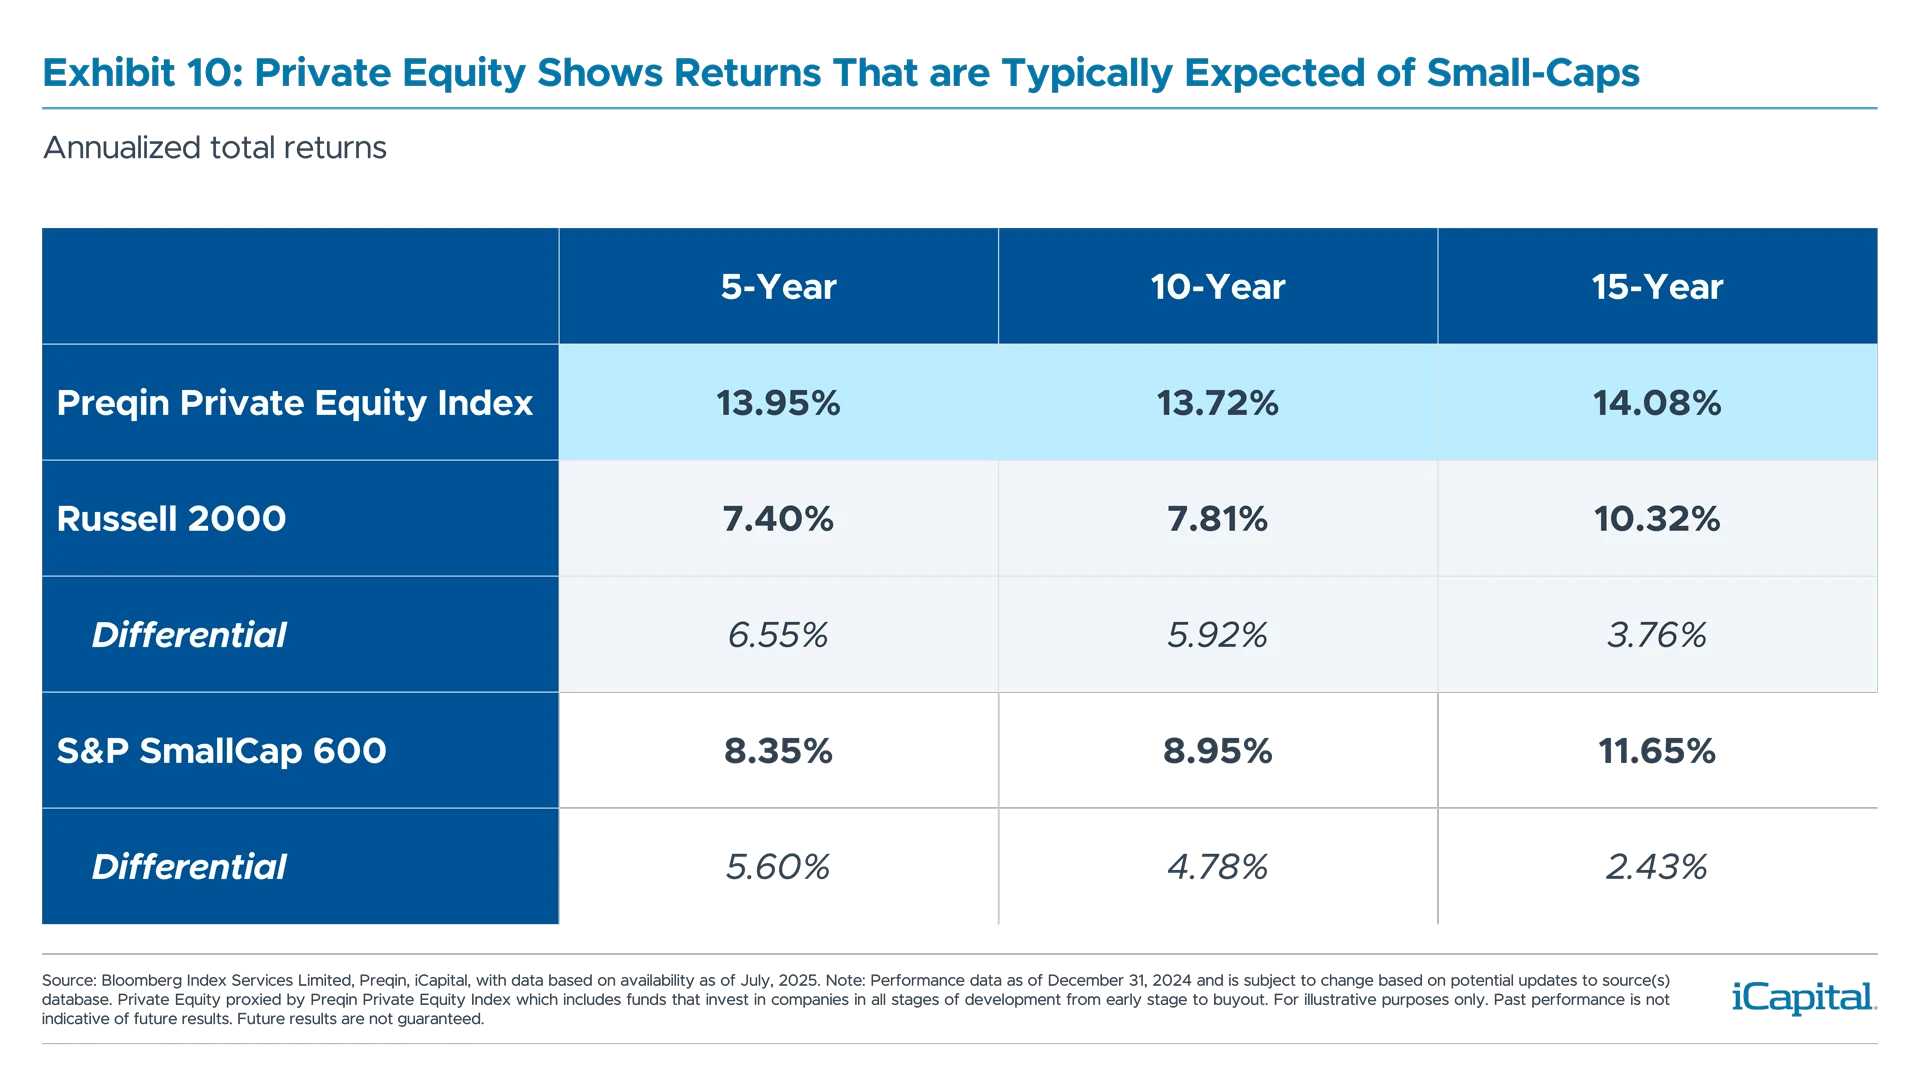
And, of course, it’s not just about diversification, but also potentially enhancing returns. Private equity has outperformed the S&P 600 and the Russell 2000 on both a short- and long-term basis, with annual outperformance of about six percentage points over the last five- and ten-year periods (Exhibit 10). In fact, annualized private equity returns resemble what many have historically expected from small-cap indices where higher growth can offer higher potential returns.
Institutional investors (e.g., pension funds, insurance companies, endowments, and sovereign funds) have been the main beneficiaries of this trend until now, as they have provided most of the capital behind the private equity industry and captured the diversification and upside. The good news is that while replicating an institutional approach was difficult for most investors a decade ago, it’s much easier to address today because of the wide variety of quality evergreen fund structures and other vehicles available to the 24 million U.S. accredited investor households.12
Therefore, if higher-growth, profitable investable companies are increasingly spread across public and private markets, and private equity is increasingly accessible to the average investor, the two asset classes should be framed together for proper portfolio construction.
Distinctions are Narrowing
It is increasingly clear that the way to gain total market exposure should include allocations to both public and private equity. The distinction between these markets is in some ways narrowing – driven by a greater proportion of larger, high-performing private companies and significant improvements in convenience and access from a growing number of evergreen private equity funds. Responding to these market changes may not require a rewrite of modern portfolio theory, but perhaps a rethink of how to build an equity allocation across public and private markets.
ADDITIONAL INFORMATION
Exhibit 6: Data based on availability as of Apr. 30, 2025. Note: Analysis as of May 9, 2022, and is subject to change based on potential updates to source(s) database. Analysis includes all technology media and telecommunication (TMT) IPOs over the 10-year period from 2011 to December 2021, where data was sufficiently available. Includes only companies with US IPOs listed in FactSet and CB Insights during this period, and excludes IPOs on non-US exchanges as well as companies that went public through SPAC mergers. The sample includes 768 startups across Series A through Series G. Series-level values are calculated as weighted average returns based on the respective sample sizes.
INDEX DEFINITIONS
NASDAQ Composite Index: An index that measures all NASDAQ domestic and international based common type stocks listed on The NASDAQ Stock Market. The NASDAQ Composite is a capitalization-weighted index.
Preqin Private Equity Index: The index covers closed-end funds captured in the broader Private Capital Index, including funds/strategies that invest in companies in all stages of development from early stage to buyout, as defined by Preqin.
Preqin Private Equity Buyout Index: The index covers closed-end funds captured in the broader Private Capital Index including funds/strategies listed as Buyout, as defined by Preqin.
Russell 2000 Index: Measures the performance of approximately 2,000 small-cap US equities. Stocks in the Russell U.S. indices are weighted by their available (also called float-adjusted) market capitalization.
S&P 500 Index: The S&P 500 is widely regarded as the best single gauge of large-cap U.S. equities. The index includes 500 of the top companies in leading industries of the U.S. economy and covers approximately 80% of available market capitalization.
S&P SmallCap 600 Index: The index seeks to measure the small-cap segment of the U.S. equity market. The index is designed to track companies that meet specific inclusion criteria to ensure that they are liquid and financially viable.
ENDNOTES
- S&P Capital IQ, iCapital analysis; 10-year period is 2015 through 2024.
- Bloomberg Index Services, 10-year period is 2015 through 2024; The World Federation of Exchanges, as of May 2025.
- Pitchbook analysis, 10-year period is 2015 through 2024; data as of July 2025.
- Bloomberg Index Services, S&P Capital IQ for index constituents, data as of June 2025.
- Preqin, iCapital Alternatives Decoded for private equity AUM data, with data based on availability as of April 2025.
- PitchBook, “Fundraising by Size Bucket”, data as of May 2025.
- University of Florida, Jay Ritter, Initial Public Offerings: Updated Statistics, July 2, 2025. Operating company IPO excludes ADRs, unit offers, closed-end funds, REITs, natural resource limited partnerships, small best efforts offers, banks and S&Ls, and stocks not listed on the Amex, NYSE and Nasdaq.
- University of Florida, Jay Ritter, Initial Public Offerings: Updated Statistics, July 2, 2025.
- Preqin, iCapital Alternatives Decoded, with data based on availability as of Apr. 30, 2025. Buyout proxied by Preqin Private Equity Buyout Index
- University of Florida, Jay Ritter, Initial Public Offerings: Updated Statistics, July 2, 2025; American Affairs Foundation, “Why Are Start-Ups Losing So Much Money?”, Winter 2024.
- PitchBook | LCD, World Federation of Exchanges database, iCapital Alternatives Decoded.
- U.S. Securities and Exchange Commission, “Remarks at the 51st Annual Securities Regulation Institute”, January 22, 2024
IMPORTANT INFORMATION
The material herein has been provided to you for informational purposes only by Institutional Capital Network, Inc. (“iCapital Network”) or one of its affiliates (iCapital Network together with its affiliates, “iCapital”).
This material is the property of iCapital and may not be shared without the written permission of iCapital. No part of this material may be reproduced in any form, or referred to in any other publication, without express written permission of iCapital. This material is provided for informational purposes only and is not intended as, and may not be relied on in any manner as, legal, tax or investment advice, a recommendation, or as an offer or solicitation to buy or sell any security, financial product or instrument, or otherwise to participate in any particular trading strategy. This material does not intend to address the financial objectives, situation, or specific needs of any individual investor. You should consult your personal accounting, tax, and legal advisors to understand the implications of any investment specific to your personal financial situation.
ALTERNATIVE INVESTMENTS ARE CONSIDERED COMPLEX PRODUCTS AND MAY NOT BE SUITABLE FOR ALL INVESTORS. Prospective investors should be aware that an investment in an alternative investment is speculative and involves a high degree of risk. Alternative investments often engage in leveraging and other speculative investment practices that may increase the risk of investment loss; can be highly illiquid; may not be required to provide periodic pricing or valuation information to investors; may involve complex tax structures and delays in distributing important tax information; are not subject to the same regulatory requirements as mutual funds; and often charge high fees. There is no guarantee that an alternative investment will implement its investment strategy and/or achieve its objectives, generate profits, or avoid loss. An investment should only be considered by sophisticated investors who can afford to lose all or a substantial amount of their investment.
iCapital Markets LLC operates a platform that makes available financial products to financial professionals. In operating this platform, iCapital Markets LLC generally earns revenue based on the volume of transactions that take place in these products and would benefit from an increase in sales for these products.
The information contained herein is an opinion only, as of the date indicated, and should not be relied upon as the only important information available. Any prediction, projection, or forecast on the economy, stock market, bond market, or the economic trends of the markets is not necessarily indicative of the future or likely performance. The information contained herein is subject to change, incomplete, and may include information and/or data obtained from third-party sources that iCapital believes, but does not guarantee, to be accurate. iCapital considers this third-party data reliable, but does not represent that it is accurate, complete and/or up to date, and it should not be relied on as such. iCapital makes no representation as to the accuracy or completeness of this material and accepts no liability for losses arising from the use of the material presented. No representation or warranty is made by iCapital as to the reasonableness or completeness of such forward-looking statements or to any other financial information contained herein.
Securities products and services are offered by iCapital Markets, an SEC-registered broker-dealer, member FINRA and SIPC, and an affiliate of iCapital, Inc. and Institutional Capital Network, Inc. These registrations and memberships in no way imply that the SEC, FINRA, or SIPC have endorsed any of the entities, products, or services discussed herein. Annuities and insurance services are provided by iCapital Annuities and Insurance Services LLC, an affiliate of iCapital, Inc. “iCapital” and “iCapital Network” are registered trademarks of Institutional Capital Network, Inc. Additional information is available upon request.
©2025 Institutional Capital Network, Inc. All Rights Reserved.


