Third-quarter earnings could be among the strongest of this century, but even that may not be enough for investors. We estimate that underlying S&P 500 earnings could rise roughly 32% from a year ago, modestly faster than last quarter after stripping out unusually large investment gains and tariff refunds. Reported growth may be lower than last quarter’s roughly 50% surge, but the quality of that growth should improve. The more important question is whether this quarter marks the peak in underlying profit growth, particularly as interest rates remain elevated.
1. How much of earnings growth is repeatable?
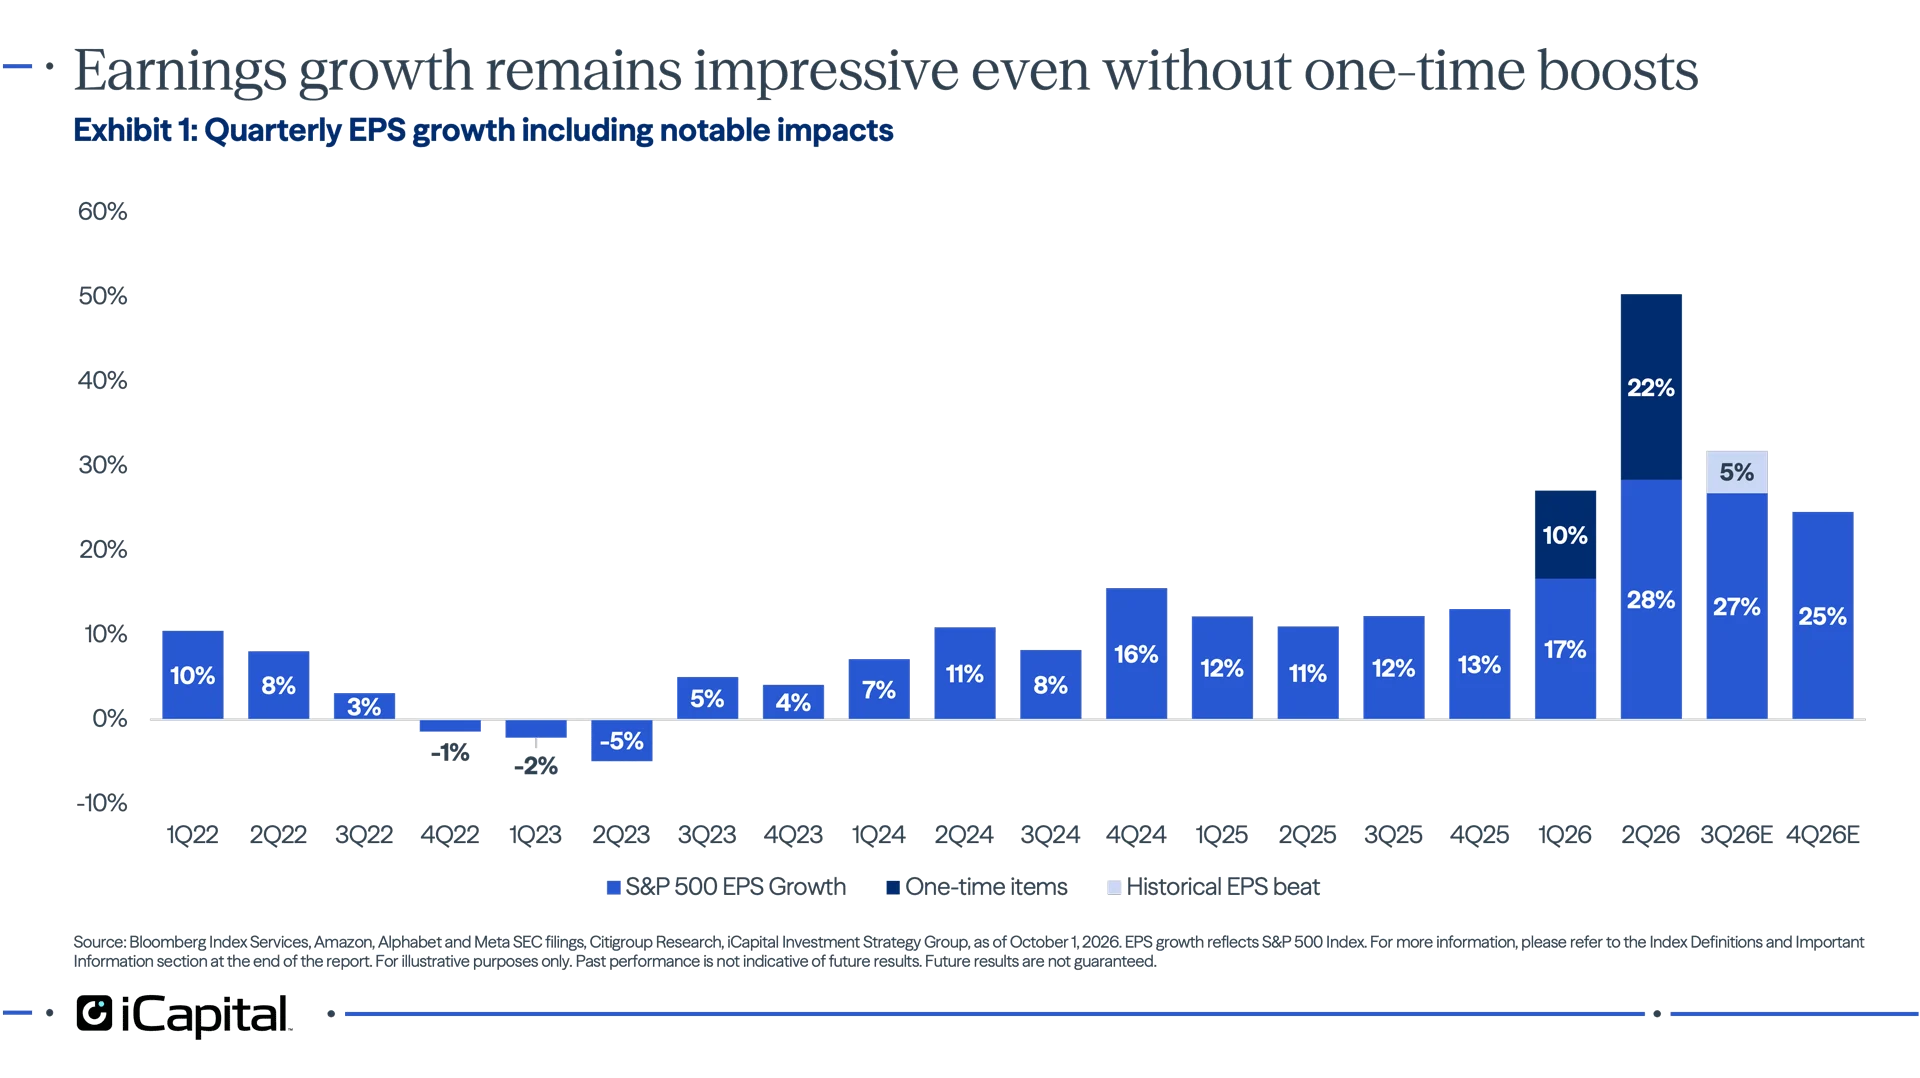
Last quarter produced the strongest S&P 500 earnings growth of this century outside the rebounds following the global financial crisis and the pandemic.1 Yet nearly 22 percentage points of that growth came from one-time items, including gains tied to AI-related investments and tariff refunds (Exhibit 1). Excluding those benefits, underlying growth was closer to 28%.
This quarter should offer a cleaner test. Current estimates point to reported S&P 500 growth of about 27%. Applying a typical earnings beat would lift the result toward 32%, with less assistance from unusual gains. That would still be an impressive outcome, although consensus forecasts suggest it could represent the peak rate of growth.
 Investors should therefore look beyond headline earnings per share (EPS). Revenue growth, operating margins and free cash flow (FCF) conversion will provide better evidence of whether companies can sustain the current pace. With inflation pressures elevated and input costs rising, investors will also be watching for signs that companies retain enough pricing power to protect margins without sacrificing demand.
2. When will AI spending produce commensurate returns?
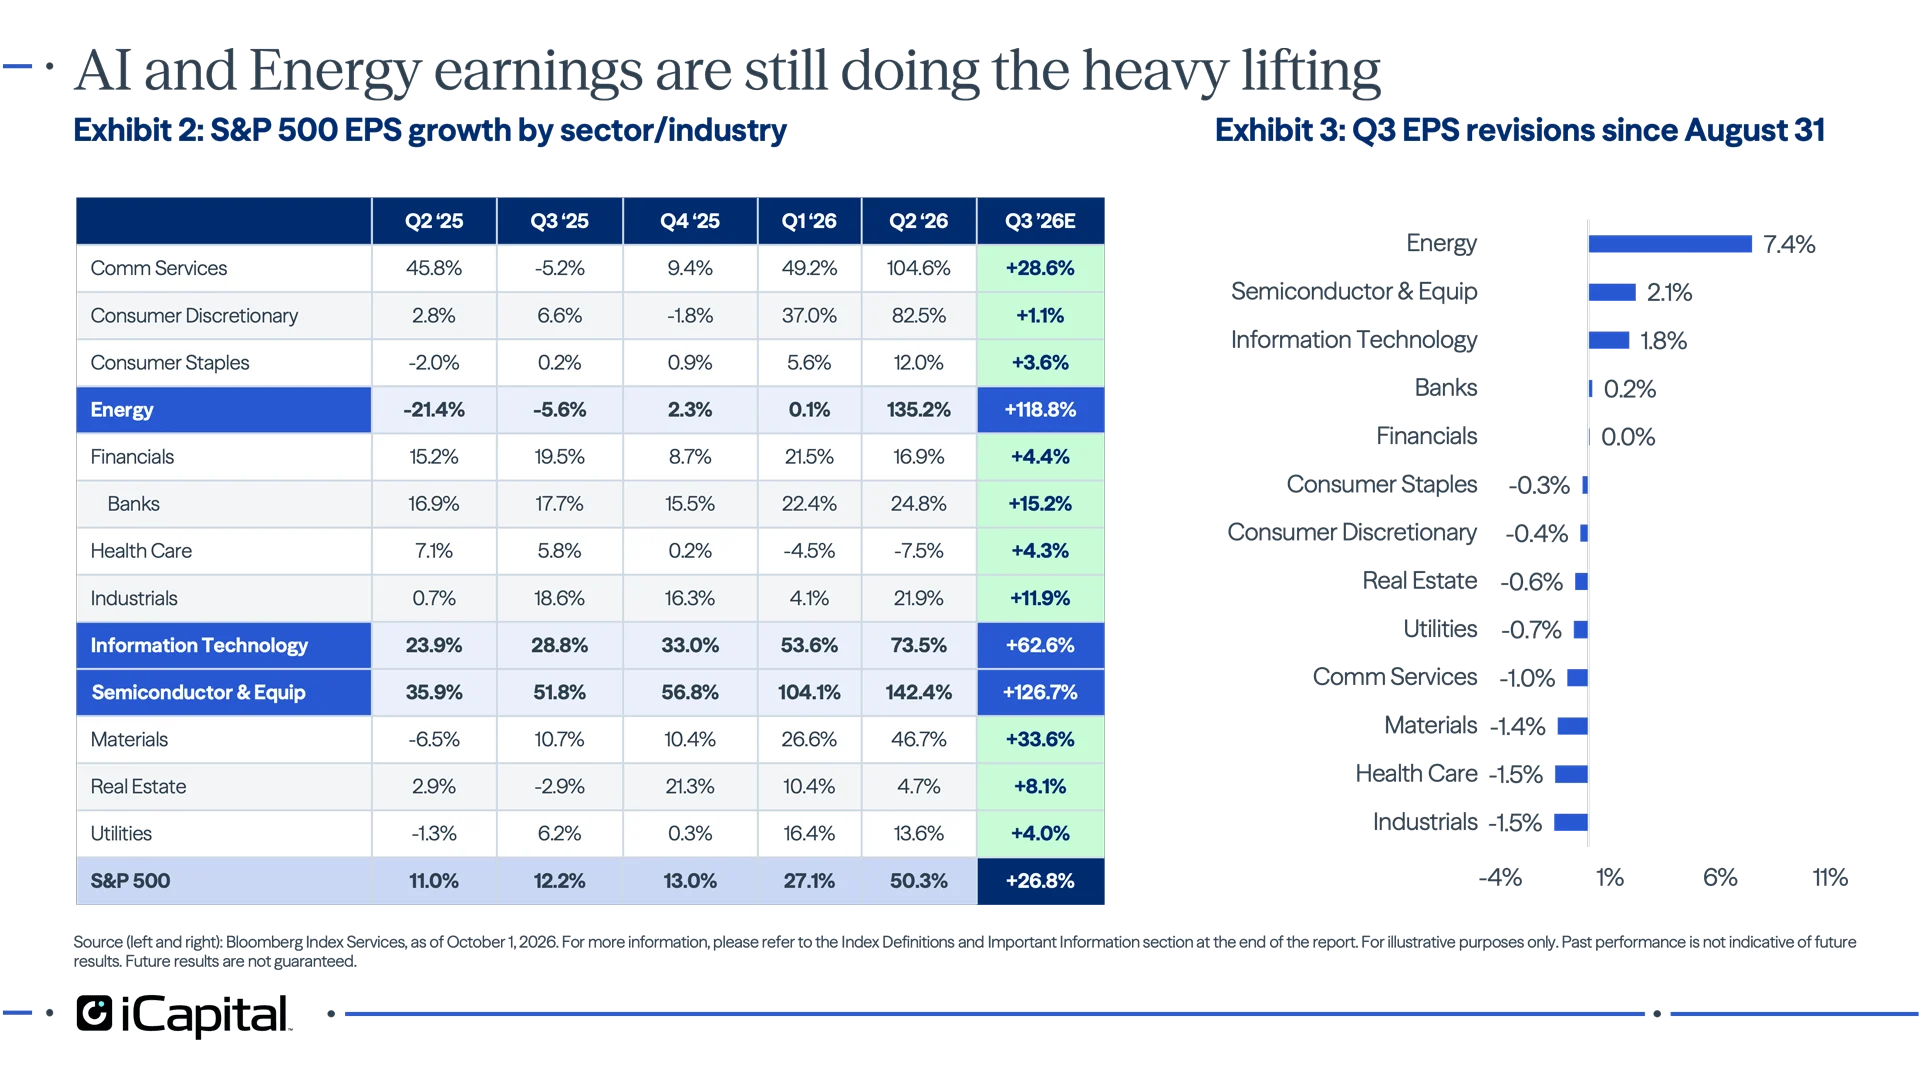
The AI investment cycle and elevated oil prices remain the market’s largest growth engines. Semiconductor and Semiconductor Equipment profits are expected to rise more than 125%, while Information Technology earnings are projected to grow over 60% (Exhibit 2). AI and Energy-related earnings are not only driving profit growth, they also continue to see the strongest upward estimate revisions (Exhibit 3). That reflects robust demand, but it also creates a formidable expectations hurdle.
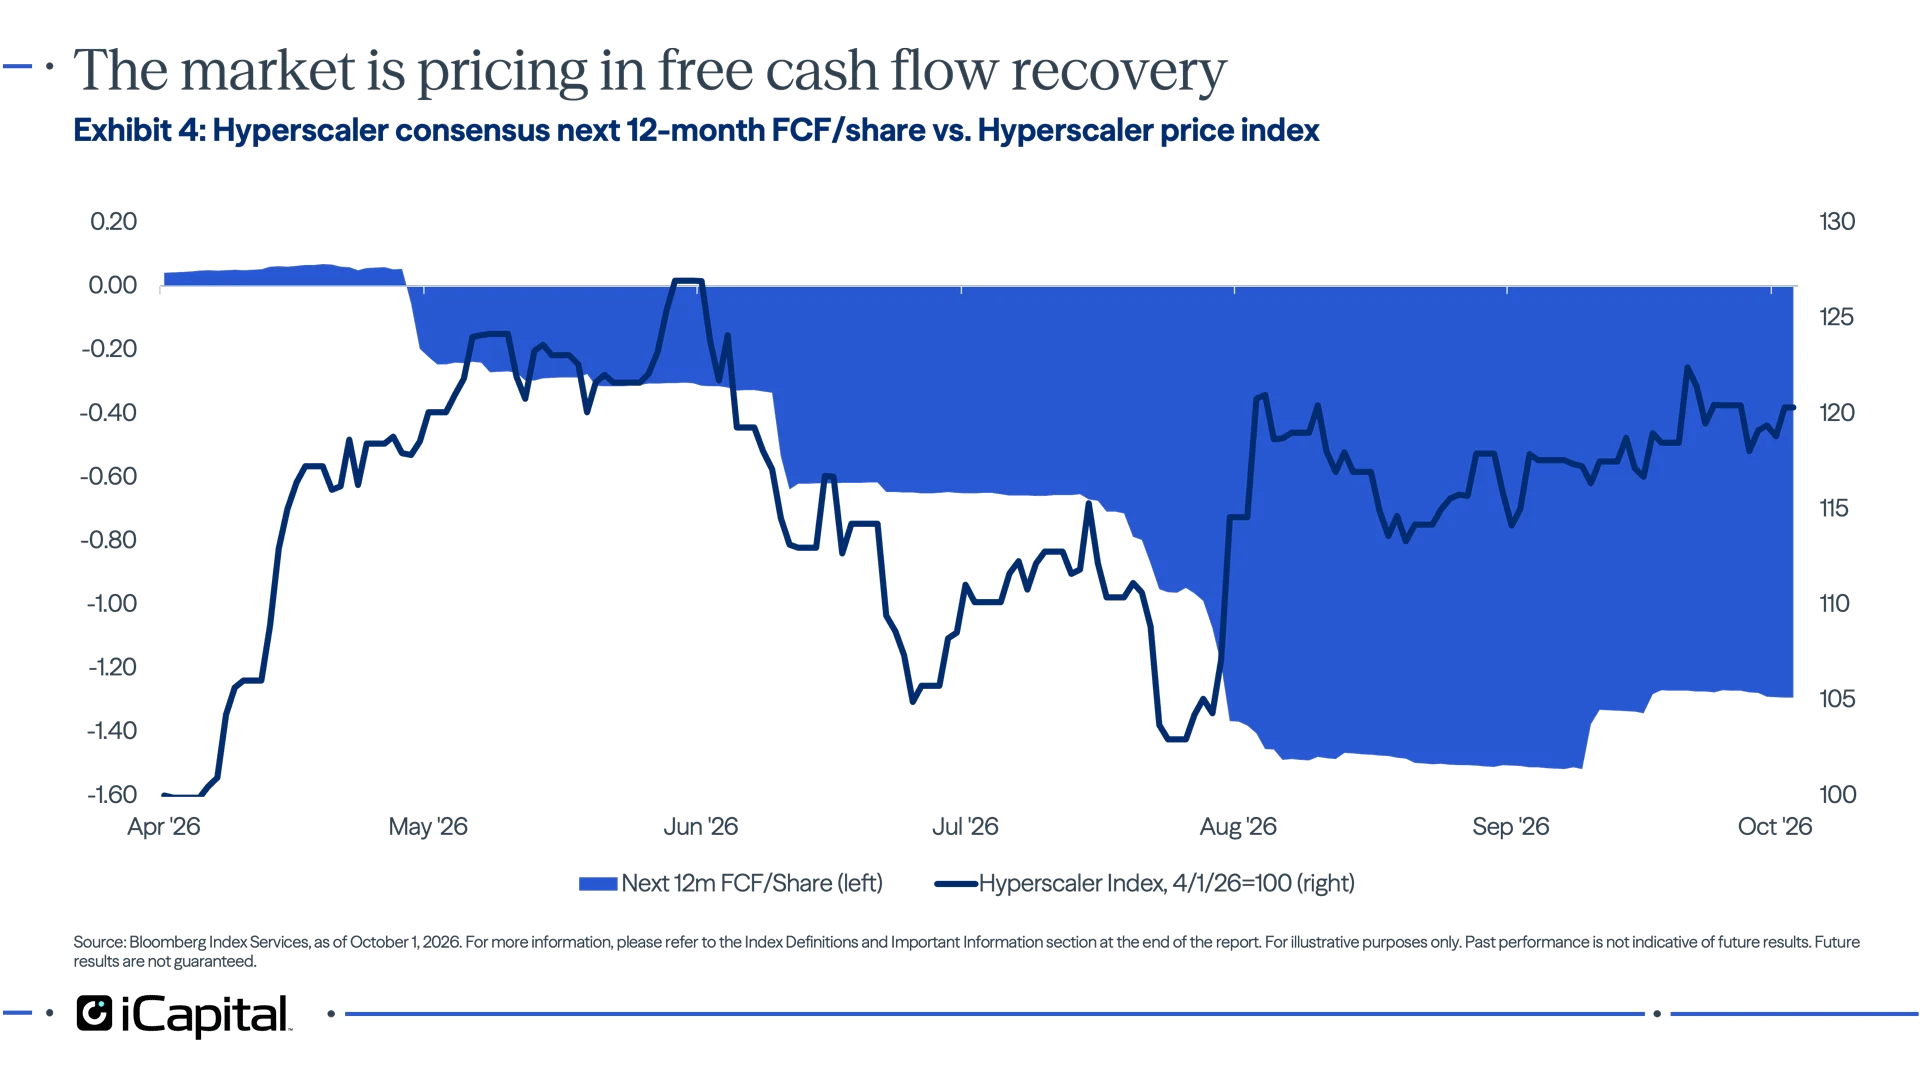
 The debate is shifting from spending to returns. Investors now want clearer evidence that the spending is generating revenue and producing an acceptable return on capital. When FCF estimates for the hyperscalers (large cloud services providers such as Amazon, Meta, and Microsoft) turned decisively negative in May, the market began to push back against rising capex. In recent months, however, hyperscaler stocks have rebounded as investors began pricing in improving FCF trends (Exhibit 4). This quarter, they will be looking for evidence that those expectations are justified. Spending can support the semiconductor supply chain today while putting pressure on hyperscaler margins and cash flow tomorrow.
 3. Can broader earnings produce broader market leadership?
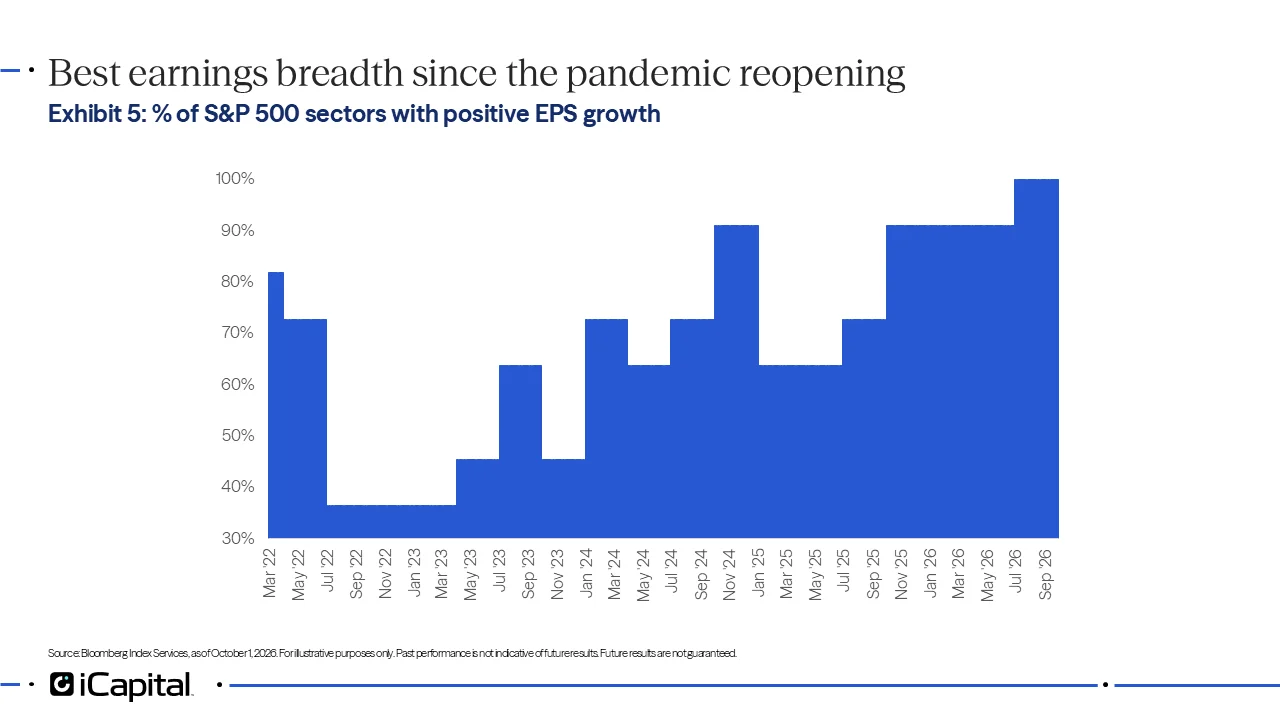
Expected earnings strength is increasingly extending beyond technology and AI. Energy profits are projected to more than double, while Materials, Communication Services, Banks and Industrials are expected to post double-digit growth.2 While the consumer sectors remain the notable laggards, consensus forecasts suggest the third quarter could be the first since the post-pandemic reopening in which all 11 sectors report positive EPS growth (Exhibit 5).
That breadth stands in sharp contrast to the market itself. Market leadership has narrowed, with the median sector down 8% from its 52-week high despite the S&P 500 reaching record levels (Exhibit 6). Technology’s resilience has supported the index while masking substantial weakness beneath the surface: nine of 11 sectors remain more than 5% below their highs, while utilities and real estate are down more than 10%.
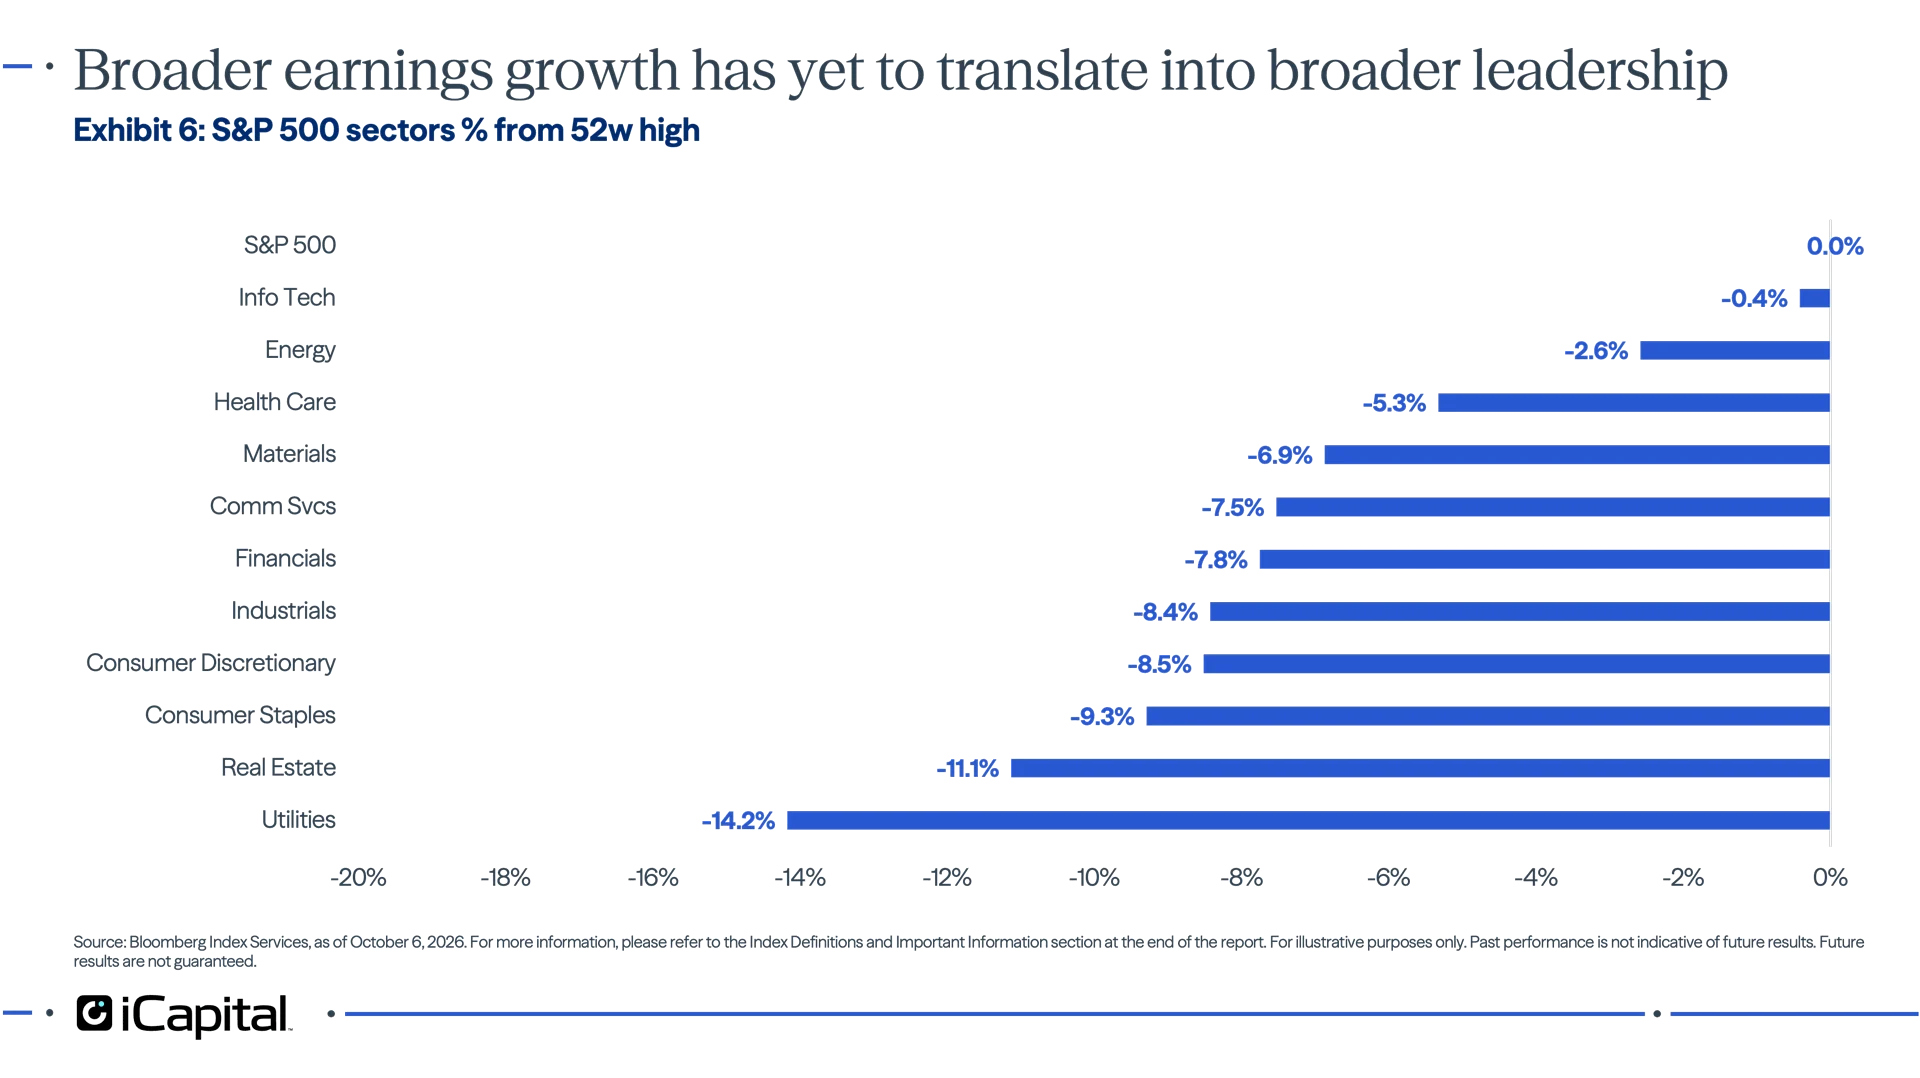 Higher interest rates and tighter liquidity likely explain much of that weakness. But strong results and upgraded guidance from economically sensitive companies could broaden market leadership and lift beaten-down sectors, particularly if interest rates begin to moderate.
4. Will earnings beats still be rewarded?
Companies enter the season with a high bar. Strong reported growth, elevated expectations and substantial gains in the leading stocks have reduced the value of a routine earnings beat.
The market’s reaction may therefore depend less on whether a company exceeds quarterly estimates and more on how it does so. Revenue-led beats, resilient margins and higher forward guidance should carry more weight than tax benefits, investment gains or aggressive cost reductions.
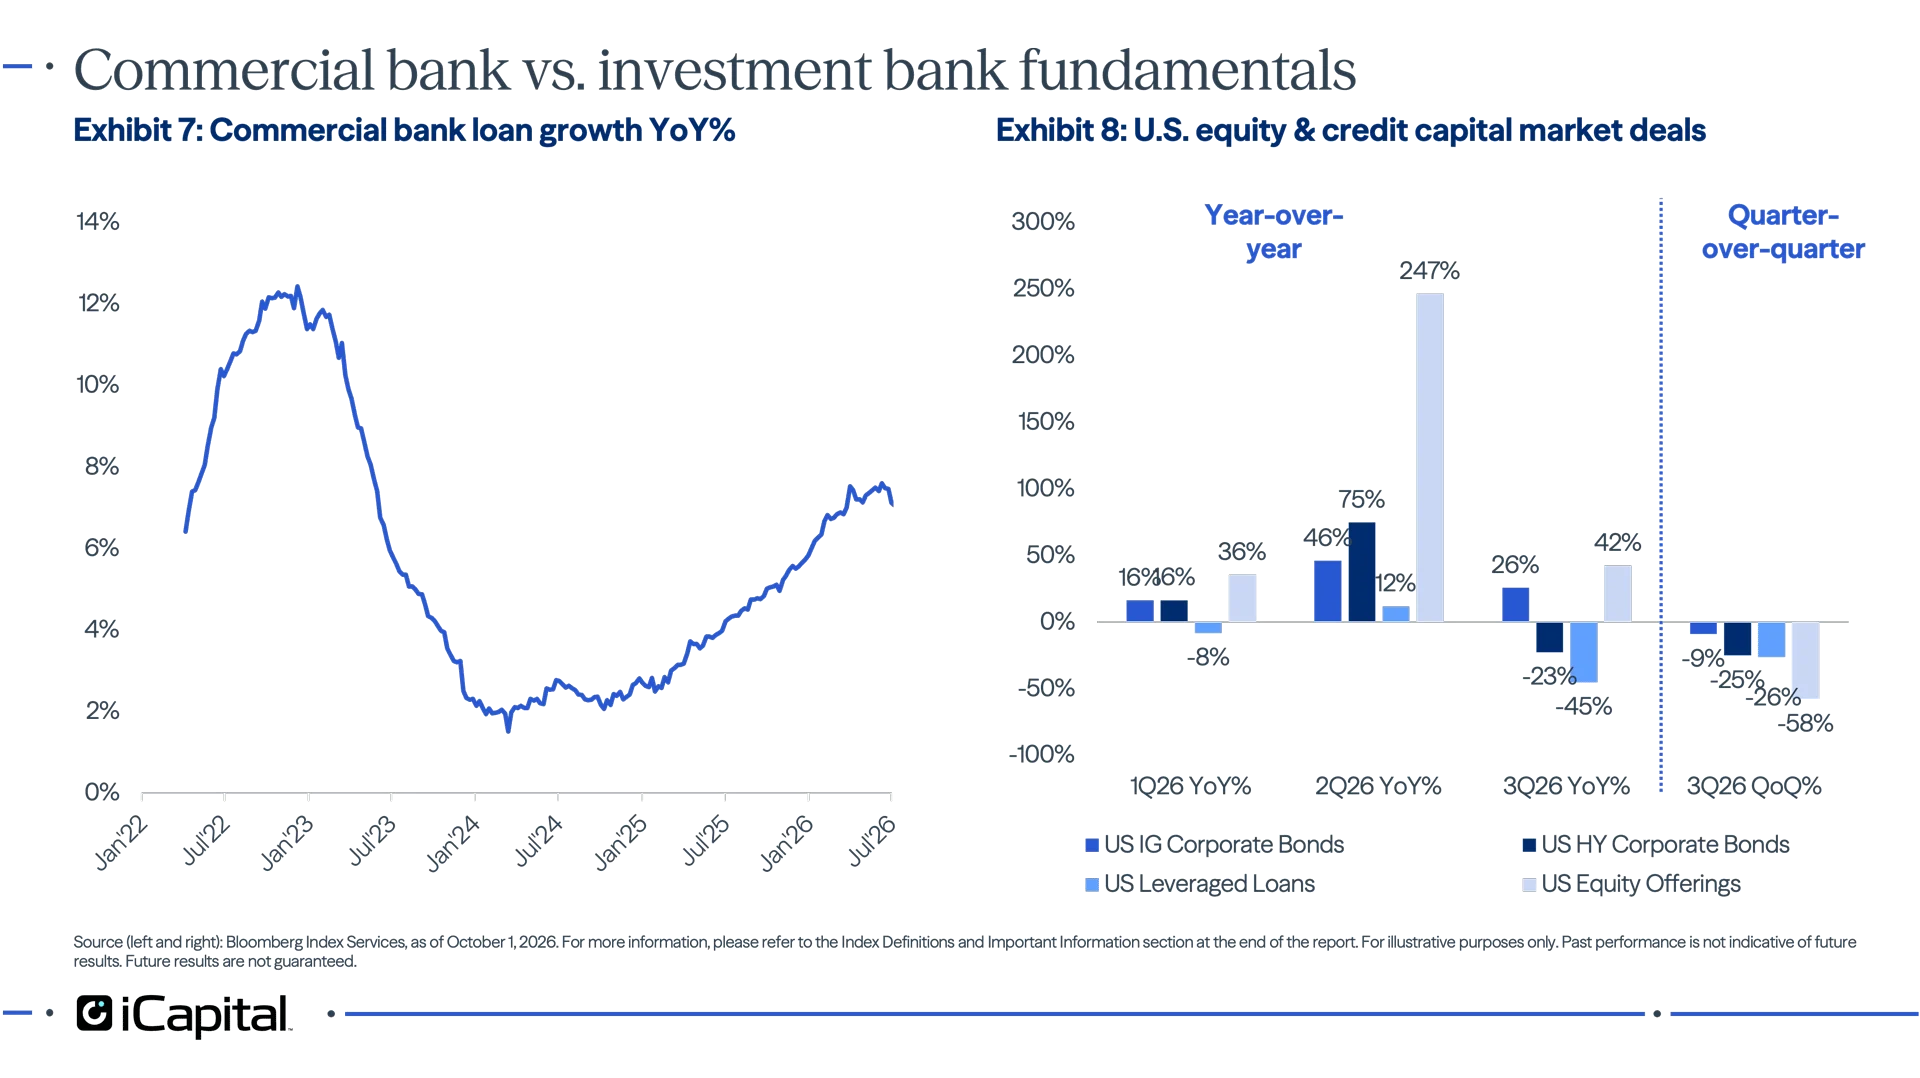
Financials offer a useful test. A favorable three-month/five-year yield-curve spread and high interest rates should support net interest income, while loan growth remains healthy even if it is slowing (Exhibit 7). Softer capital markets activity may offset some of that benefit (Exhibit 8). Bank results will help show whether domestic demand remains firm enough to broaden both earnings and market leadership.
 Bottom line: the market may demand healthy results beyond headline EPS
The third quarter may deliver another exceptional earnings result. But investors should be careful not to confuse a high growth rate with an improving growth outlook.
The strongest outcome would be evidence that growth is becoming cleaner, AI investment is becoming more productive, and market leadership is becoming broader. Without those developments, strong results may confirm that profits are peaking rather than providing the next leg of the rally.
- Bloomberg Index Services, as of October 1, 2026.
- Bloomberg Index Services, as of October 1, 2026.
INDEX DEFINITIONS
Hyperscaler Index: The Hyperscaler Index is defined as Meta Platforms, Oracle Corporation, Microsoft Corporation, Amazon.com Inc., and Alphabet Inc. Weightings as of October 1, 2025.
S&P 500 Index: The S&P 500 is widely regarded as the best single gauge of large-cap U.S. equities. The index includes 500 of the top companies in leading industries of the U.S. economy and covers approximately 80% of available market capitalization.
S&P 500 Consumer Discretionary Index: The S&P 500 Consumer Discretionary Index comprises those companies included in the S&P 500 that are classified as members of the GICS® Consumer Discretionary sector. The sector includes industries such as automobiles, consumer durables, apparel, hotels, restaurants, leisure, and broadline retail.
S&P 500 Consumer Staples Index: The S&P 500 Consumer Staples Index comprises those companies included in the S&P 500 that are classified as members of the GICS® Consumer Staples sector. The sector includes companies involved in food, beverage, household products, personal products, and retailing of staple consumer goods.
S&P 500 Energy Index: The S&P 500 Energy Index comprises those companies included in the S&P 500 that are classified as members of the GICS® Energy sector.
S&P 500 Financials Index: The S&P 500 Financials Index comprises those companies included in the S&P 500 that are classified as members of the GICS® Financials sector. The sector includes banks, insurance companies, capital markets firms, consumer finance companies, and diversified financial services firms.
S&P Banks Select Industry Index: The S&P Banks Select Industry Index comprises stocks in the S&P Total Market Index that are classified in the GICS Asset Management & Custody Banks, Diversified Banks, Regional Banks, Diversified Financial Services and Commercial & Residential Mortgage Finance sub-industries.
S&P 500 Health Care Index: The S&P 500 Health Care Index comprises those companies included in the S&P 500 that are classified as members of the GICS® Health Care sector. The sector includes pharmaceuticals, biotechnology, life sciences tools and services, health care equipment, supplies, providers, and services.
S&P 500 Industrials Index: The S&P 500 Industrials Index comprises those companies included in the S&P 500 that are classified as members of the GICS® Industrials sector. The sector includes aerospace and defense, machinery, transportation, professional services, and commercial services companies.
S&P 500 Information Technology Index: The S&P 500 Information Technology Index comprises those companies included in the S&P 500 that are classified as members of the GICS® Information Technology sector. The sector includes software, hardware, semiconductor, semiconductor equipment, IT services, and electronic equipment companies.
S&P 500 Materials Index: The S&P 500 Materials Index comprises those companies included in the S&P 500 that are classified as members of the GICS® Materials sector. The sector includes chemicals, construction materials, containers and packaging, metals and mining, and paper and forest products companies.
S&P 500 Real Estate Index: The S&P 500 Real Estate Index comprises those companies included in the S&P 500 that are classified as members of the GICS® Real Estate sector. The sector includes equity real estate investment trusts (REITs) and real estate management and development companies.
S&P 500 Communication Services Index: The S&P 500 Communication Services Index comprises those companies included in the S&P 500 that are classified as members of the GICS® Communication Services sector. The sector includes telecommunications services, media, entertainment, and interactive media and services companies.
The S&P 500 Semiconductors & Semiconductor Equipment (Industry Group) 35% Capped Index: measures the performance of the constituents of the S&P 500 Semiconductors & Semiconductor Equipment (Industry Group), subject to a 35% company weight cap.
S&P 500 Utilities Index: The S&P 500 Utilities Index comprises those companies included in the S&P 500 that are classified as members of the GICS® Utilities sector. The sector includes electric, gas, water, and multi-utility companies, as well as independent power producers and energy traders.
IMPORTANT INFORMATION
The material herein has been provided to you for informational purposes only by Institutional Capital Network, Inc. ("iCapital Network") or one of its affiliates (iCapital Network together with its affiliates, "iCapital"). This material is the property of iCapital and may not be shared without the written permission of iCapital. No part of this material may be reproduced in any form, or referred to in any other publication, without express written permission of iCapital.
This material is provided for informational purposes only and is not intended as, and may not be relied on in any manner as, legal, tax or investment advice, a recommendation, or as an offer or solicitation to buy or sell any security, financial product or instrument, or otherwise to participate in any particular trading strategy. This material does not intend to address the financial objectives, situation, or specific needs of any individual investor. You should consult your personal accounting, tax and legal advisors to understand the implications of any investment specific to your personal financial situation.
iCapital Markets LLC operates a platform that makes available financial products to financial professionals. In operating this platform, iCapital Markets LLC generally earns revenue based on the volume of transactions that take place in these products and would benefit by an increase in sales for these products.
The information contained herein is an opinion only, as of the date indicated, and should not be relied upon as the only important information available. Any prediction, projection or forecast on the economy, stock market, bond market or the economic trends of the markets is not necessarily indicative of the future or likely performance. The information contained herein is subject to change, incomplete, and may include information and/or data obtained from third party sources that iCapital believes, but does not guarantee, to be accurate. iCapital considers this third-party data reliable, but does not represent that it is accurate, complete and/or up to date. iCapital makes no representation as to the accuracy or completeness of this material and accepts no liability for losses arising from the use of the material presented. No representation or warranty is made by iCapital as to the reasonableness or completeness of such forward-looking statements or to any other financial information contained herein.
Securities products and services are offered by iCapital Markets LLC, an SEC-registered broker-dealer, member FINRA and SIPC, and an affiliate of iCapital, Inc. and Institutional Capital Network, Inc. These registrations and memberships in no way imply that the SEC, FINRA, or SIPC have endorsed any of the entities, products, or services discussed herein. Annuities and insurance services are provided by iCapital Annuities and Insurance Services LLC, an affiliate of iCapital, Inc. "iCapital" and "iCapital Network" are registered trademarks of Institutional Capital Network, Inc. Additional information is available upon request.
© 2026 Institutional Capital Network, Inc. All Rights Reserved.