One could argue—and we would agree—that lately the most important market price action has been in rates. The 10-year U.S. Treasury yield reached nearly 3% overnight before sharply reversing course and falling to 2.86%.1 Still, the yield is 52 bps higher than it was at the start of April and, unsurprisingly, the S&P 500 is down 3.66% and the tech-heavy Nasdaq down 5.7% over the same period.2
In the near term, we could see a quieter period for yields with central bank decisions now behind us (the European Central Bank met last week) or still a few weeks away (the U.S. Federal Reserve [Fed] will meet on May 4). This could be a reprieve for equities, which can refocus on earnings that are exceeding expectations and economic data that remains reasonably strong.
Longer-term investors have to nevertheless acknowledge that the rise in rates is becoming a big deal—it is starting to fundamentally impact how consumers spend and borrow (a theme we explored in last week’s commentary) and how investors view the relative value of equities versus fixed income. In this week’s commentary we look at why there is (finally) a viable fixed income alternative to stocks.
Fixed income yields showing signs of life
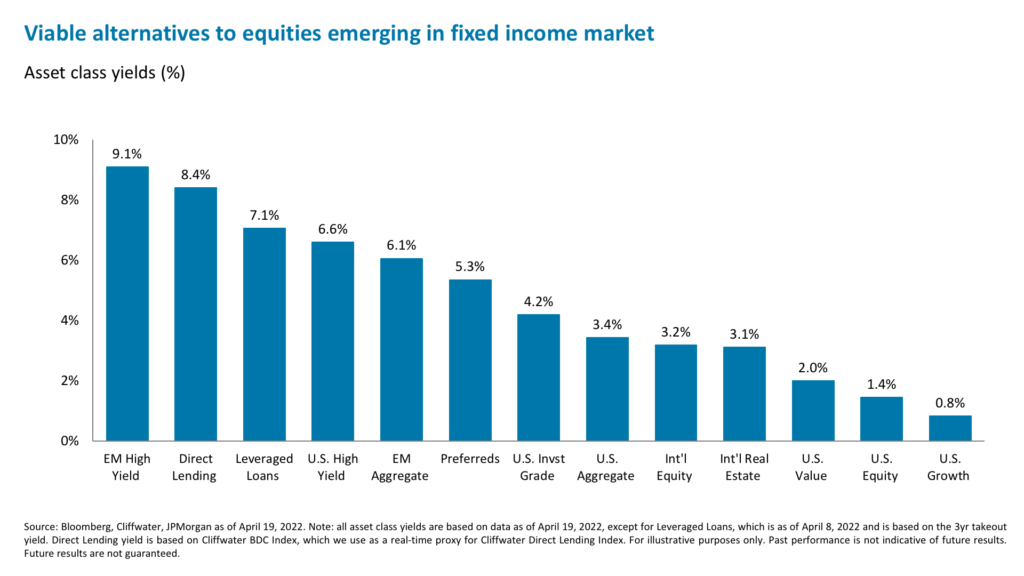
With the 10-year U.S. Treasury yield pushing towards 3% and the dividend yield on the S&P 500 at 1.4%, the gap between the two now exceeds its 22-year average of 1.3%.3 The earnings yield minus the 10-year U.S. Treasury yield is also below the 20-year average.4 This reduces the perceived attractiveness of equities. But more significantly, in an environment where the economic outlook is uncertain and equity returns have been lackluster, earning yield is an attractive option while waiting for improved conditions. To start the year, yields across the fixed income universe were not inspiring, but they are starting to impress now.
For example, the yield-to-worst on U.S. high yield bonds is now 6.6%, up from 4.1% at the beginning of the year.5 Default rates are expected to remain subdued at 0.75% in 2022 and rise only modestly to 1.25% in 2023.6 And the average coupon for high yield bonds is 5.7%.7 Of course, that is a fixed rate and exposes investors to duration risk. For example, the high yield bond price has fallen $8.95 year-to-date to $94.62, as rates have risen and credit spreads have widened.8
However, leveraged loan prices are down only $0.86 year-to-date and the average price is $97.55, while the yields on floating rate leveraged loans have also risen markedly this year.9 The yield to three-year takeout is now 7.06%, up from roughly 5% at the start of the year, and the average coupon is projected to rise from 4.3% to 6% by the end of the year, assuming the Fed delivers the rate hikes the markets have priced in.10 Floating rate securities are unsurprisingly attracting record inflows, with the U.S. leveraged loan index up 0.45% this year on a total return basis, outperforming most other fixed income sectors and many equities.11
For investors facing equity returns potentially capped by hawkish central banks and weakening economic data, earning this higher yield, especially in floating rate structures (which could almost offset U.S. inflation running at 8.5%12), may be an attractive alternative. These bonds and loans are clearly not immune from an economic slowdown or recession and could see their credit spreads widen and prices fall in the event of a risk-off market tilt. However, given their higher place in the capital structure than equities, robust income streams, and an average default recovery rate of 76% for first-lien term loans13, they may serve a useful role in de-risking equity betas. While recession is not imminent and a lot of Fed hawkishness has already been priced in, investors may receive coupon-like returns from here (approaching 6%) in high yield and leveraged loans, assuming credit spreads remain around current levels. This is attractive when you consider that, based on $235 next-12-month earnings per share for the S&P 500 and a 20x multiple14, the fair value of the market is 4,700, just 5% higher than at present.
Private credit may be an attractive alternative source of yield
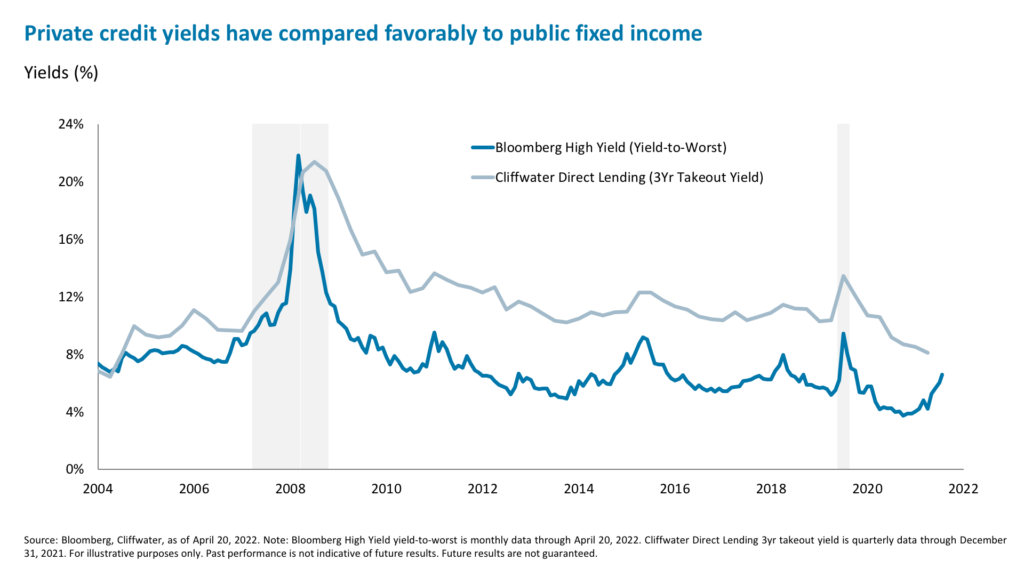
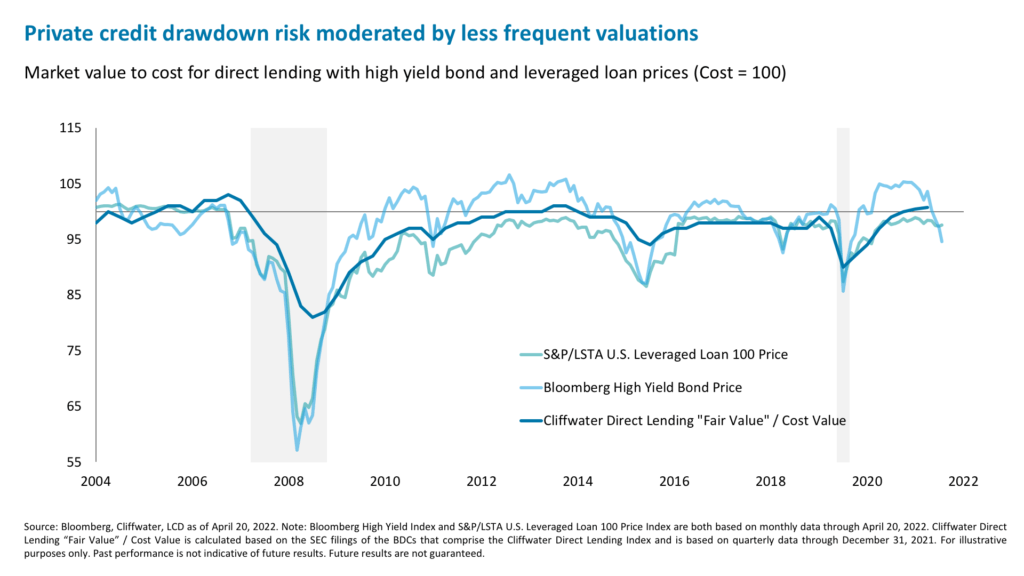
Finally, there is an alternative that may be less liquid but is potentially less volatile: private credit. These instruments have historically outperformed high yield bonds in risk-adjusted terms in times of rising rates and/or wider spreads.15 This is partly due to floating rate structures and the higher yields available in private credit.16 The latest yield on the Cliffwater BDC Index—a real-time proxy for the Cliffwater Direct Lending Index—is a robust 8.47%.17 Private credit has also showed less drawdown risk than both leveraged loans and high yield.18 This is likely due to less frequent valuations in private markets, versus the daily fluctuations and technical dislocations commonplace in public markets. Loans within private credit funds are also typically marked-to-market on a monthly or quarterly basis based on the underlying structure.
While historical default rates have tracked those in the high yield market, defaults could potentially remain lower than during prior downturns as direct lending portfolio composition has shifted towards senior secured lending rather than subordinated and mezzanine loans: Senior secured lending now accounts for 75% of portfolios, up from 38% in 2009, with subordinated loans only representing approximately 10% of the total versus 30-35% in 2009.19
As we discussed last week, the bottom line remains that the economic slowdown is likely to cap the extent to which stocks can rally this year, while the risks are not fully priced in. In this environment, it makes sense for investors to get paid while awaiting greater clarity and de-risk their portfolios. Indeed, recent trading data suggests that both individual and non-retail investors have increasing purchases of fixed income assets.20 I suspect there is more to come as yields rise and we would selectively take advantage of fixed income opportunities like those in high yield and leveraged loans, and private credit.
1. Bloomberg, as of April 20, 2022.
2. Bloomberg, as of April 20, 2022.
3. Bloomberg, iCapital, as of April 20, 2022.
4. Bloomberg, iCapital, as of April 20, 2022.
5. Bloomberg, as of April 20, 2022.
6. JPMorgan Default Monitor, as of December 2021.
7. Bloomberg, iCapital, as of April 20, 2022.
8. Bloomberg, iCapital, as of April 20, 2022.
9. Bloomberg, iCapital, as of April 20, 2022.
10. JPMorgan Credit Strategy, as of April 8, 2022.
11. JPMorgan Credit Strategy, as of April 8, 2022.
12. Bloomberg, as of April 20, 2022.
13. Fitch Ratings, U.S. Leveraged Finance Restructuring Series, as of March 21, 2022.
14. FactSet Earnings Insights, as of April 15, 2022.
15. Bloomberg, Cliffwater, Goldman Sachs Research as of November 17, 2021.
16. Bloomberg, iCapital, as of April 19, 2022.
17. Cliffwater, as of April 19, 2022.
18. Bloomberg, Cliffwater, LCD, as of April 19, 2022.
19. Cliffwater, as of April 19, 2022.
20. JPMorgan Retail Radar, as of April 6, 2022 and April 13, 2022.
IMPORTANT INFORMATION
The material herein has been provided to you for informational purposes only by iCapital, Inc. (“iCapital”). This material is the property of iCapital and may not be shared without the written permission of iCapital. No part of this material may be reproduced in any form, or referred to in any other publication, without express written permission of iCapital.
This material is provided for informational purposes only and is not intended as, and may not be relied on in any manner as, legal, tax or investment advice, a recommendation, or as an offer to sell, a solicitation of an offer to purchase or a recommendation of any interest in any fund or security. You should consult your personal accounting, tax and legal advisors to understand the implications of any investment specific to your personal financial situation. This material does not intend to address the financial objectives, situation or specific needs of any individual investor. Alternative investments are complex, speculative investment vehicles and are not suitable for all investors.
The information contained herein is an opinion only, as of the date indicated, and should not be relied upon as the only important information available. Any prediction, projection or forecast on the economy, stock market, bond market or the economic trends of the markets is not necessarily indicative of the future or likely performance. The information contained herein is subject to change, incomplete, and may include information and/or data obtained from third party sources that iCapital believes, but does not guarantee, to be accurate. iCapital considers this third-party data reliable, but does not represent that it is accurate, complete and/or up to date, and it should not be relied on as such. iCapital makes no representation as to the accuracy or completeness of this material and accepts no liability for losses arising from the use of the material presented. No representation or warranty is made by iCapital as to the reasonableness or completeness of such forward-looking statements or to any other financial information contained herein.
Securities products and services are offered by iCapital Markets, an SEC-registered broker-dealer, member FINRA and SIPC, and an affiliate of iCapital, Inc. and Institutional Capital Network, Inc. These registrations and memberships in no way imply that the SEC, FINRA, or SIPC have endorsed any of the entities, products, or services discussed herein. Annuities and insurance services are provided by iCapital Annuities and Insurance Services LLC, an affiliate of iCapital, Inc. “iCapital” and “iCapital Network” are registered trademarks of Institutional Capital Network, Inc. Additional information is available upon request.
© 2023 Institutional Capital Network, Inc. All Rights Reserved.


