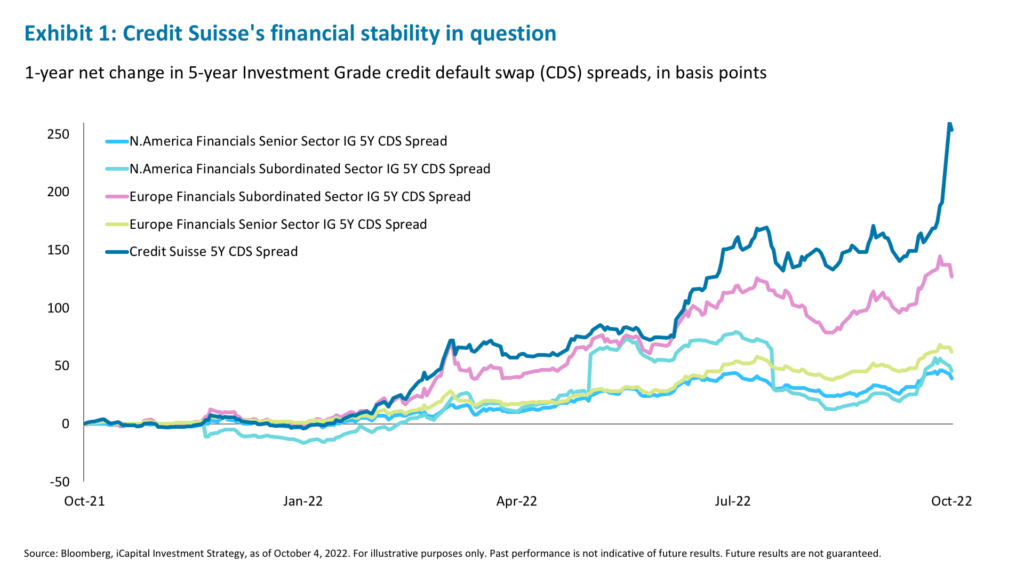
Risk assets are off to a strong start in October. Although our view on the relative attractiveness (or the lack thereof) of equities has not changed, a rally on oversold conditions was expected. Still, a terrible September could mean a better setup for October. After the many resets in September – lower multiples, oversold momentum indicators, only 2% of S&P 500 stocks producing positive returns for the month, and a spike in volatility – we see some additional upside from here given an easier event calendar.1 There is no U.S. Federal Reserve (Fed) meeting until November and earnings expectations were already reset for the third quarter, with estimates cut 6.3%, against a five-year average of 2.3% declines.2 Finally, Fed officials may be starting to worry about doing too much, too quickly as financial conditions have tightened materially and questions are starting to surface over financial stability.3 Indeed, banks are in the spotlight this week given questions about Credit Suisse’s financial position (See Exhibit 1).
We have previously seen value in banks, but in this week’s commentary we highlight a risk that might lie ahead for them – the labor market. While currently very strong, it has lots of room to weaken and we suspect it will. This risk could lead to potentially wider credit spreads for banks and higher volatility, but herein lies an opportunity for investors amid the market dislocation.
The strength of jobs versus the weakness of the economy
The September reading on the new orders component of the Institute for Supply Management’s manufacturing index slipped back below 50, indicating a contraction.4 In the housing market, traffic of prospective buyers has fallen meaningfully to a reading of 31, down from 71 at the start the year.5 Construction spending slipped 0.7% month-over-month in August, more than consensus.6 And finally, the number of job openings (JOLTs) fell as sharply as they have since April 2020.7
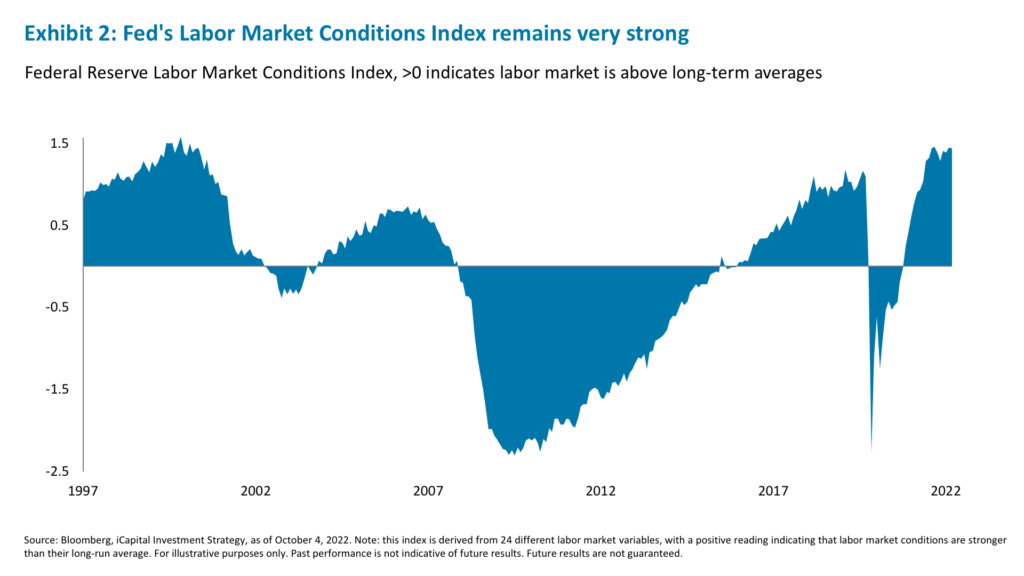
As pronounced as this change was, the overall labor market remains strong, implying lots of room to weaken. For example, the Fed’s own labor market conditions index is in the 99th percentile going back to 1991 (See Exhibit 2).8 Since late July, initial jobless claims have come down and currently average 207,000 per week (over the prior 4 weeks) compared to a long-run average of 379,400 per week.9 Furthermore, the employment diffusion “breadth” index still shows that most industries continue to add jobs.10
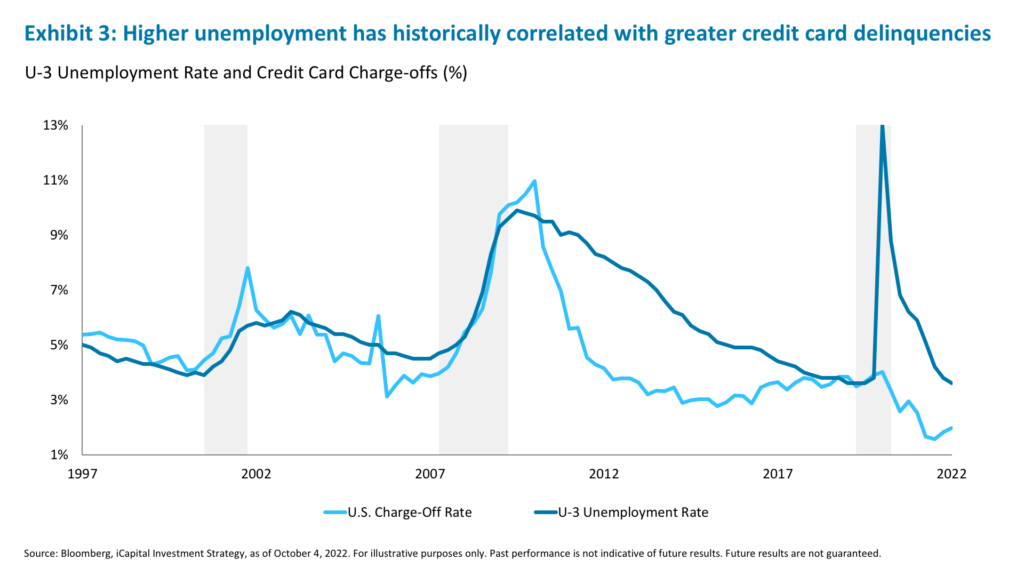
However, looking ahead, analysts and economists expect the labor market to soften.11 And how can it not, when the Fed has now almost explicitly declared that they aim to weaken the labor market to crack inflation, and when the future business bookings component of many industries is slowing.12 Consensus expectations are for the pace of job creation to step down from an average monthly addition of 381,000 over the last six months to 94,000 per month through the end of 2023.13 And the unemployment rate, currently at 3.7%, is expected to pick up to 4.4% by the end of next year.14 Historically, when unemployment rises so do credit card delinquency rates and charge-offs (See Exhibit 3).
That said, the expected rise in unemployment is not “recessionary” – the lowest level of unemployment at the start of any recession in the past 50 years has been 4.7%.15 Nevertheless, the uptick could have implications for the ability and willingness of consumers to service debt.16 In fact, we have already started to see signs of this: Discover Financial, which tends to service a younger cohort with lower disposable income, recently announced that its credit card delinquency rate rose to 1.96% in August, up from 1.84% in July and 1.42% a year ago.17
All eyes on consumer credit trends for banks amidst the slowdown
With banks set to kick off earnings season next week, all eyes should be on their credit metrics. So far, the credit quality of loan portfolios has not been an issue. The U.S. card issuer net charge-off rate has stayed exceptionally low, but there are some signs of increases in past-due credit card and auto loans payments.18 While still below pre-pandemic levels, the median credit card 30-89 day delinquency rate has risen from 0.8% in the second quarter of 2021 to 0.89% in the second quarter of 2022 for prime lenders and from 1.01% to 1.52% among non-prime lenders.19 There is a similar trend in auto loan delinquencies, but more so within the non-prime lender space: The median auto 30-89 day delinquency rate for prime lenders has risen 18 basis points since the second quarter of 2022 but is up 121 basis points for non-prime lenders.20
As the economy slows further and/or enters a recession as the labor market weakens, we would expect these metrics to deteriorate further. In a recessionary scenario, we would expect the cumulative loss rate for banks to rise roughly 115 basis points. The credit card loss rate would rise an estimated 272 basis points to 4.67%.21 Also, net charge-offs for large banks, which tend to be more insulated, could reach 1.2%, more than three times 2023 consensus estimates.22 Banks appear to be provisioning for that now, with some analysts estimating approximately 10% higher-than-expected provisions this earnings season.23
Overall, like the broader markets, banks have priced in roughly a 40%-60% probability of a recession, meaning they may face additional downside if that comes to pass.24
To be sure, we do not expect a moderate recession to imperil the financial stability of banks whose capital buffers are sufficient to withstand even the severely adverse scenario of the Fed’s latest stress test, which assumed a 3.5% decline in real GDP, a 28.5% decline in home prices, and a 55% decline in equity prices.25 And with the aggregate common equity capital ratio currently around 12% – roughly double that during the financial crisis – banks have sufficient capital to absorb more than $600 billion in potential losses.26
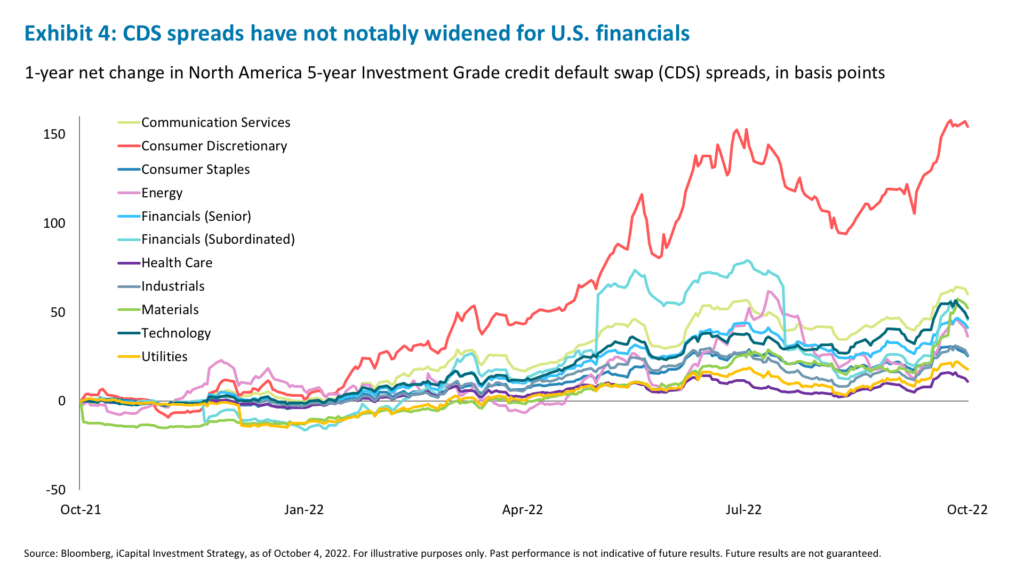
In this context, and with credit portfolios in solid shape, credit spread widening among U.S. banks has been modest.27 They have not widened in sympathy with Credit Suisse, for example, and their credit default swap (CDS) spreads have not widened as much as those of their European counterparts (See Exhibit 1).28 Over the last year, CDS spreads widened much more in the consumer discretionary sector than among financials, led by Staples and Carnival Corps (See Exhibit 4).29 However, should the labor market begin to weaken and loan credit quality worsen, we would expect U.S. bank CDS spreads to widen more. This, in combination with higher rates and higher volatility, could present a further opportunity for structured note investors.
Rates, volatility, and spreads spell opportunity for structured note investors
The recent tightening of financial conditions, including spikes in rates and volatility and wider credit spreads, while burdensome for the economy, should improve the pricing terms of structured notes. Higher rates have been a significant driver of better pricing, as the zero-coupon bonds that are the backbone of structured notes now pay a much more attractive coupon.30 For example, two-year swap rates moved from 0.95% at the start of the year to 3.59% by mid-June to 4.44% today.31
The higher coupon allows investors to spend more on the options used to structure a particular payoff. Additionally, for structured notes where call or put options on the underlying index are being sold the recent increase in volatility is very welcome. The S&P 500 12-month implied call volatility is in the 97th percentile over the last year or the 98th percentile over the last 10 years, making selling call options relatively attractive.32
Finally, wider CDS spreads on bank issuers may also create an investor advantage, should bank funding costs increase in line with their CDS. However, we note that the CDS level reflects market perception of a particular bank’s riskiness or creditworthiness and not necessarily what the bank’s own perception might be. So, there might not be a direct one-to-one pass-through of higher CDS to higher bank funding costs. Nevertheless, as the overall banking sector CDS spreads widen it should have a knock-on effect on funding costs.
These three factors combined have made for materially better structured note pricing today relative to January or June of this year. And while the market environment remains challenging and unprecedented, market moves like those in rates, volatility, and CDS spreads can be monetized via structured notes and present opportunities for investors amid market uncertainty and dislocation.
1. Bloomberg, as of October 4, 2022.
2. Factset, as of September 23, 2022.
3. Bloomberg, iCapital, as of October 4, 2022.
4. Bloomberg, iCapital, as of October 4, 2022. Note: ISM readings of under 50 indicate an economy is contracting.
5. Bloomberg, iCapital, as of October 4, 2022.
6. Bloomberg, iCapital, as of October 4, 2022.
7. Bloomberg, iCapital, as of October 4, 2022.
8. Federal Reserve Bank of Kansas, iCapital, as of October 4, 2022. The Fed’s index is derived from 24 different labor market variables, with a positive reading indicating that labor market conditions are stronger than their long-run average.
9. Bloomberg, iCapital, as of October 4, 2022.
10. Bloomberg, iCapital, as of October 4, 2022. Note: The Employment Diffusion Index is a breadth index based on nonfarm payrolls. It indicates the percent of industries with employment increasing where 50 percent indicates an equal balance between industries with increasing and decreasing employment.
11. Bloomberg, iCapital, as of October 4, 2022.
12. Bloomberg, iCapital, as of October 4, 2022.
13. Bloomberg, iCapital, as of October 4, 2022.
14. Bloomberg, iCapital, as of October 4, 2022.
15. Bloomberg, iCapital, as of October 4, 2022.
16. Bloomberg, iCapital, as of October 4, 2022.
17. Discover Financial Services SEC Filing, as of September 13, 2022.
18. JPMorgan, as of September 6, 2022.
19. JPMorgan, as of September 6, 2022.
20. JPMorgan, as of September 6, 2022.
21. Goldman Sachs, as of July 5, 2022.
22. Bloomberg, iCapital, Goldman Sachs, as of October 4, 2022.
23. Goldman Sachs, as of October 3, 2022.
24. Goldman Sachs, as of October 3, 2022.
25. Federal Reserve, 2022 Stress Test Scenarios, as of February 13, 2022.
26. Federal Reserve, 2022 Stress Test Results, as of June 27, 2022.
27. Bloomberg, iCapital, as of October 4, 2022.
28. Bloomberg, iCapital, as of October 4, 2022.
29. Bloomberg, iCapital, as of October 4, 2022.
30. Bloomberg, iCapital, as of October 4, 2022.
31. Bloomberg, iCapital, as of October 4, 2022.
32. Bloomberg, iCapital, as of October 4, 2022.
IMPORTANT INFORMATION
The material herein has been provided to you for informational purposes only by iCapital, Inc. (“iCapital”). This material is the property of iCapital and may not be shared without the written permission of iCapital. No part of this material may be reproduced in any form, or referred to in any other publication, without express written permission of iCapital.
This material is provided for informational purposes only and is not intended as, and may not be relied on in any manner as, legal, tax or investment advice, a recommendation, or as an offer to sell, a solicitation of an offer to purchase or a recommendation of any interest in any fund or security. You should consult your personal accounting, tax and legal advisors to understand the implications of any investment specific to your personal financial situation. This material does not intend to address the financial objectives, situation or specific needs of any individual investor. Alternative investments are complex, speculative investment vehicles and are not suitable for all investors.
The information contained herein is an opinion only, as of the date indicated, and should not be relied upon as the only important information available. Any prediction, projection or forecast on the economy, stock market, bond market or the economic trends of the markets is not necessarily indicative of the future or likely performance. The information contained herein is subject to change, incomplete, and may include information and/or data obtained from third party sources that iCapital believes, but does not guarantee, to be accurate. iCapital considers this third-party data reliable, but does not represent that it is accurate, complete and/or up to date, and it should not be relied on as such. iCapital makes no representation as to the accuracy or completeness of this material and accepts no liability for losses arising from the use of the material presented. No representation or warranty is made by iCapital as to the reasonableness or completeness of such forward-looking statements or to any other financial information contained herein.
Securities products and services are offered by iCapital Markets, an SEC-registered broker-dealer, member FINRA and SIPC, and an affiliate of iCapital, Inc. and Institutional Capital Network, Inc. These registrations and memberships in no way imply that the SEC, FINRA, or SIPC have endorsed any of the entities, products, or services discussed herein. Annuities and insurance services are provided by iCapital Annuities and Insurance Services LLC, an affiliate of iCapital, Inc. “iCapital” and “iCapital Network” are registered trademarks of Institutional Capital Network, Inc. Additional information is available upon request.
© 2023 Institutional Capital Network, Inc. All Rights Reserved.


