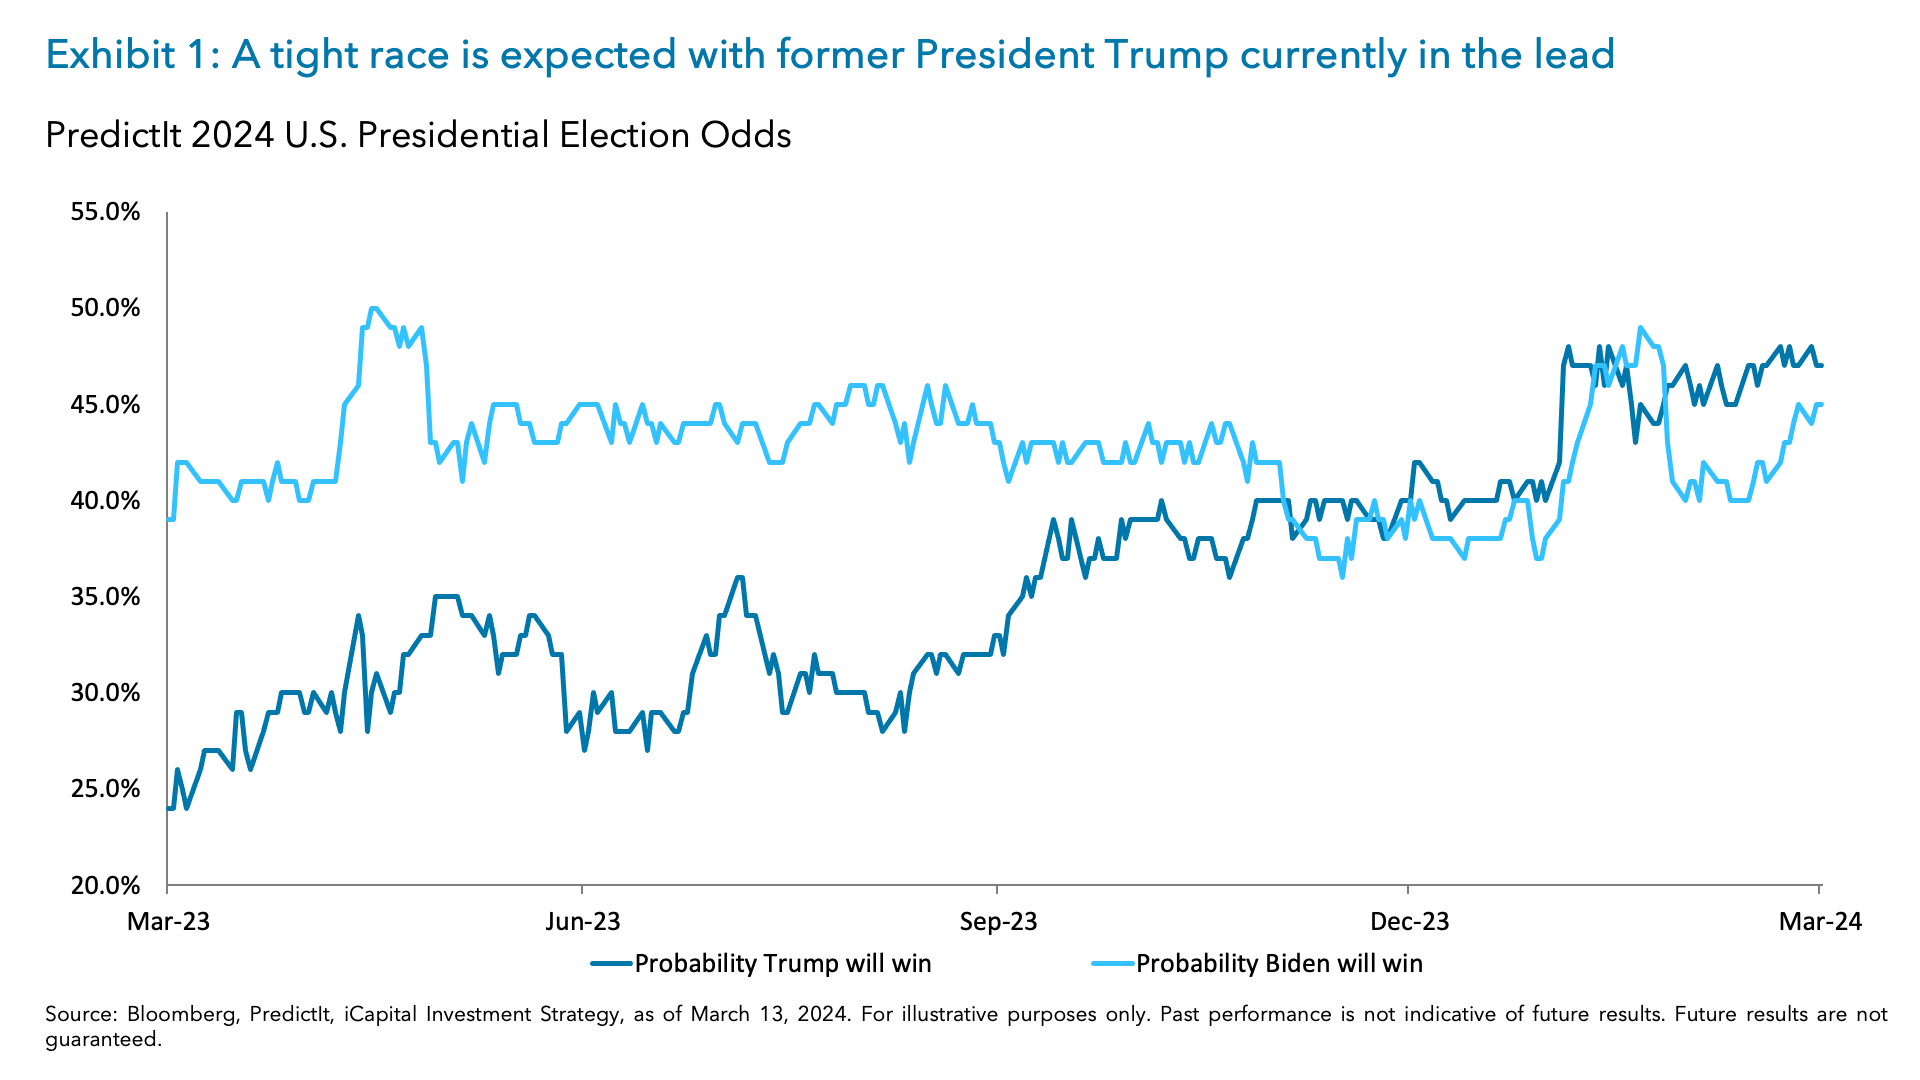
President Joe Biden and former President Donald Trump dominated their respective Super Tuesday races on March 5, securing enough delegates to win their parties’ presidential nomination and setting up the first rematch since the 1956 election. This result had largely been expected by the markets, particularly as PredictIt odds on the morning of Super Tuesday indicated a 92% likelihood of Trump securing the Republican nomination and a 77% likelihood of President Joe Biden retaining the Democratic nomination. Indeed, the subdued market reaction to this event also underscored the widely expected nature of this outcome. As we approach the November elections, PredictIt odds now show former President Trump having a slight advantage, with a 47% probability of winning compared to President Biden’s 45%.1
While it may still be premature for markets to worry about the presidential election, scheduled for November 5, we note that U.S. equities are starting to price in potential election outcomes.
In this week’s commentary we focus on three key areas: 1) taking stock of sectors that are or likely will be showing election-related divergences, 2) noting how volatility spikes associated with the election tend to be short-lived and occur much closer to the election, and 3) focusing on how fundamentals and the renewed “economic enthusiasm” should support overall equity returns regardless of the election outcome.
Certain Sectors May Be Starting to Price in Potential Election Outcomes
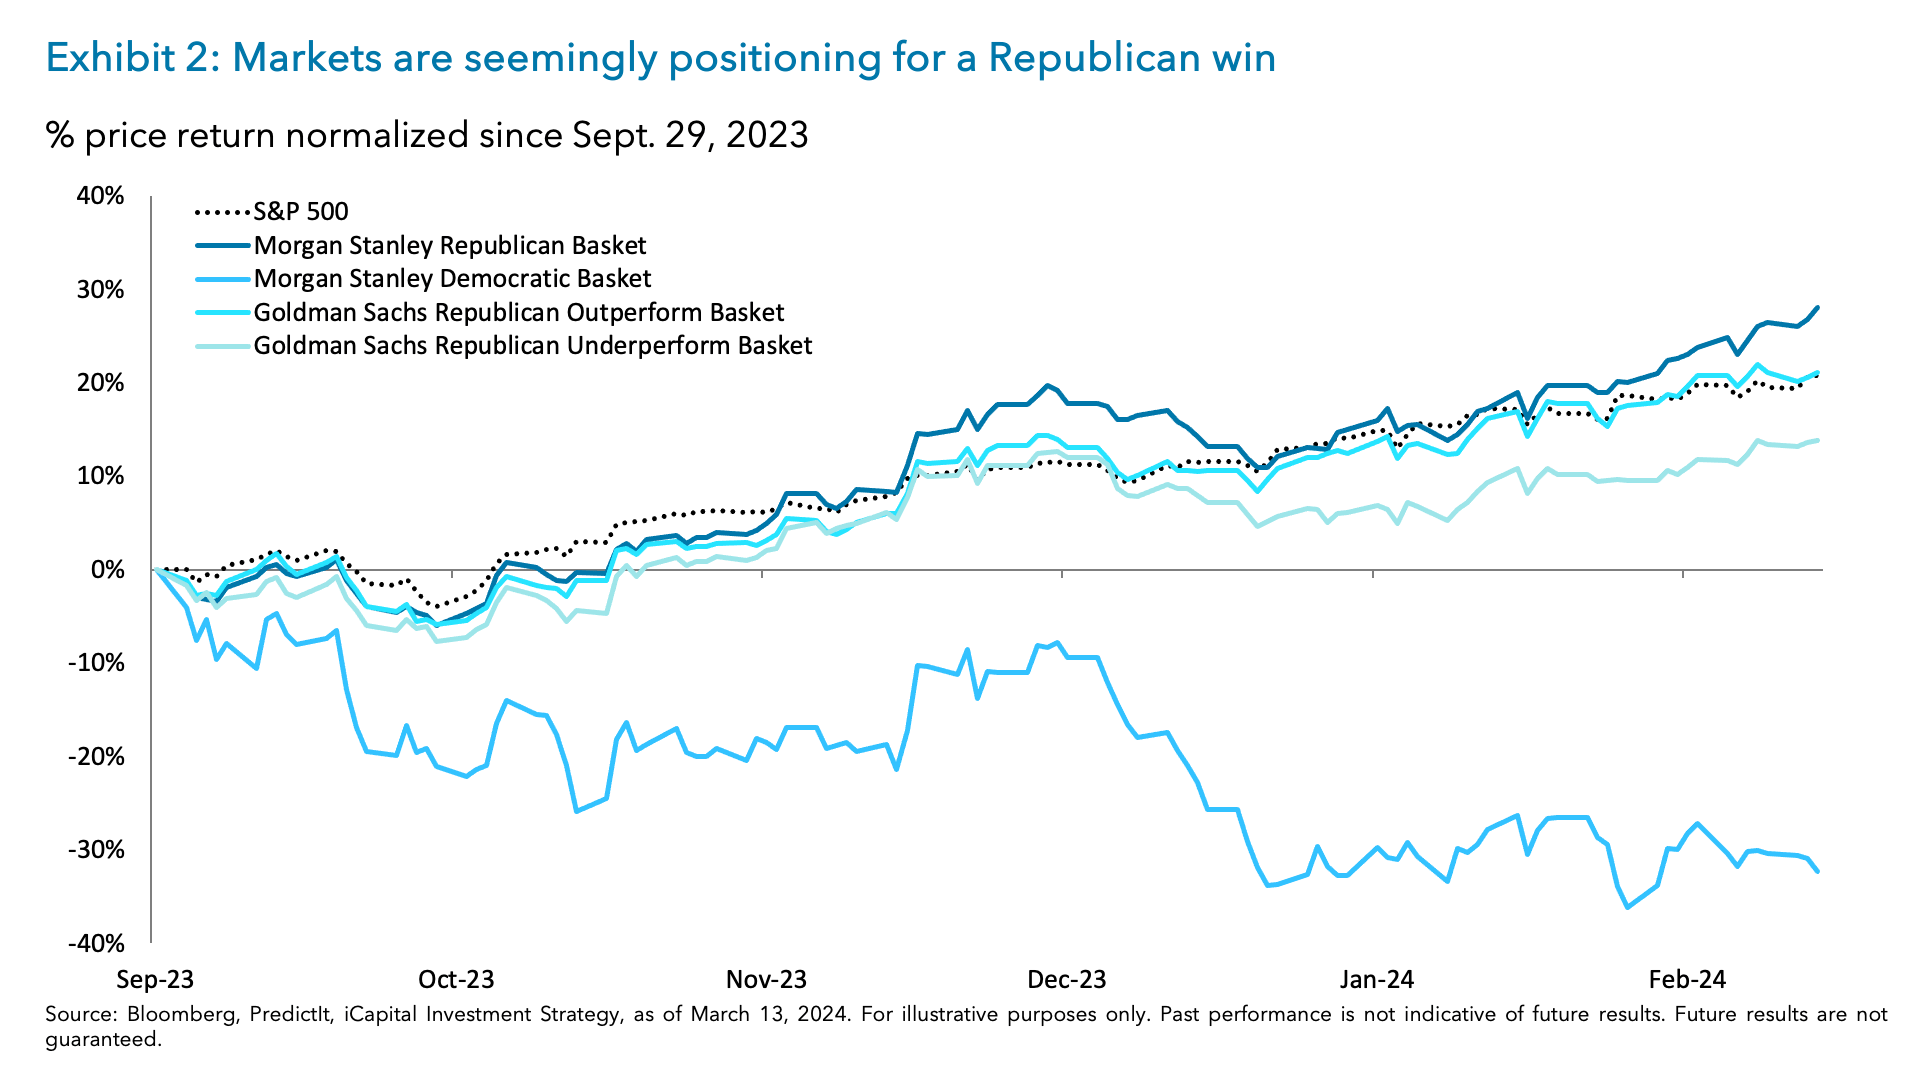
With eight months remaining until the U.S. presidential election, we believe it’s early for markets to reflect potential outcomes. However, when examining the performance of certain policy baskets, it appears that markets are starting to price in a Republican victory.
Indeed, since the end of September 2023, the Morgan Stanley Republican basket is up 22.4%, which has not only outperformed the Morgan Stanley Democrat basket, lower by 30%, but has also outperformed the 18.4% gain for the S&P 500 (Exhibit 2).2 The outperformance of the Republican basket has coincided with a 10 percentage point (ppt) jump in the former President’s PredictIt election odds, while President Biden’s odds have only increased by 3 ppt.3 In addition, we also think that the Republican basket has benefitted from Trump having a lead in virtually every swing state. Indeed, when you look at Real Clear Politics key battleground states, the former President holds an average 4% lead in these key states.4 The only battleground state where Trump does not currently hold a lead is Pennsylvania, where President Biden is only leading by 0.8%.5
We also think that concentration risk could be at play for the two baskets. When examining the Republican basket, it comprises of 59 stocks with the top five names making up 24% of the basket, compared to the Democratic basket only having 22 stocks and the top five names making up roughly 44% of the basket.6 The Democratic basket is also heavily skewed toward electric vehicles (EVs) and clean energy names, which have not performed well to start the year, with both down 2% and 8% year-to-date (YTD), respectively.7 Conversely, the Republican basket is much more exposed to banks, metals & mining and oil & gas companies – where banks and oil & gas companies have outperformed or performed in line with the S&P 500 so far this year.8
Similar to the outperformance of the Morgan Stanley Republican basket, the Goldman Sachs Republican basket has also outperformed the S&P 500 since September 2023. Indeed, the Goldman Sachs Republican basket is up 21.4% which compares to the 20.3% gain for the S&P 500. Even on a YTD basis, the Goldman Sachs Republican basket has performed in-line with the S&P 500. The outperformance of the Goldman Sachs Republican basket has been more pronounced when you compare it to their Republican underperform basket. Indeed, since September 2023 the underperform basket has lagged by seven ppt. This underperformance has continued into 2024 as it has lagged by five ppt on a YTD basis. Similar to the composition of the Morgan Stanley basket, the Goldman Sachs Republican basket has a cyclical bias and should benefit from financial deregulation, onshoring, construction, energy, coal and steel production, in addition to companies that have their sales coming from small businesses.
We think these baskets will be important to watch as they will eventually provide more insights into what outcome financial markets will price in. For example, in looking back at the 2016 election the Goldman Sachs Republican basket was up 14% from Jan. 1, 2016 through the November 2016 election. This outperformed the S&P 500 by 6.6 ppt.9 Conversely, heading into the 2020 election the Republican basket underperformed the S&P 500 by roughly 11 ppt, indicating that markets were pricing in a Biden victory.10
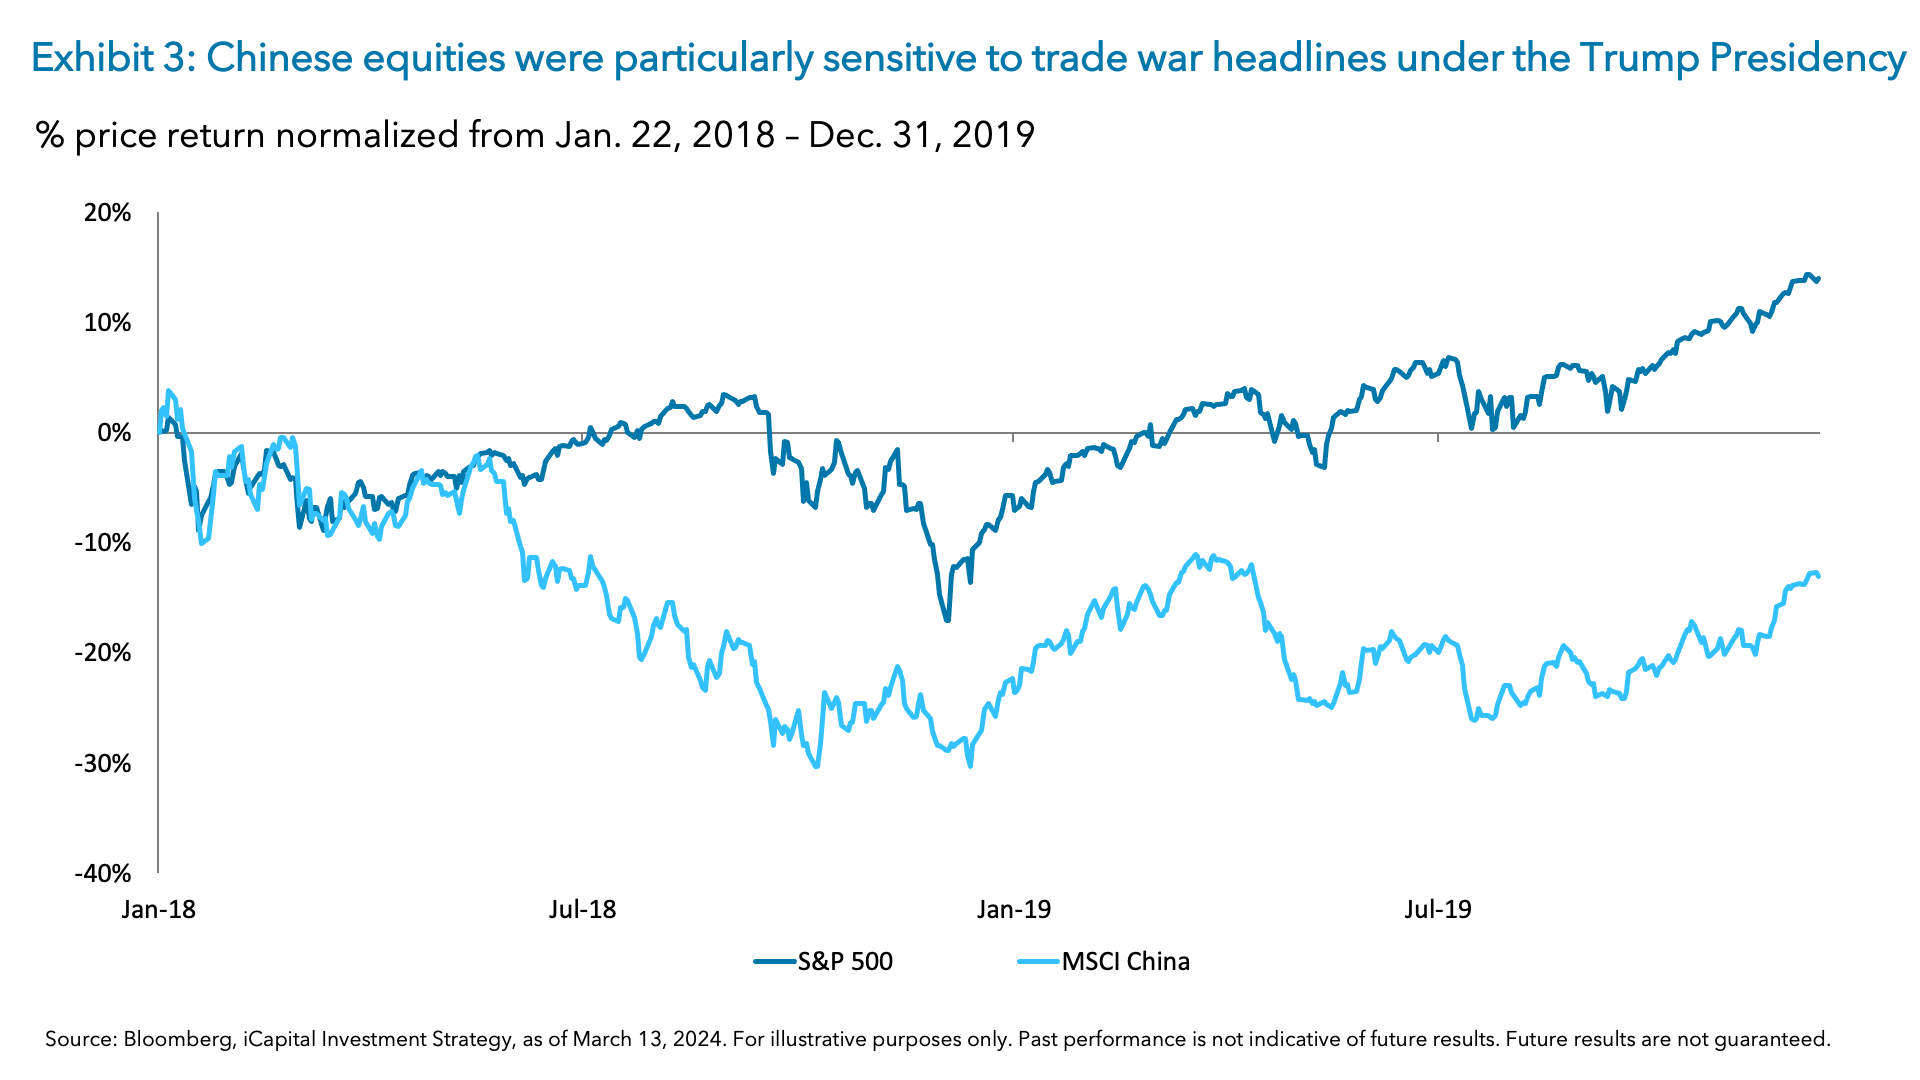
Looking abroad, we also believe that certain international financial markets could be impacted by how polling data and election odds evolve throughout the year, specifically China. Even though Chinese equities have recouped their YTD losses, benefitting from policy easing announcements, Chinese equities were particularly sensitive to trade rhetoric when former President Trump was in office. Indeed, when former President Trump first started mentioning the potential for tariffs, Chinese equities were almost 9% lower, significantly lagging the 18.5% gain for the S&P 500 from January 2018 through December 2019 (Exhibit 3).11 Given former President Trump continues to tout the potential for further tariffs, we think Chinese equities could become increasingly more sensitive to such announcements.
Spikes In Volatility Will Likely Take Place Closer to The Election
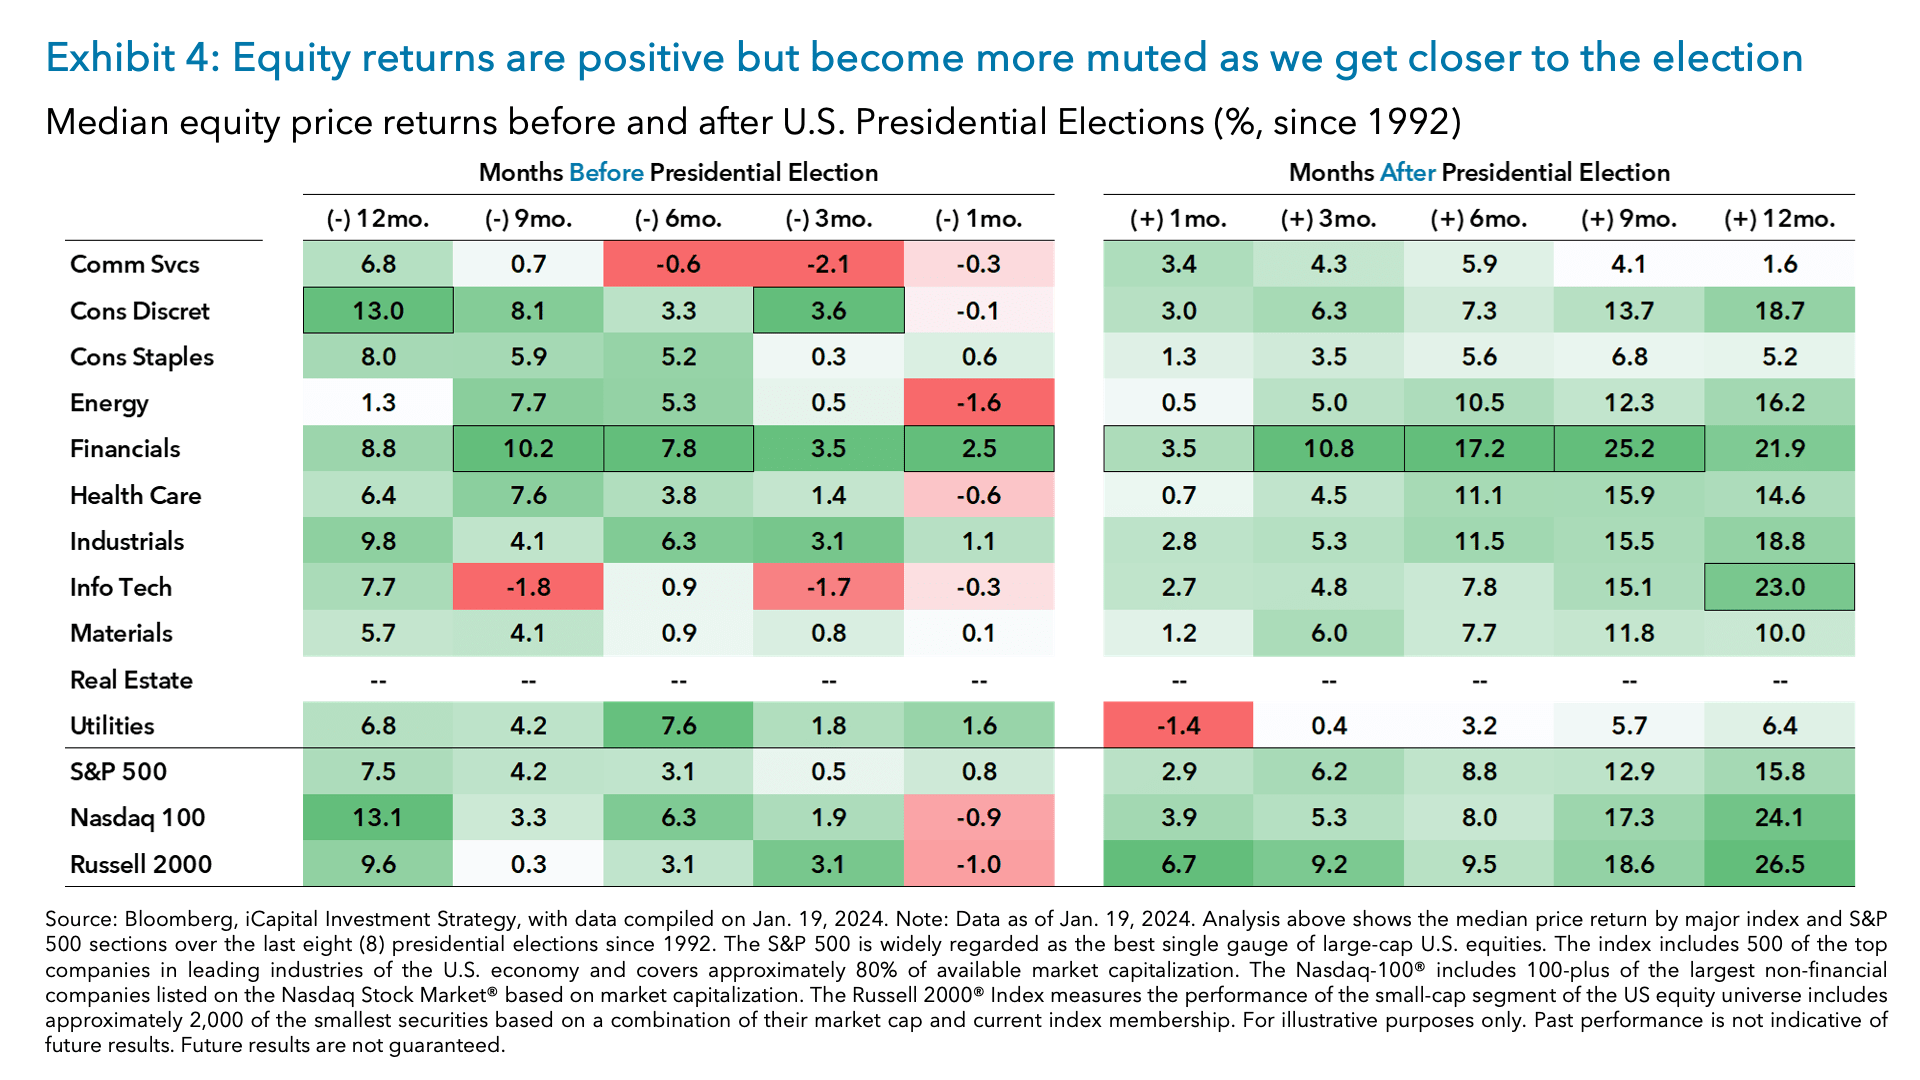
Another reason why we believe it’s too early for markets to focus on the election is because historically the S&P 500 starts to price in election outcomes in the August to October timeframe, or about one to three months out. Indeed, based on our research we see that markets tend to experience more volatility in the months before an election (Exhibit 4).12 This view is also supported by the current term structure of the CBOE Volatility Index (VIX), where the October contract is trading much higher than the rest of the contracts – indicating that markets are starting to assign some event risk to the election.13
Markets Broadly Are Benefitting from the “Economic Enthusiasm”
Even with the increase of the former President’s election odds and polling data, we think the Republican baskets have also been benefitting from the “economic enthusiasm” given the pro-cyclical composition of the basket in financials, industrial, materials and energy.
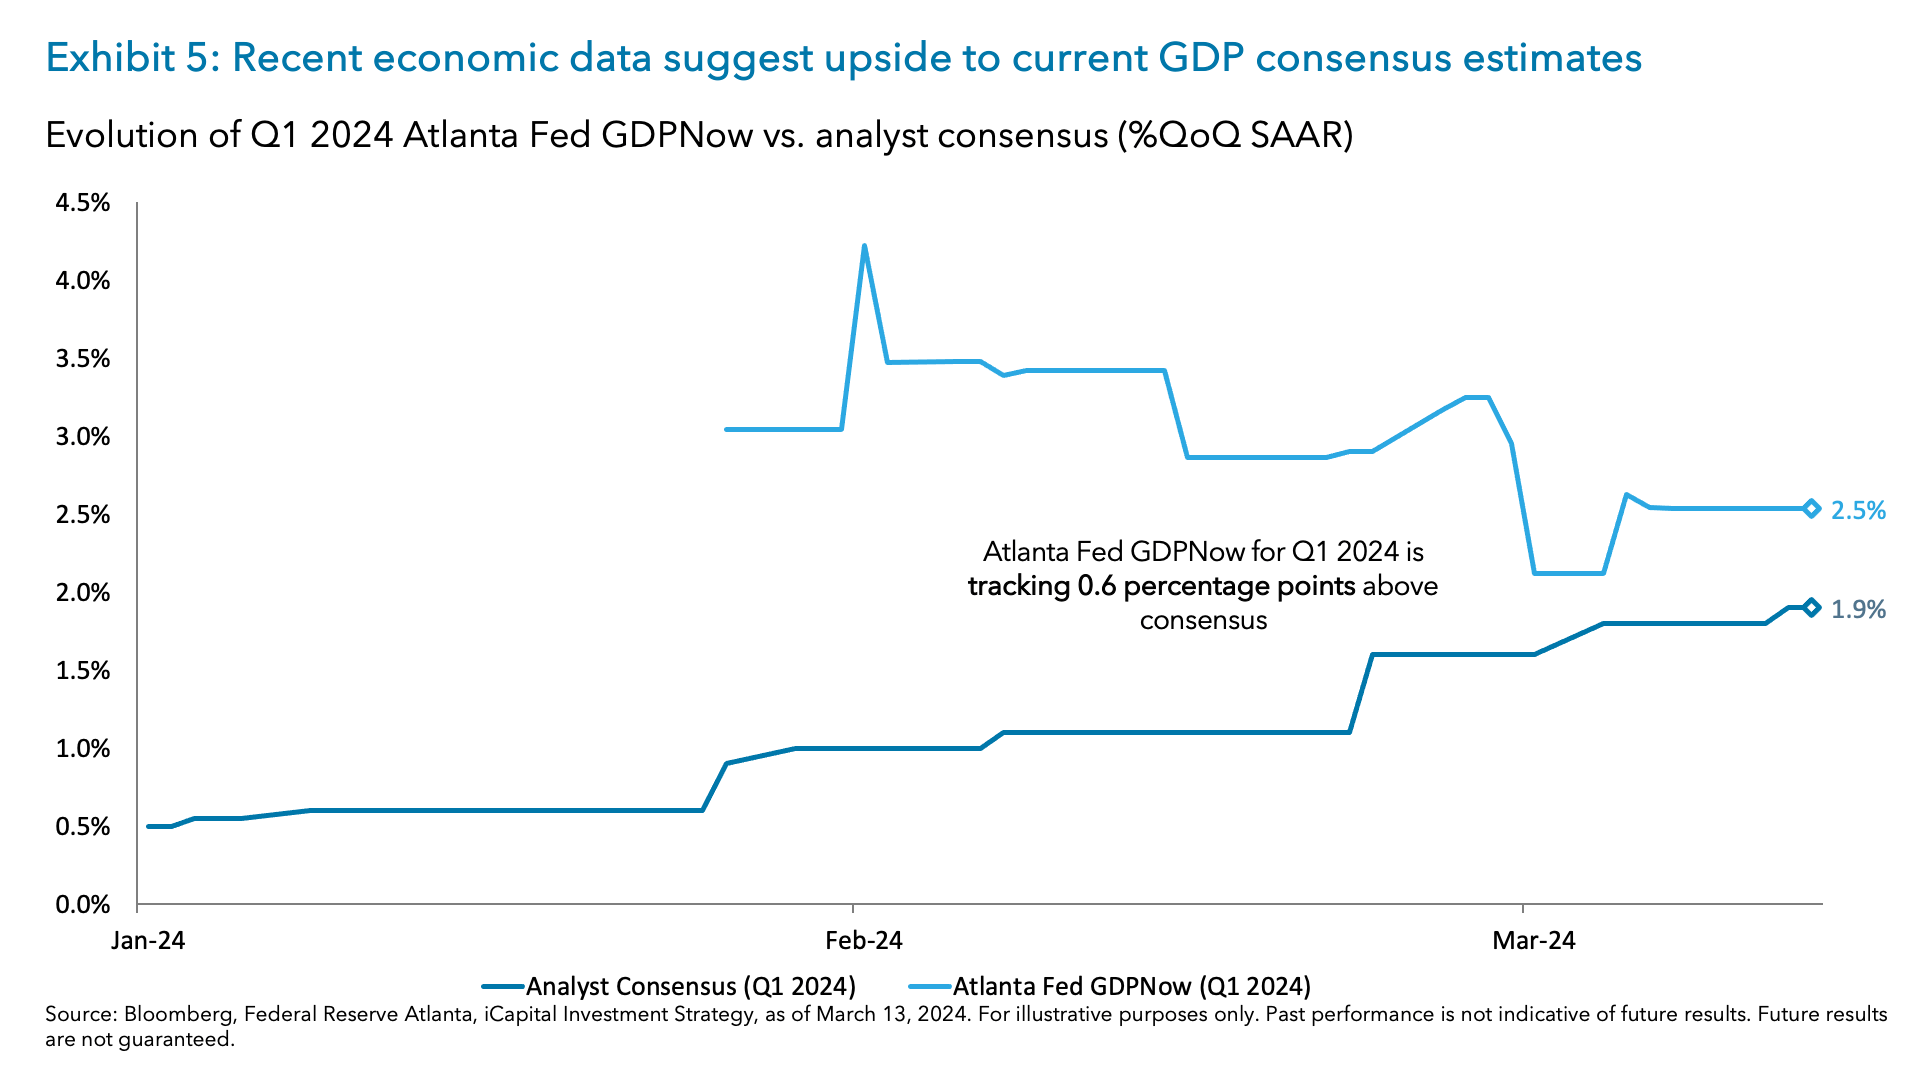
Indeed, since January we have largely seen economic data come in above expectations, namely jobs and inflation data. This strength supports the view that the economy could be experiencing a reacceleration or a “no landing” scenario. Despite the fears of overheating, we have seen data start to cool from the torrid pace at the start of the year – indicating that the economy may be operating in a “sweet spot”. This can be seen with the Atlanta GDPNow estimate, where despite its recent weakness, is still pointing to 2.5% growth for the first quarter of 2024, which is above potential U.S. growth and about 60 bps higher than consensus forecasts (Exhibit 5).14 We also believe this enthusiasm is supported by the Citi Economic Surprise index, which has trended higher since the start of the year, indicating that reported economic data has largely been above expectations.15
We think this “enthusiasm”, or “sweet spot” could continue as we are starting to see a slight improvement of leading indicators. Specifically, the Institute for Supply Management (ISM) manufacturing new orders versus inventories ratio remains above one, which is at levels seen in mid-2022.16 The improvement of this ratio indicates that new demand is outstripping current inventories and therefore a pick-up in production might be needed – likely leading to an uptick in the ISM later this year. In addition, despite the ISM service reading coming in below expectations last week (week of March 4), the new orders subcomponent came in above expectations and is just shy of its highest levels over the last year – also pointing to a potential pick-up in the indicator more broadly. If leading indicators continue to improve and enter into an expansion, or > 50, this could support outperformance of cyclical sectors and could potentially benefit the Republican baskets discussed above.
Focusing on Fundamentals Should Help Investors Weather Any Election Related Volatility
The strength of the U.S. economy has not only supported U.S. equity markets since the start of the year, but has also supported the cyclical trade. While the Republican policy baskets have benefitted from a jump in Trump’s presidential election odds and polling numbers, we also think the pro-cyclical nature of these baskets have benefitted from the “economic enthusiasm” we have seen so far this year.
Of course, investors should prepare for some election volatility which may stem from rhetoric around taxes, tariffs, big tech regulation and export controls, but we would continue to invest through it.
We continue to believe that focusing on fundamentals and how economic data evolves will ultimately be more important than the election outcome. And regardless of outcome, markets have historically rallied in the 12 months following the election.
1. PredictIt, Bloomberg, iCapital Investment Strategy, as of March 5, 2024.
2. Bloomberg, Morgan Stanley, iCapital Investment Strategy, as of Feb. 27, 2024.
3. PredictIt, Bloomberg, iCapital Investment Strategy, as of March 14, 2024.
4. Real Clear Politics, iCapital Investment Strategy, as March 5, 2024.
5. Real Clear Politics, iCapital Investment Strategy as March 5, 2024.
6. Morgan Stanley, iCapital Investment Strategy, as of Feb. 1, 2024.
7. Bloomberg, iCapital Investment Strategy, as of March 11, 2024 .
8. Bloomberg, Morgan Stanley, iCapital Investment Strategy, as March 11, 2024.
9. Bloomberg, Goldman Sachs, iCapital Investment Strategy, as of March 11, 2024.
10. Bloomberg, iCapital Investment Strategy, as March 8, 2024.
11. Bloomberg, iCapital Investment Strategy, as of March 4, 2024.
12. Bloomberg, iCapital Investment Strategy, as of March 5, 2024.
13. Bloomberg, iCapital Investment Strategy, as of March 5, 2024.
14. Atlanta Federal Reserve, Bloomberg, iCapital Investment Strategy, as of March 5, 2024.
15. Bloomberg, iCapital Investment Strategy, as of March 5, 2024.
16. Bloomberg, iCapital Investment Strategy, as of March 11, 2024.
IMPORTANT INFORMATION
The material herein has been provided to you for informational purposes only by Institutional Capital Network, Inc. (“iCapital Network”) or one of its affiliates (iCapital Network together with its affiliates, “iCapital”). This material is the property of iCapital and may not be shared without the written permission of iCapital. No part of this material may be reproduced in any form, or referred to in any other publication, without express written permission of iCapital.
This material is provided for informational purposes only and is not intended as, and may not be relied on in any manner as, legal, tax or investment advice, a recommendation, or as an offer or solicitation to buy or sell any security, financial product or instrument, or otherwise to participate in any particular trading strategy. This material does not intend to address the financial objectives, situation, or specific needs of any individual investor. You should consult your personal accounting, tax and legal advisors to understand the implications of any investment specific to your personal financial situation.
iCapital Markets LLC operates a platform that makes available financial products to financial professionals. In operating this platform, iCapital Markets LLC generally earns revenue based on the volume of transactions that take place in these products and would benefit by an increase in sales for these products.
The information contained herein is an opinion only, as of the date indicated, and should not be relied upon as the only important information available. Any prediction, projection or forecast on the economy, stock market, bond market or the economic trends of the markets is not necessarily indicative of the future or likely performance. The information contained herein is subject to change, incomplete, and may include information and/or data obtained from third party sources that iCapital believes, but does not guarantee, to be accurate. iCapital considers this third-party data reliable, but does not represent that it is accurate, complete and/or up to date, and it should not be relied on as such. iCapital makes no representation as to the accuracy or completeness of this material and accepts no liability for losses arising from the use of the material presented. No representation or warranty is made by iCapital as to the reasonableness or completeness of such forward-looking statements or to any other financial information contained herein.
Securities products and services are offered by iCapital Markets, an SEC-registered broker-dealer, member FINRA and SIPC, and an affiliate of iCapital, Inc. and Institutional Capital Network, Inc. These registrations and memberships in no way imply that the SEC, FINRA, or SIPC have endorsed any of the entities, products, or services discussed herein. Annuities and insurance services are provided by iCapital Annuities and Insurance Services LLC, an affiliate of iCapital, Inc. “iCapital” and “iCapital Network” are registered trademarks of Institutional Capital Network, Inc. Additional information is available upon request.
© 2024 Institutional Capital Network, Inc. All Rights Reserved.


