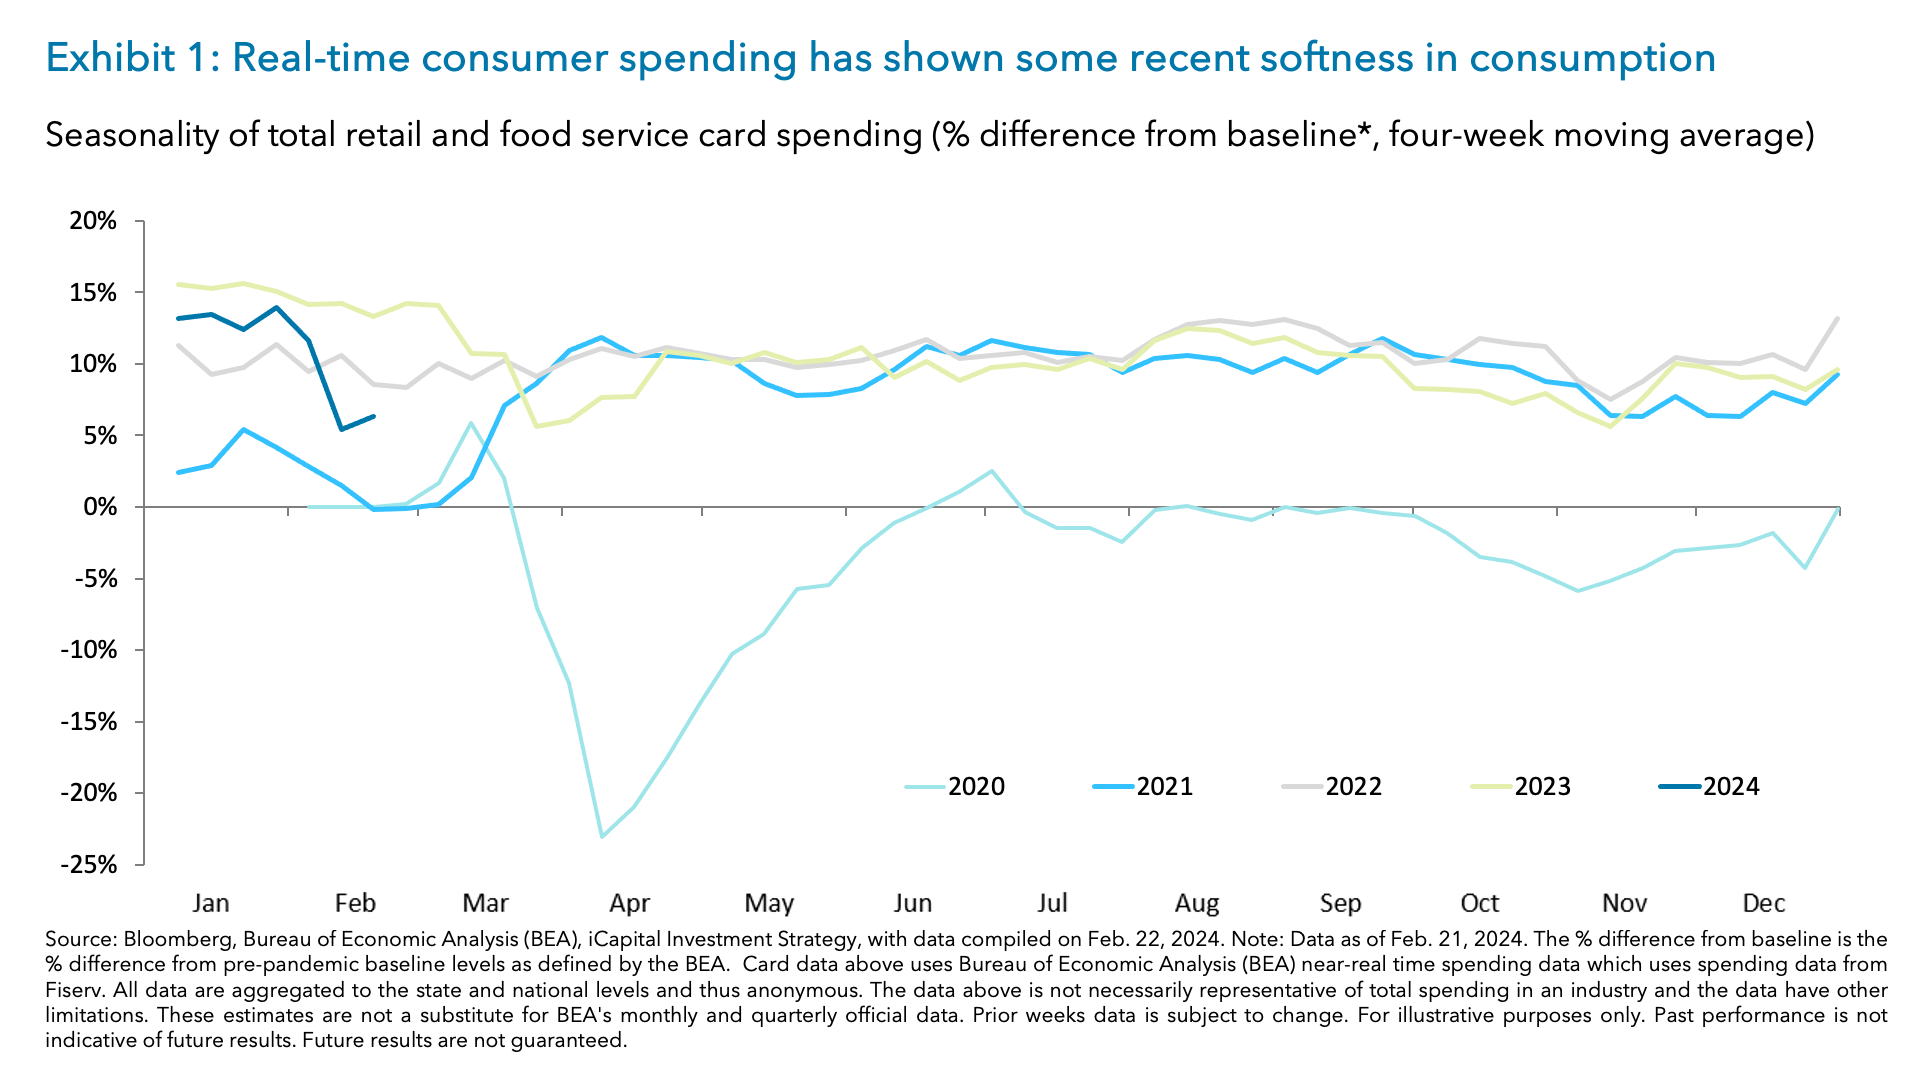
In the spring of 2023, we discussed how we expected the U.S. consumer to remain resilient and support economic growth in light of elevated interest rates. Indeed, personal consumption has remained strong, namely in the fourth quarter 2023 where it contributed 1.9 percentage points (ppt) of the 3.3% fourth quarter 2023 GDP growth (QoQ, SAAR).1 However, recent data, including a weaker-than-expected retail sales print and rising delinquencies noted in a New York Fed report, have raised some questions about the health of the U.S. consumer. And real-time consumer spending data is showing a slower pace of consumption versus 2023 levels (Exhibit 1).2 Despite this, we still see factors that could support broad-based consumer strength in 2024, specifically for the lower-income consumer, which may lead to a convergence between the top and bottom-income quintiles. And the bulk of retail earnings over the next couple of weeks will be informative of this view. Ultimately, participation from a more broad-based U.S. consumer should be supportive for ongoing growth in consumption, economic activity, and discretionary spending.
Mind the recent divergence between higher and lower-income consumers
Recent data points have called into question the current state of the U.S. consumer, leading us to look at a variety of traditional and alternatives data. While our analysis suggests continued consumer resiliency, we’ve noticed a divergence between the higher and lower-income consumer. We explore three key divergences in savings, real disposable incomes, and delinquencies in more detail below.
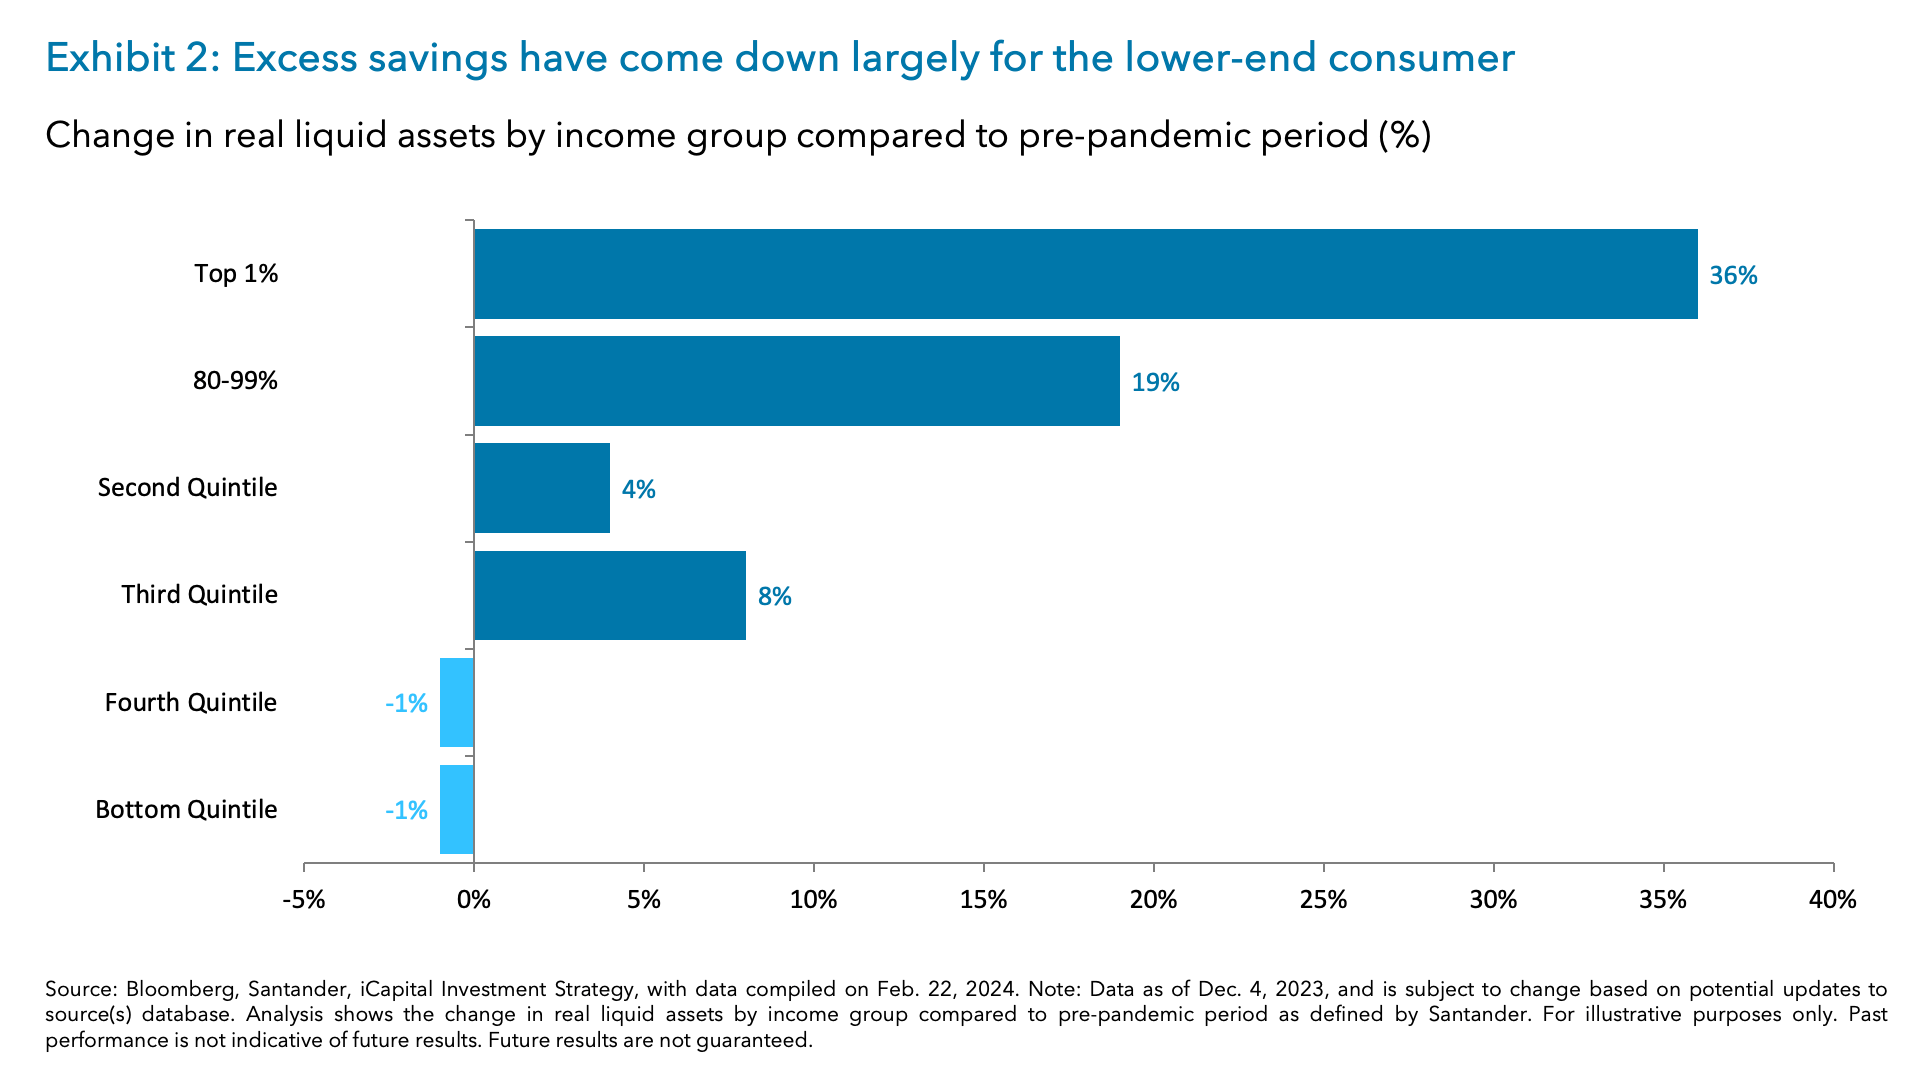
1. The lower-income consumer has depleted their excess savings: It’s no surprise that excess savings have come down from their post-pandemic highs, but excess cash reserves remain in place – particularly for higher-income consumers (Exhibit 2). In fact, the top 80-99% of U.S. consumers have savings that are 19% higher than pre-pandemic levels.3 These excess savings become even more pronounced when you look at the top 1%, where savings are 36% higher than at the start of the pandemic.4 However, when you look at the bottom 40%, savings are about a percent lower than at the start of the pandemic – showing that this group has been drawing on its savings to meet purchasing needs.5
In addition, the top-income quintile is also benefiting from the strong recovery in financial assets and home prices over the last year and a half. In fact, household net worth remains near the record high set in the third quarter of 2023, with the top-income quintile accounting for 70% of the total household net worth – indicating a widening gap in the household balance sheet for higher and lower-income cohorts.6
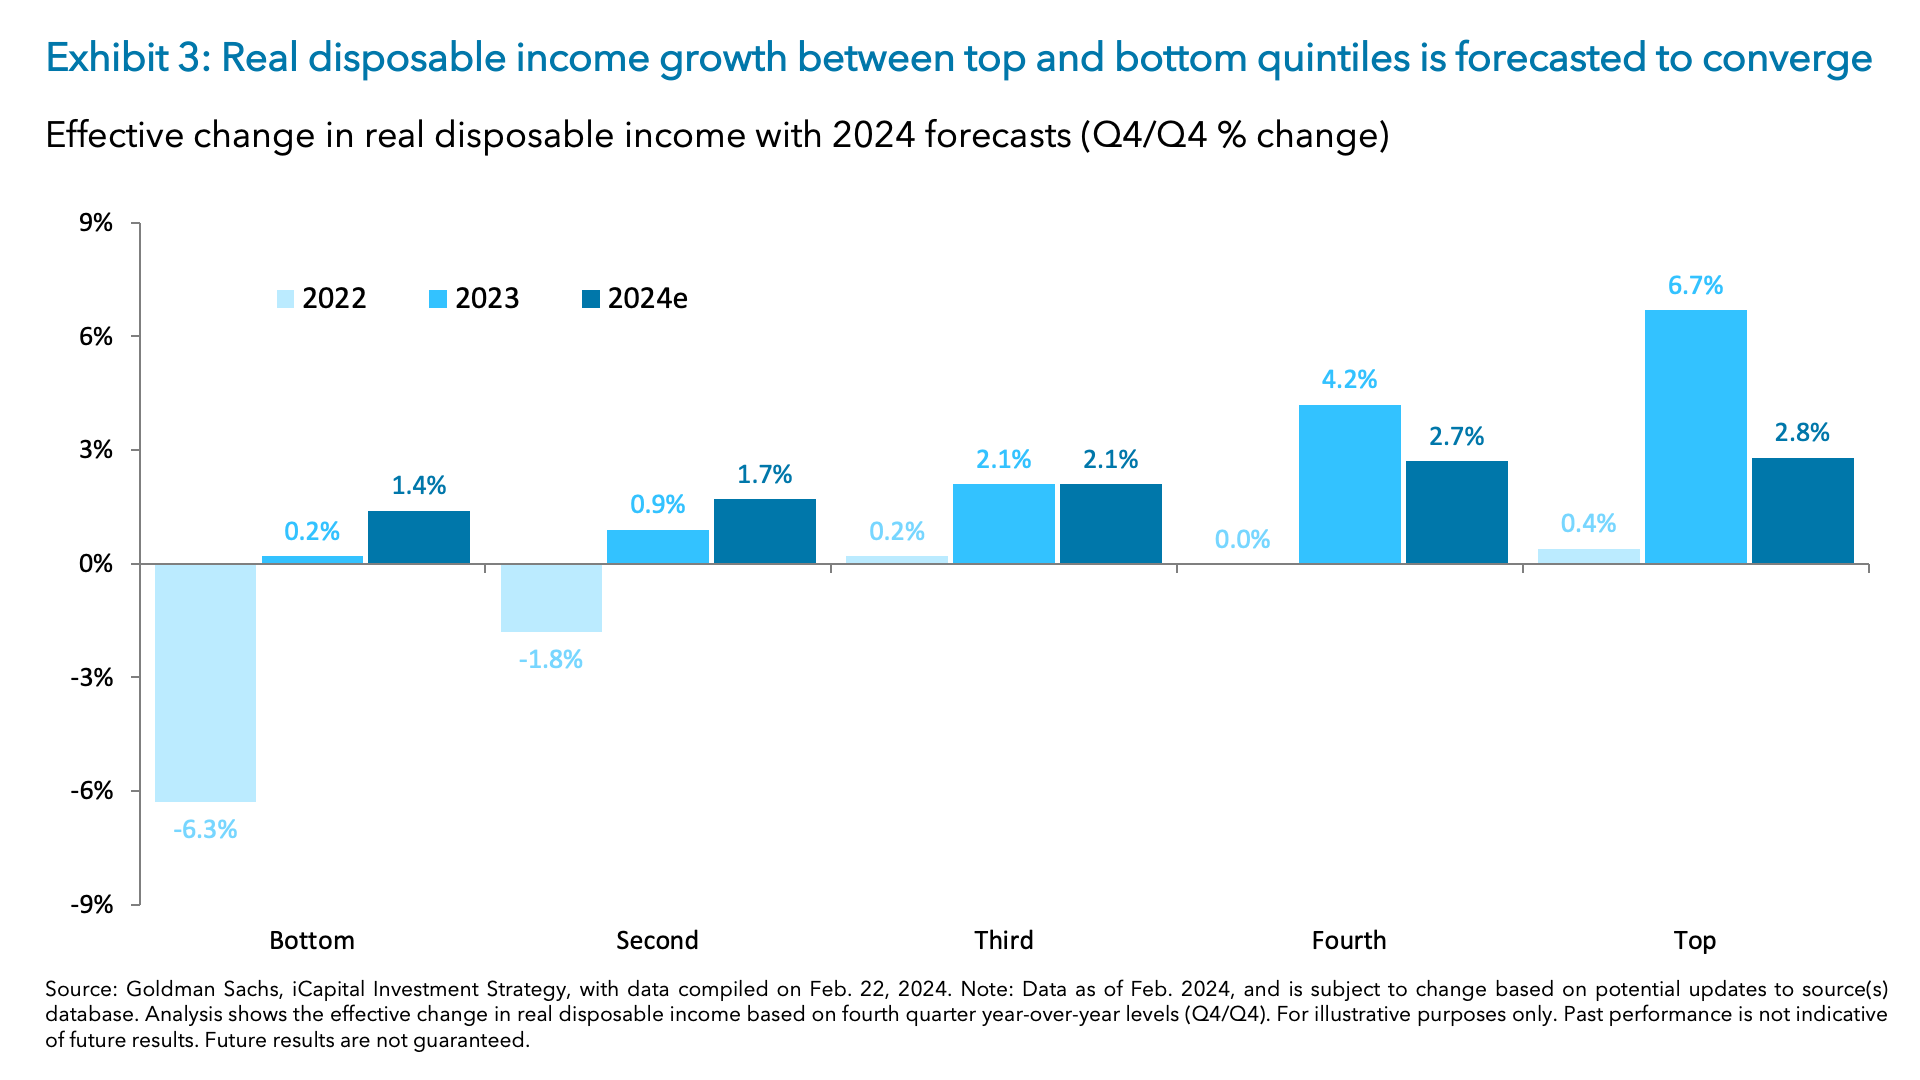
2. Real disposable income growth for the bottom-income quintile continues to lag: Lower-income consumers saw stronger nominal wage growth earlier in the post-pandemic recovery, however, higher inflation has weighed on their real disposable income. Indeed, by the end of 2022, the bottom-income quintile saw their real disposable income decline by -6.3% (Q4/Q4), which compared to slight gain for the top-income quintile (Exhibit 3).7 Even as real disposable incomes recovered by the end of 2023, the increase for the bottom-income quintile continued to lag the top quintile: +0.2% versus +6.7% (Q4/Q4).8 Interest income appears to be the main driver in the divergence of real disposable income between the bottom and top-income quintiles. Given the top-income quintile owns a majority of financial assets, they have benefitted from the interest generated by these holdings.
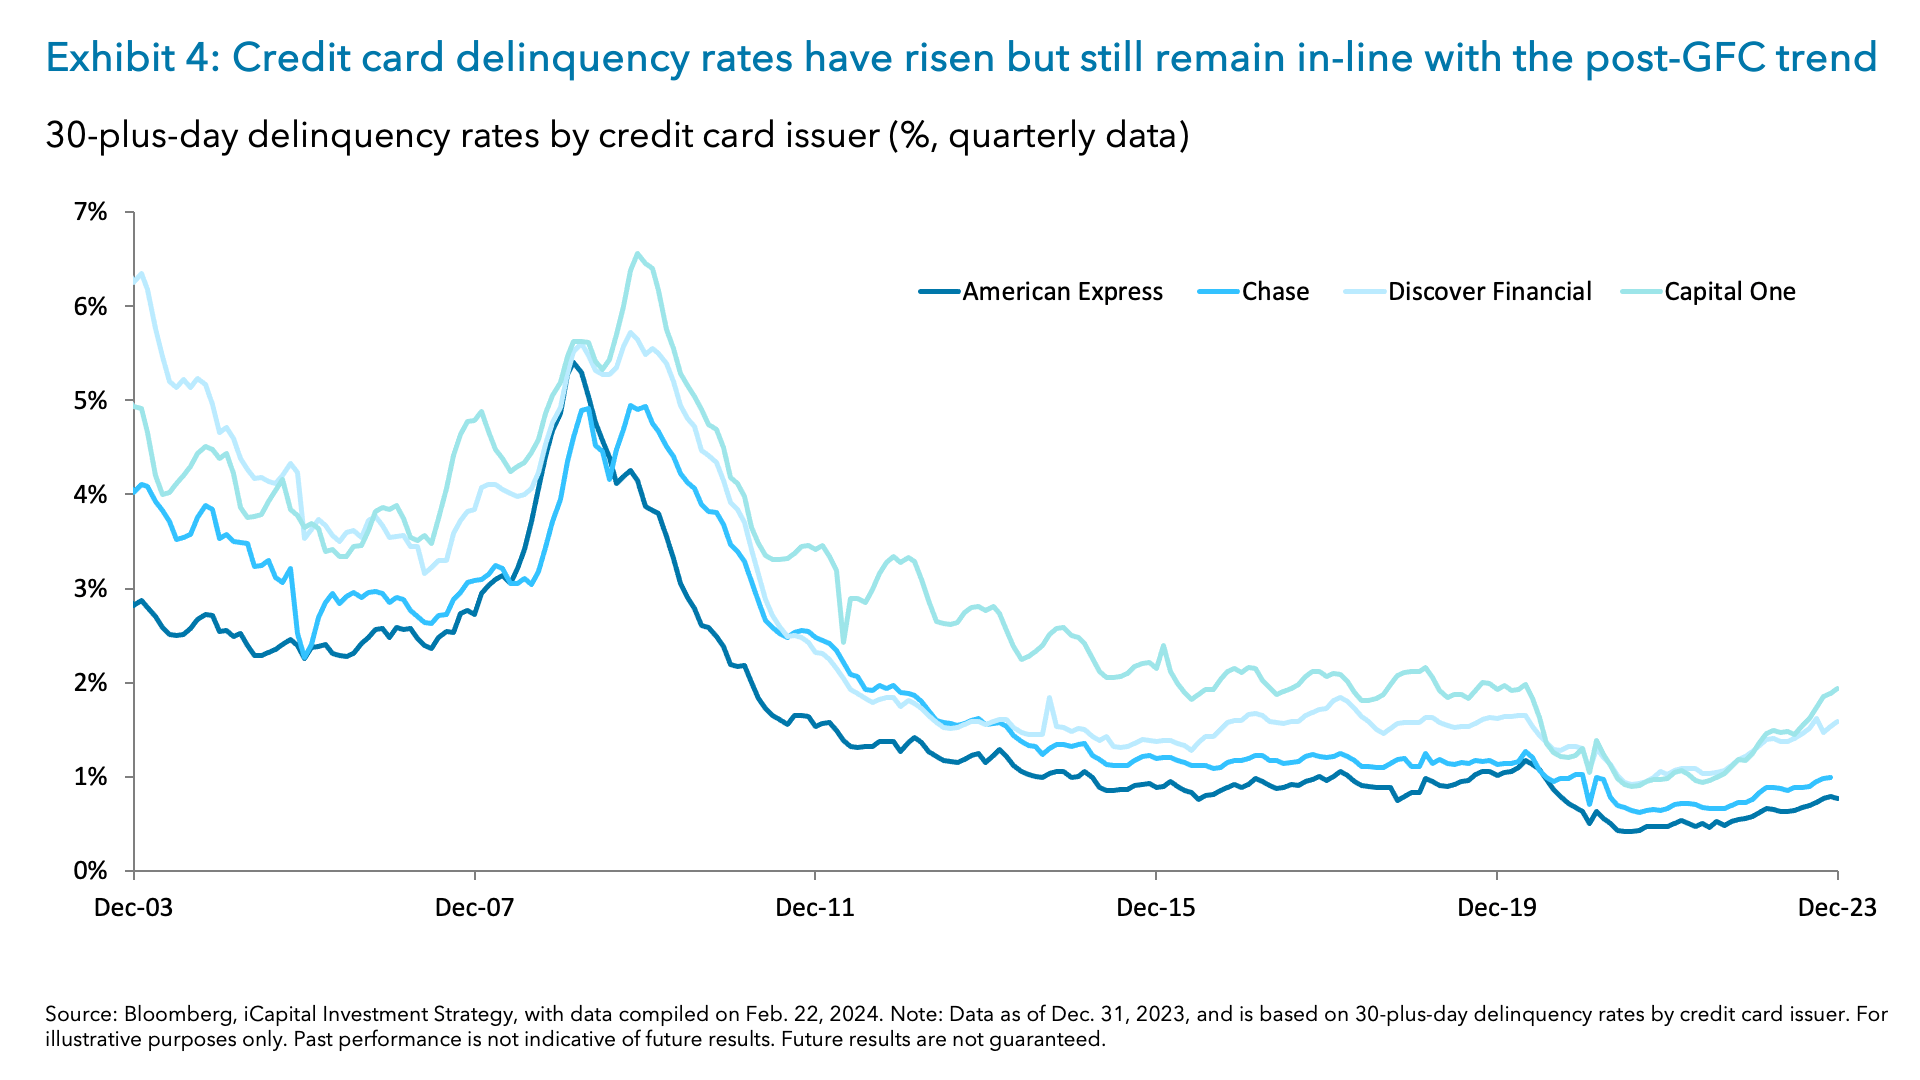
3. The increase in delinquencies has been more pronounced for the lower-income consumer: Credit card delinquencies for the lower-income consumer, proxied by Capital One and Discover, have risen to their highest level since 2020 (Exhibit 4). This compares to the higher-income consumer, proxied by American Express and Chase, where delinquencies have also risen, but levels are still well below their 2020 highs. We note, though, that despite delinquencies rising at a faster rate for the lower-income consumer, they are only returning to post Great Financial Crisis (GFC) trend levels, indicating that credit card delinquencies for the lower-income consumer are normalizing versus deteriorating.
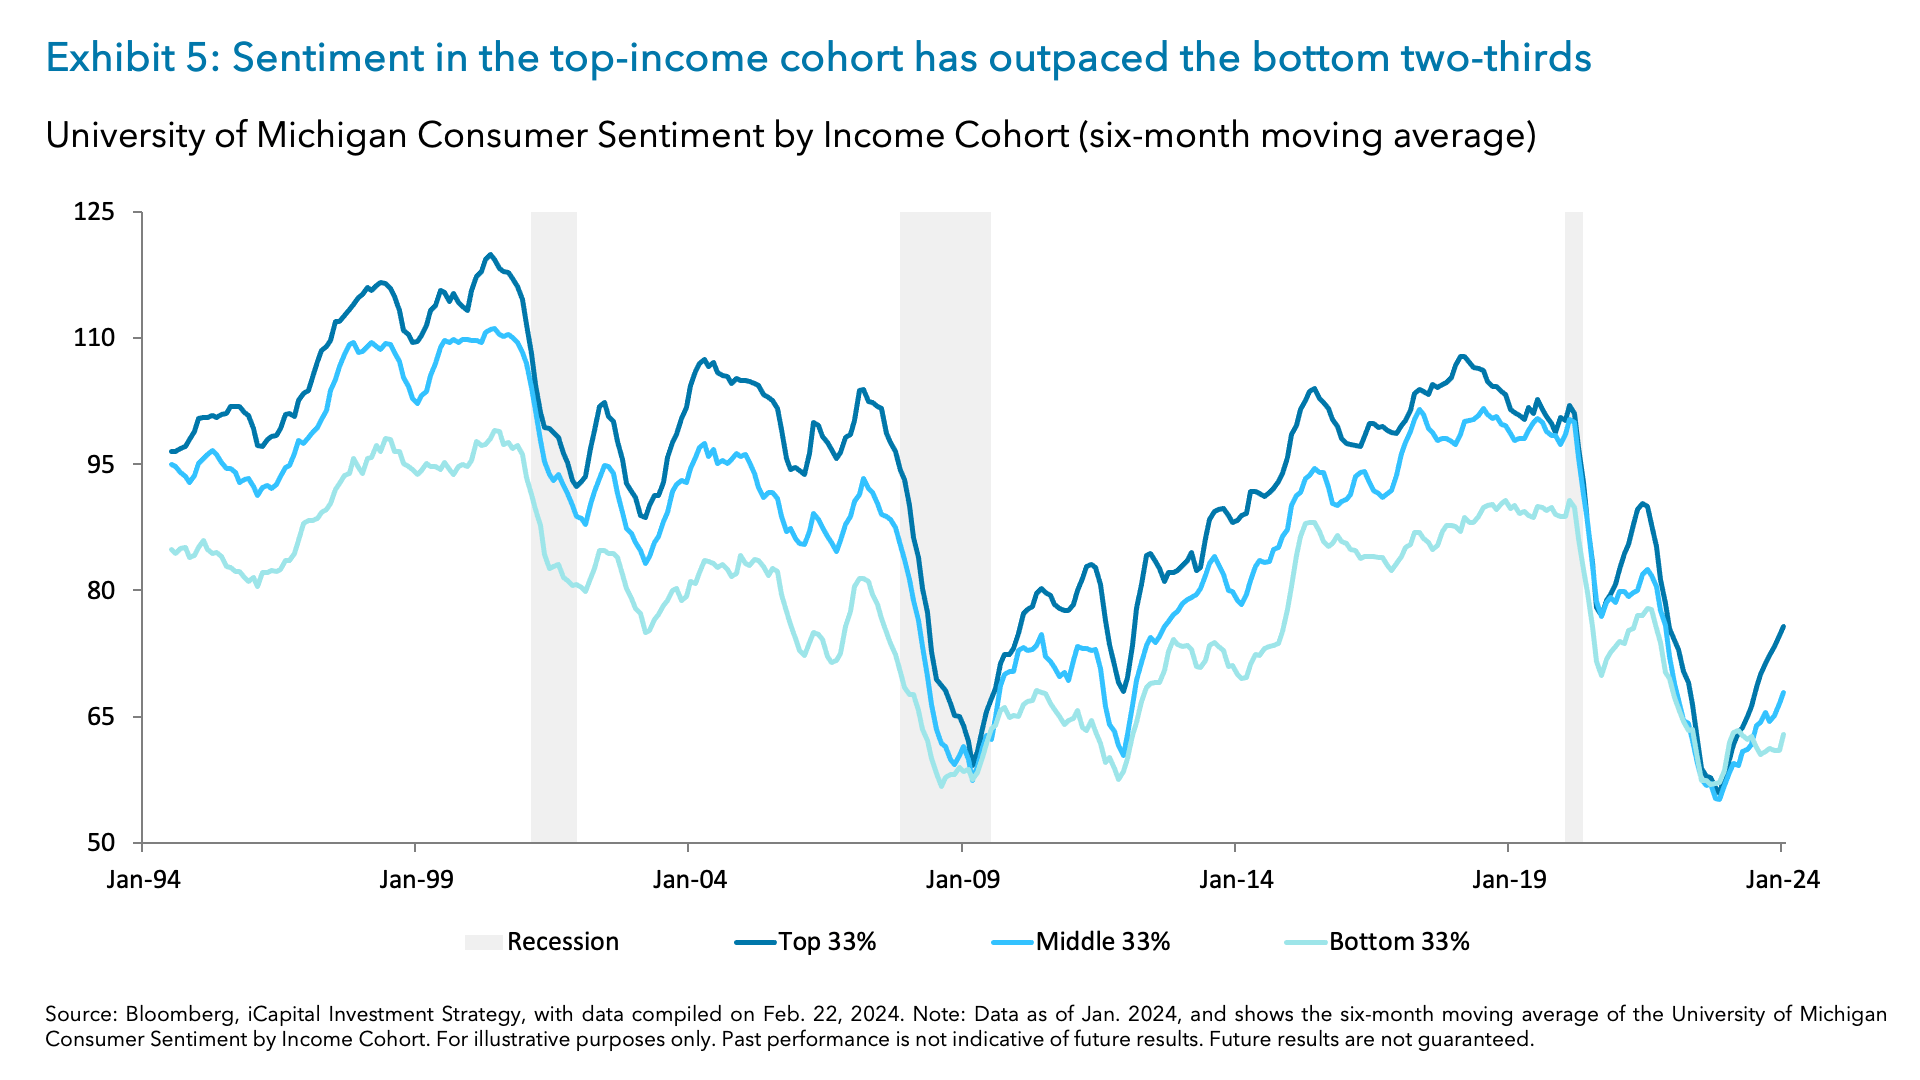
What we can conclude is a stronger spending backdrop for higher-income versus lower-income consumers. This is likely why the sentiment in the top-income cohort has outpaced the bottom two-thirds, as they have benefited from a strong recovery in their balance sheet and their savings and investments remained elevated (Exhibit 5).
Factors that could support the lower-income consumer and narrow this divergence 2024
Despite the gains in the University of Michigan Consumer Sentiment survey being led by the top-income consumers, sentiment across all income cohorts have increased, with the gap in sentiment between the higher and lower-income groups narrowing, now in its 28th percentile – down from the 81st percentile in September 2023.
Falling gas prices, which are 17% below their October 2023 highs, likely have played a role.9 This decline is particularly supportive of the lower-income consumer, as they spend about 20% of their income on gasoline, three times the national average.10 The current consensus forecasts expects crude oil to remain near current levels for the remainder of the year, which should keep gas prices fairly stable for 2024.11 All else equal, this should support real disposable income growth for the lower-income cohort.
Further, the spread of real disposable income growth between the top and bottom quintile is forecasted to converge in 2024, as seen above in Exhibit 3. Recent analysis from Goldman Sachs shows that real disposable income for the bottom-income quintile is expected to rise by 1.4% in 2024.12 This compares to the 2.8% rise that is forecasted for the top-income quintile.13 Based on these forecasts, the gap between the top and bottom quintiles is expected to shrink from 6.5 ppt in 2023 to 1.4 ppt in 2024.14
Lastly, we believe the lower-income consumer appears to be financing some of their spending through Buy Now, Pay Later (BNPL) options. A recent Federal Reserve survey showed that 73% of BNPL users have income level below $75,000, with only 18% over that threshold.15 While BNPL makes up a small share of total revolving credit – $28 billion global volumes relative to $1.3 trillion in credit card balances outstanding – its use has grown rapidly since 2020.16 Indeed, that BNPL global transaction volume grew by 142% from the first quarter of 2020 through second quarter of 2023.17
While there are concerns about the overleveraging of the lower-income consumer and the debt sustainability for these households, banks and payment firms have not expressed similar concerns. Affirm Holdings noted in their recent earnings report that they have been able to deliver strong credit outcomes. Indeed, during their most recent earnings announcement (February 8, 2024), they mentioned how their delinquency rate remained stable at 2.3%, which was flat quarter-over-quarter and year-over-year.18 This compares to the 3.1% delinquency rate reported in the recent New York Fed credit and debt report, which showed a slight rise in delinquencies.19 Lastly, several banks and payment companies have offered guidance that they expect to see delinquencies stabilize in the second half of the year. While we are not dismissing the potential risks that could come with increased BNPL usage, we think BNPL will continue to grow in popularity as a financing option for the lower-income consumer to meet and smooth out their spending needs against their income.
Broader consumer strength could lead to catch-up opportunities in the discretionary sector
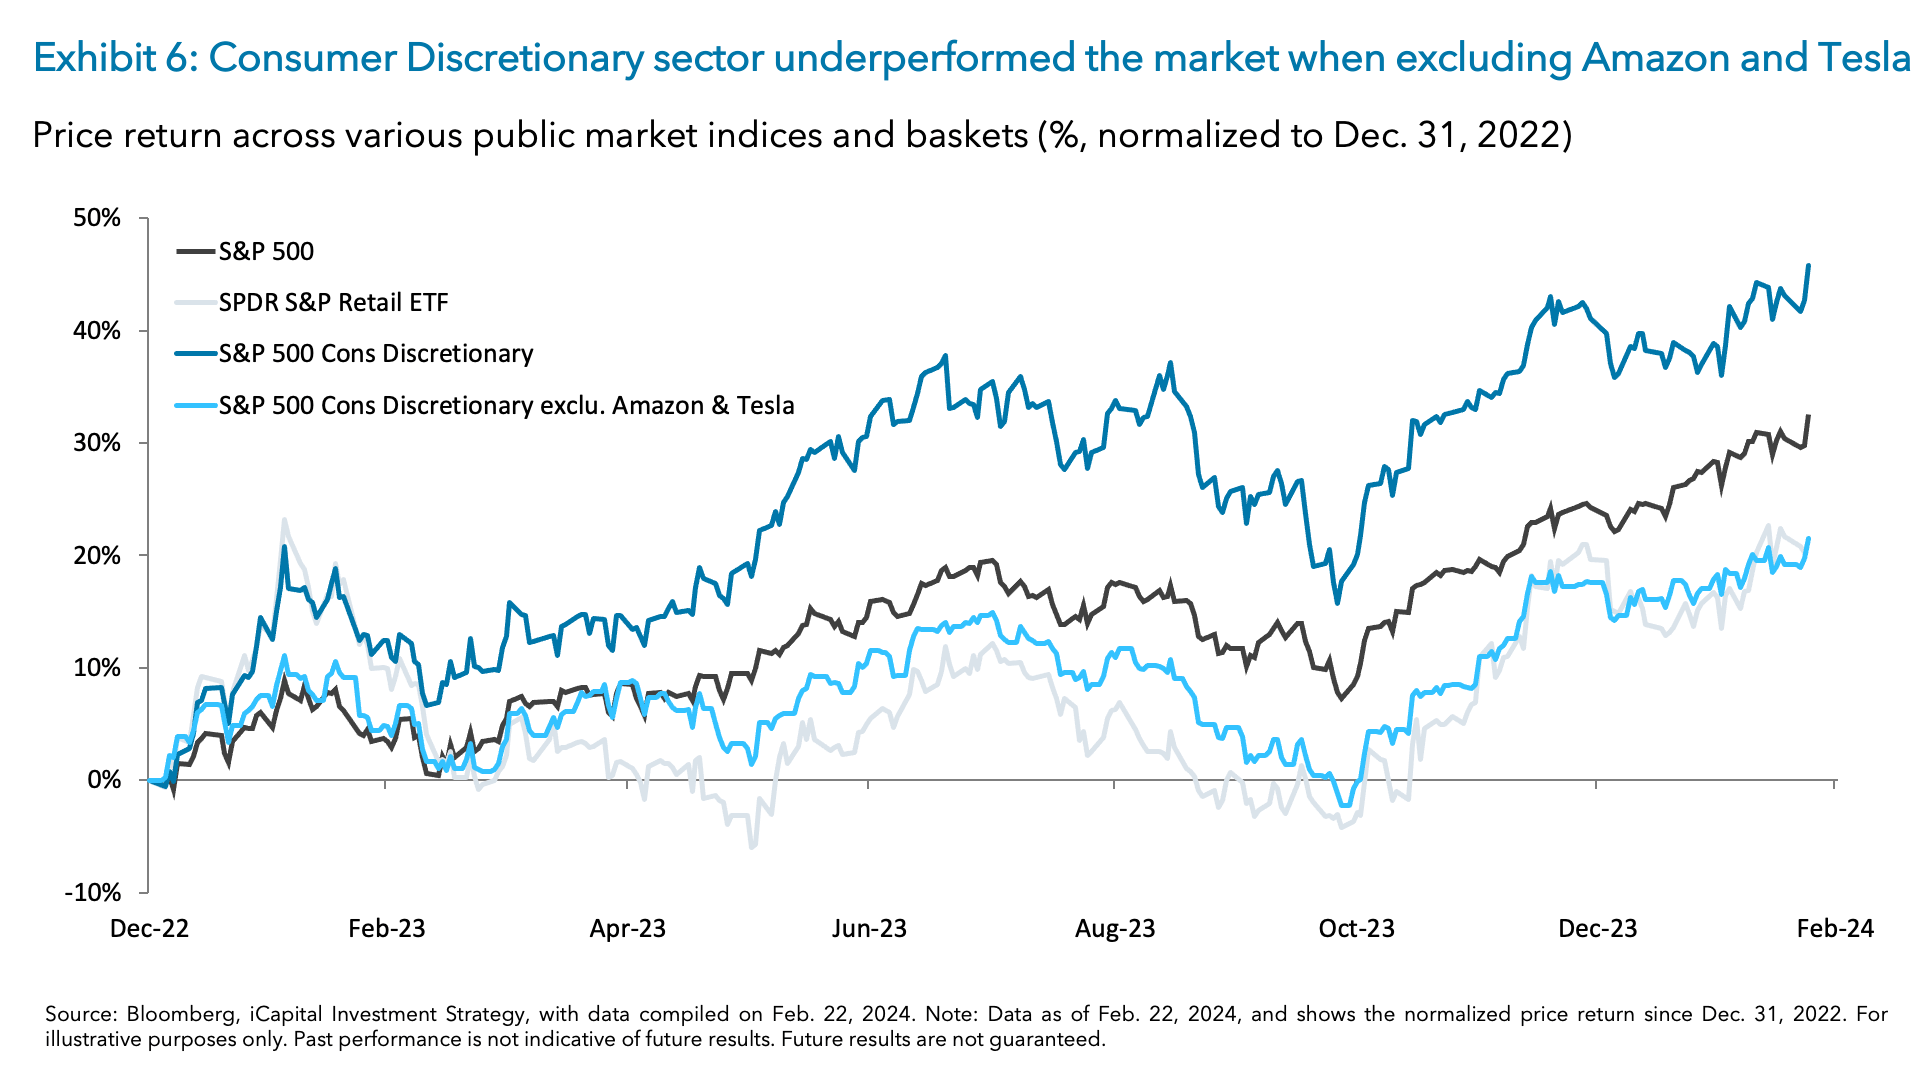
Improving consumer strength, specifically from the lower-income cohort, should lead to a convergence between the top and bottom-income consumer in 2024, thereby supporting further economic activity along with greater opportunities for growth in the discretionary sector. In fact, despite the consumer discretionary sector outperforming the S&P 500 by 16 percentage points last year (+42% versus +26% for the S&P 500), the sector actually underperformed the broader market by roughly seven percentage points once you strip out Amazon and Tesla (Exhibit 6).
The S&P Retail ETF, a proxy for the overall retail industry, also underperformed the market by about five percentage points in 2023.20 Given this underperformance, valuations for the industry continue to look increasingly attractive on both an absolute and relative basis. Currently, the retail industry is trading at a forward price-to-earnings ratio (P/E) of 13.9x, significantly lower than its 10-year average of 17.5x.21 Relative to the S&P 500 20.6x forward multiple, the retail industry’s valuation is notably lower and is trading at its lowest level relative to the index since at least 2010.22
If the divergence between the lower-income consumer and higher-income continues to narrow as we expect in 2024, this broadening of consumption could provide a catch-up opportunity for the consumer discretionary industry. The convergence of these income cohorts could also shift spending patterns and preferences, which could impact specific sub-industry groups. We will explore these beneficiaries in the coming weeks.
1. Bloomberg, Bureau of Economic Analysis, iCapital Investment Strategy, as of Feb. 21, 2024.
2. Bloomberg, iCapital Investment Strategy as of Feb. 16, 2024.
3. Bloomberg, iCapital Investment Strategy as of Feb. 16, 2024.
4. Bloomberg, iCapital Investment Strategy as of Feb. 16, 2024.
5. Bloomberg, iCapital Investment Strategy as of Feb. 16, 2024.
6. Federal Reserve, iCapital Investment Strategy as Feb. 16, 2024.
7. Bureau of Economic Analysis, iCapital Investment Strategy as of Feb. 16, 2024.
8. Bureau of Economic Analysis, iCapital Investment Strategy as of Feb. 16, 2024.
9. Bloomberg, iCapital Investment Strategy as of Feb. 16, 2024.
10. American council for energy efficient economy, iCapital Investment Strategy as of Feb. 14, 2024.
11. Bloomberg, iCapital Investment Strategy as of Feb. 16, 2024.
12. Bureau of Economic Analysis, Goldman Sachs, iCapital Investment Strategy as of Feb. 22, 2024.
13. Bureau of Economic Analysis, Goldman Sachs, iCapital Investment Strategy as of Feb. 22, 2024.
14. Bureau of Economic Analysis, Goldman Sachs, iCapital Investment Strategy as of Feb. 22, 2024.
15. Buy Now, Pay Later Statistics | Bankrate, Feb. 16, 2024.
16. Morgan Stanley, iCapital Investment Strategy as of Feb. 16, 2024.
17. Morgan Stanley, iCapital Investment Strategy as of Feb. 16, 2024.
18. Affirm, iCapital Investment Strategy as of Feb. 16, 2024.
19. New York Federal Reserve, iCapital Investment Strategy as of Feb. 16, 2024.
20. Bloomberg, iCapital Investment Strategy as of Feb. 22, 2024.
21. Bloomberg, iCapital Investment Strategy as of Feb. 16, 2024.
22. Bloomberg, iCapital Investment Strategy as of Feb. 16, 2024.
IMPORTANT INFORMATION
The material herein has been provided to you for informational purposes only by Institutional Capital Network, Inc. (“iCapital Network”) or one of its affiliates (iCapital Network together with its affiliates, “iCapital”). This material is the property of iCapital and may not be shared without the written permission of iCapital. No part of this material may be reproduced in any form, or referred to in any other publication, without express written permission of iCapital.
This material is provided for informational purposes only and is not intended as, and may not be relied on in any manner as, legal, tax or investment advice, a recommendation, or as an offer or solicitation to buy or sell any security, financial product or instrument, or otherwise to participate in any particular trading strategy. This material does not intend to address the financial objectives, situation, or specific needs of any individual investor. You should consult your personal accounting, tax and legal advisors to understand the implications of any investment specific to your personal financial situation.
iCapital Markets LLC operates a platform that makes available financial products to financial professionals. In operating this platform, iCapital Markets LLC generally earns revenue based on the volume of transactions that take place in these products and would benefit by an increase in sales for these products.
The information contained herein is an opinion only, as of the date indicated, and should not be relied upon as the only important information available. Any prediction, projection or forecast on the economy, stock market, bond market or the economic trends of the markets is not necessarily indicative of the future or likely performance. The information contained herein is subject to change, incomplete, and may include information and/or data obtained from third party sources that iCapital believes, but does not guarantee, to be accurate. iCapital considers this third-party data reliable, but does not represent that it is accurate, complete and/or up to date, and it should not be relied on as such. iCapital makes no representation as to the accuracy or completeness of this material and accepts no liability for losses arising from the use of the material presented. No representation or warranty is made by iCapital as to the reasonableness or completeness of such forward-looking statements or to any other financial information contained herein.
Securities products and services are offered by iCapital Markets, an SEC-registered broker-dealer, member FINRA and SIPC, and an affiliate of iCapital, Inc. and Institutional Capital Network, Inc. These registrations and memberships in no way imply that the SEC, FINRA, or SIPC have endorsed any of the entities, products, or services discussed herein. Annuities and insurance services are provided by iCapital Annuities and Insurance Services LLC, an affiliate of iCapital, Inc. “iCapital” and “iCapital Network” are registered trademarks of Institutional Capital Network, Inc. Additional information is available upon request.
© 2024 Institutional Capital Network, Inc. All Rights Reserved.


