Key Takeaways:
- With government shutdowns delaying key reports, investors are increasingly turning to private sources like ADP and other alternatives measures to help fill the gap for insights into the labor markets.
- GDP growth continues to hold up even as labor markets are softening, likely driven by productivity gains from AI.
- Markets are nearing fair value, and while this could boost near-term volatility, we’re leaning into areas of conviction – most notably infrastructure software.
As markets continue to make all-time highs, one wouldn’t think that we are in the midst of a government shutdown. Yes, markets tend to look past the shutdown relatively quickly, but, from an economic standpoint, market participants are flying somewhat blind. Given the lack of government data releases, especially when labor data is cooling, investors have shifted their focus to alternative and private data measures.
Given this challenging and uncertain environment, especially with the S&P 500 trading near the high-end of our fair value range, we felt like it was an important time to level set the current macro and market environment and highlight the areas we still find favorable.
The Labor Week That Wasn’t
Investors have been particularly focused on labor market data given slowing employment growth over the last few months. When the nonfarm payroll (NFP) report, which was scheduled for Friday, October 3, was delayed because of the government shutdown, there was much focus on the ADP report, released earlier in the week.
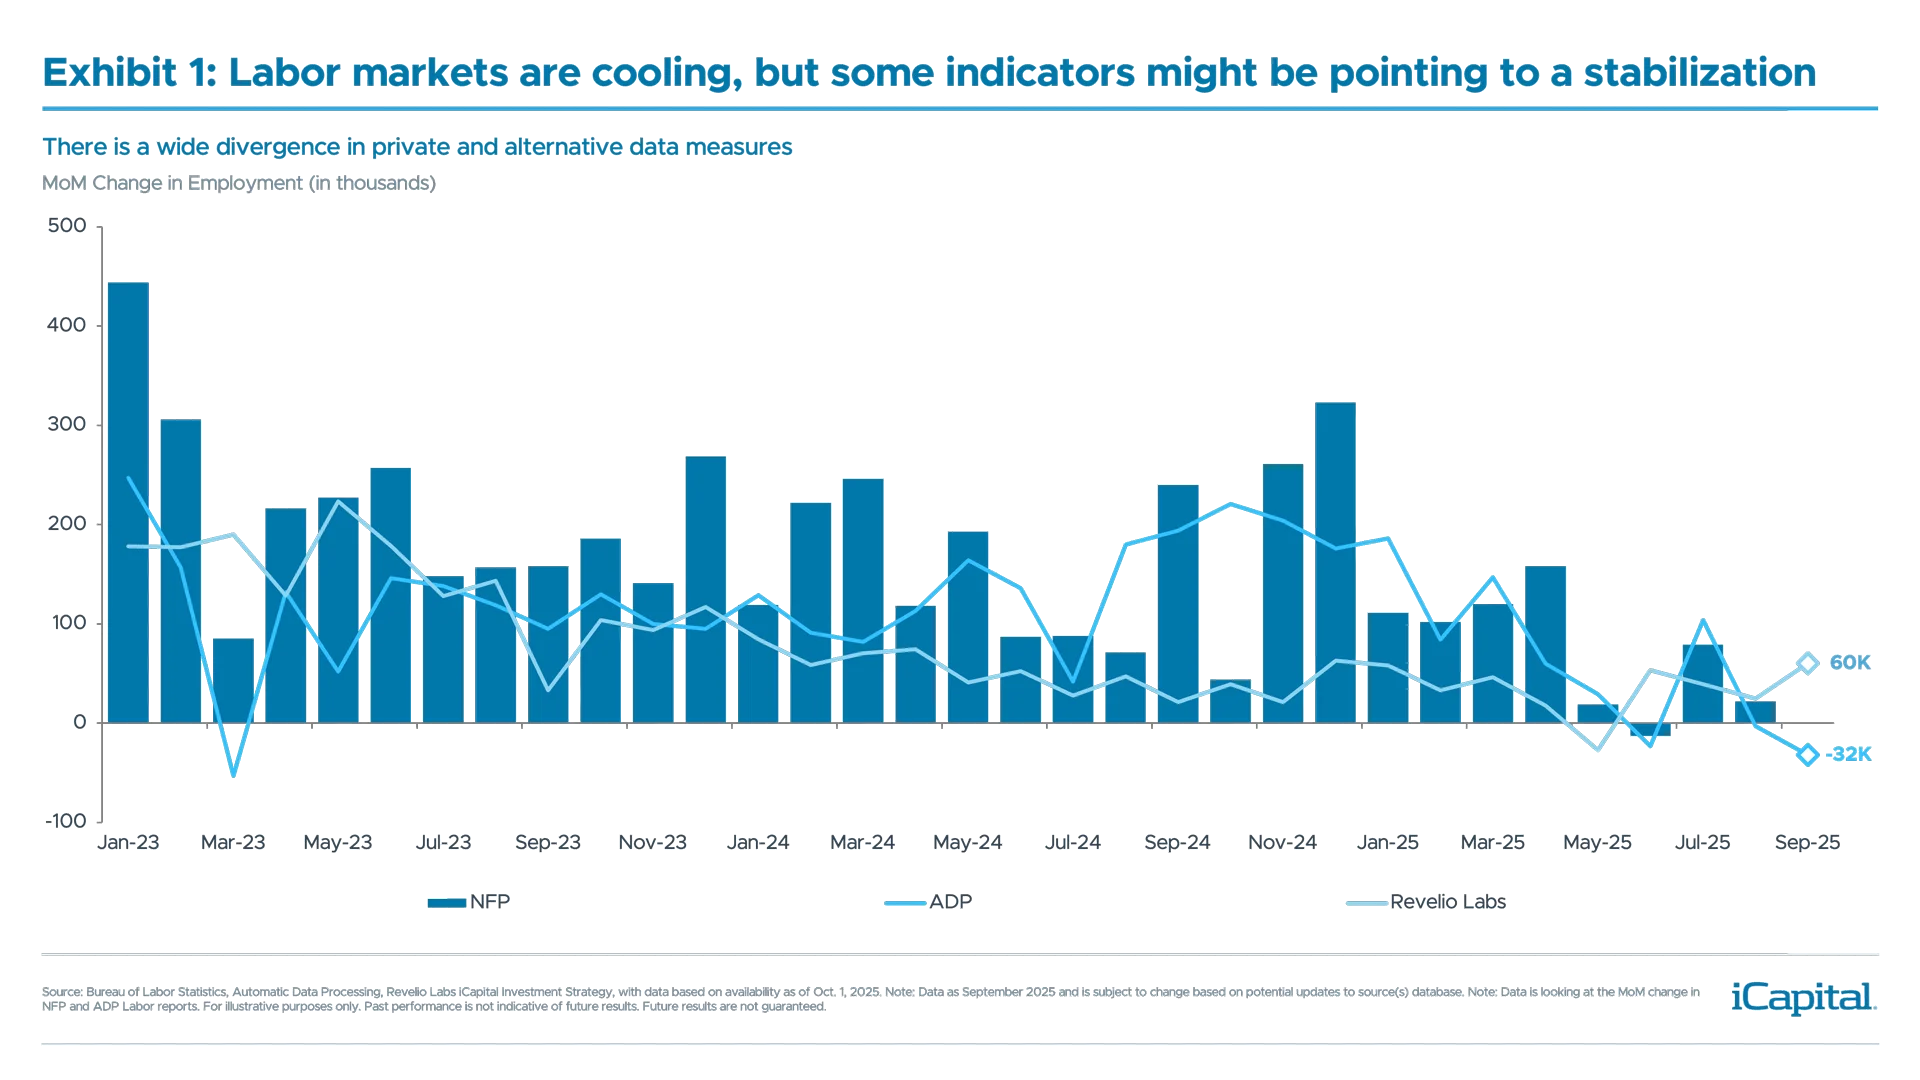
The ADP report continued to signal a cooling labor market as jobs declined by -33K for September, and the August reading was downwardly revised from 51K to -3K, seen in Exhibit 1.1 Much of the weakness in this month’s reading was attributable to ADP using the QCEW revision in their data series, which lowered the September reading from the pre benchmark data by 43k.2
Outside of the weak headline reading, there were a few things in the report that stood out:
- Bifurcation between small and large firms. Small firms (<50 employees) reduced headcount by 40K, which compared to large firms (>500 employees) which increased their headcount by 33K3 – highlighting the K shaped nature of our economy.
- Regional discrepancies. Despite the negative headline reading, only one region saw job losses. This was isolated to the Midwest, specifically the East North Central states, where jobs declined by 67K.4
 Given the concerns around a slowing labor market, and with government data likely to be delayed over the coming weeks, we are looking towards alternative datasets to help inform our outlook. While providers like PayChex, which focus on small and medium sized businesses, also signal a continued slowing in labor data, other providers are potentially showing signs of stabilization. Indeed, Revelio Labs, which leverages LinkedIn data, showed that employment increased by 60K in September.5 Based on their analysis, this would have correlated to a 38k print for nonfarm payrolls, or within a range of -63K to 140K.6 Given the divergence in private and alternative data providers, this is part of the reason why the estimates for the September NFP report are so wide – high of 105K and low of -20K.7
How Could the Government Shutdown Further Impact the Labor Market?
Outside of delayed releases of future reports, the government shutdown could have other effects on the labor market.
First, if the shutdown extends beyond October 18, it will impact the collection for the October NFP report – which could delay the next release. In addition, if the shutdown lasts this long, it could also boost the unemployment rate by 0.1% to 0.2% – if miscategorized as unemployed in the report.8 But, one reason why we don’t necessarily think the impact on the unemployment rate will be as large is because all of the furloughed employees only accounts for 0.5% of the total labor force.9 Additionally, prediction sites such as Polymarket and Kalshi suggested the shutdown should last 11.5 days – or ending before the end of the reference period – but odds have since been extended to roughly 20 days.10 Only adding to potential uncertainty.
President Trump has also threatened to lay off some of the government workforce, which could increase the drag of the shutdown. Based on initial estimates, the shutdown could shave GDP growth by 0.1 percentage point (pp) to 0.15pp every week the shutdown persists11 – ultimately made up in the following quarter. However, if government employees are laid off, this could double to 0.2pp to 0.3pp, with some of the losses becoming permanent.12
The Growing Disconnect Between the Economy and Labor Markets
While the trend in labor markets has become slightly more worrying and something we are closely monitoring, economic growth has held up. This is highlighted by the Bloomberg Economic Surprise Index recently turned positive for the first time since April (liberation day) and its highest level since November 2024.13 In addition, the Atlanta GDPNow model is projecting growth at 3.8% for Q3 – well above trend.14 This comes after the positive revision to Q2 GDP, which was the largest going back to Q2 2024.15
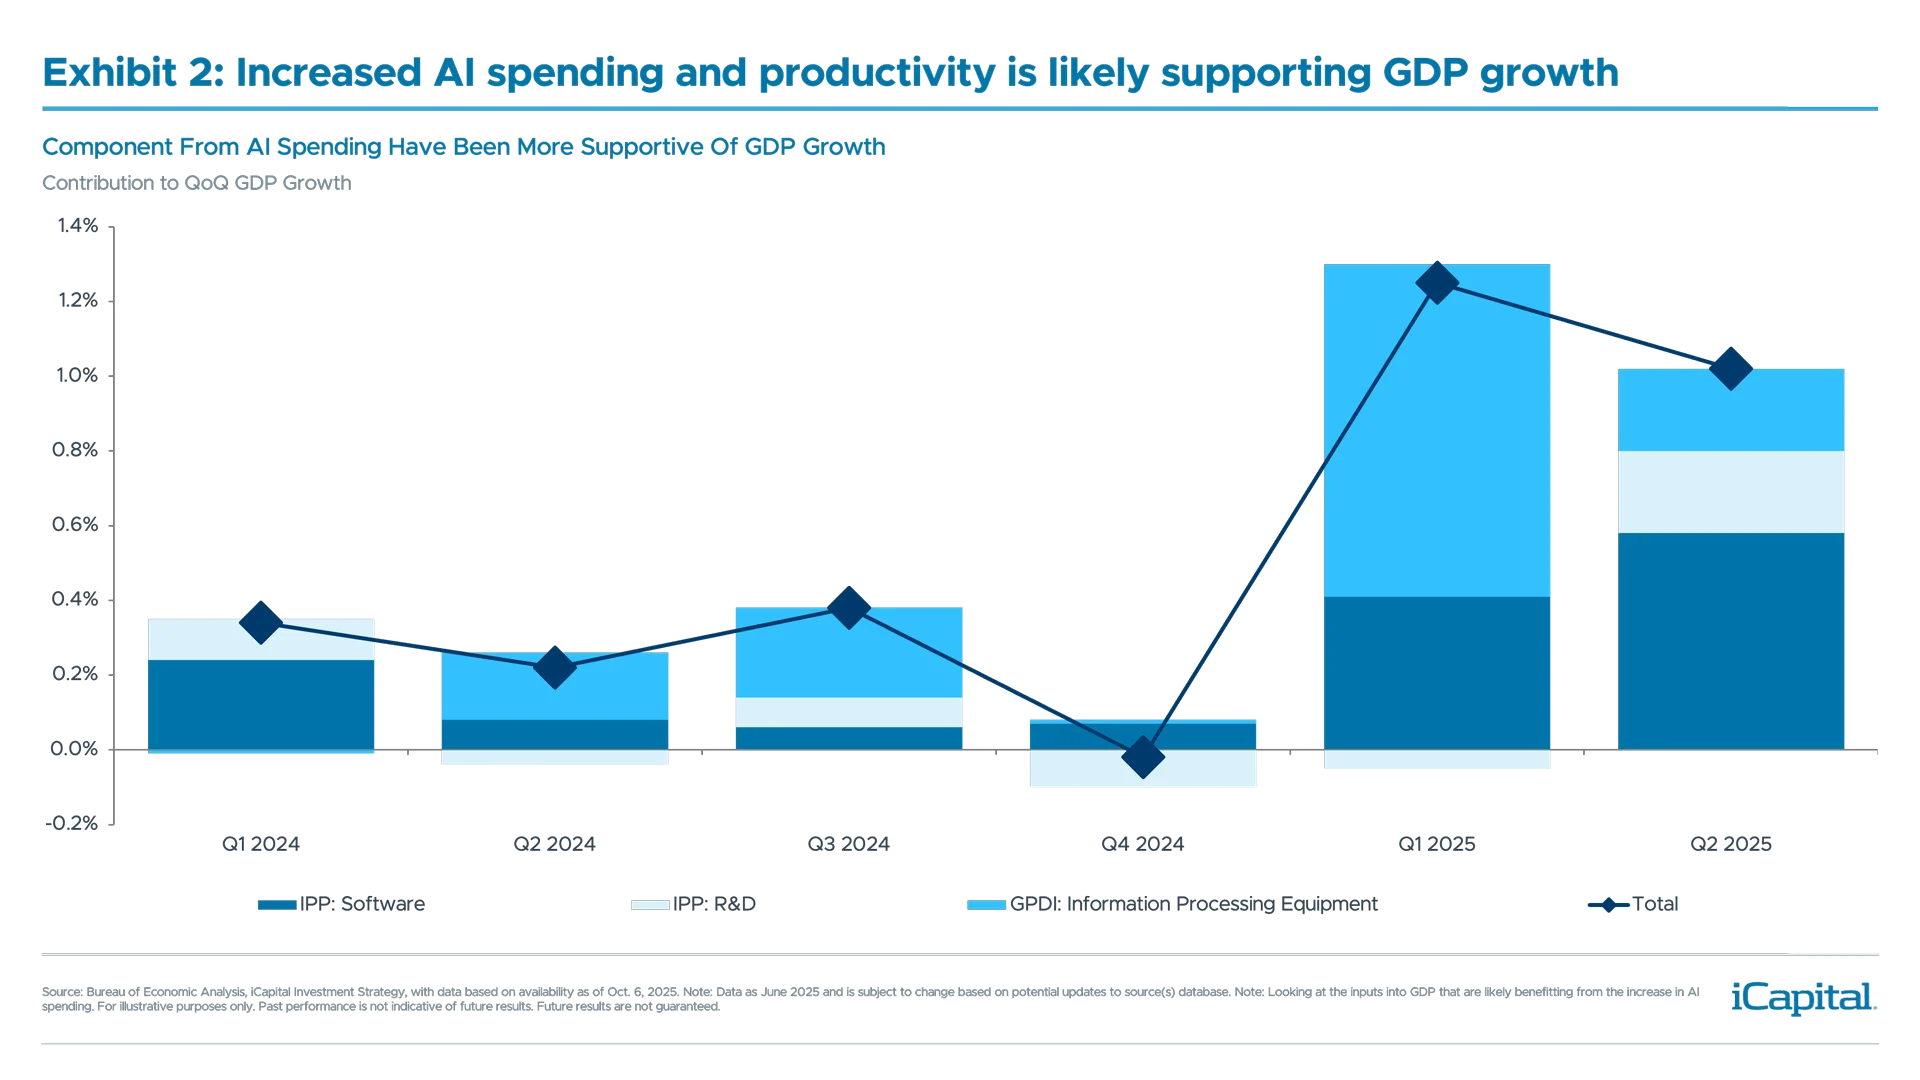
But we think economic growth can be supported over the coming quarters. While easier policy has become a tailwind for growth this year and next, economic data has also been supported by an increased contribution from AI. Indeed, based on estimates, AI has likely added 1pp to GDP growth (see Exhibit 2) this year16 – productivity is one of the reasons why economic growth has held up despite slowing labor data.
 While growth has remained resilient from an aggregate level, it does seem like the low-income consumer is starting to lag – giving way to a k-shaped economy. This trend is worth monitoring, especially as we are seeing signs of delinquencies starting to rise. But, factors like the One Big Beautiful Bill Act (OBBBA) should also turn more supportive, as it is expected to boost after tax income in the low to middle income quintiles.17
What To Do When Markets Are Approaching Fair Value?
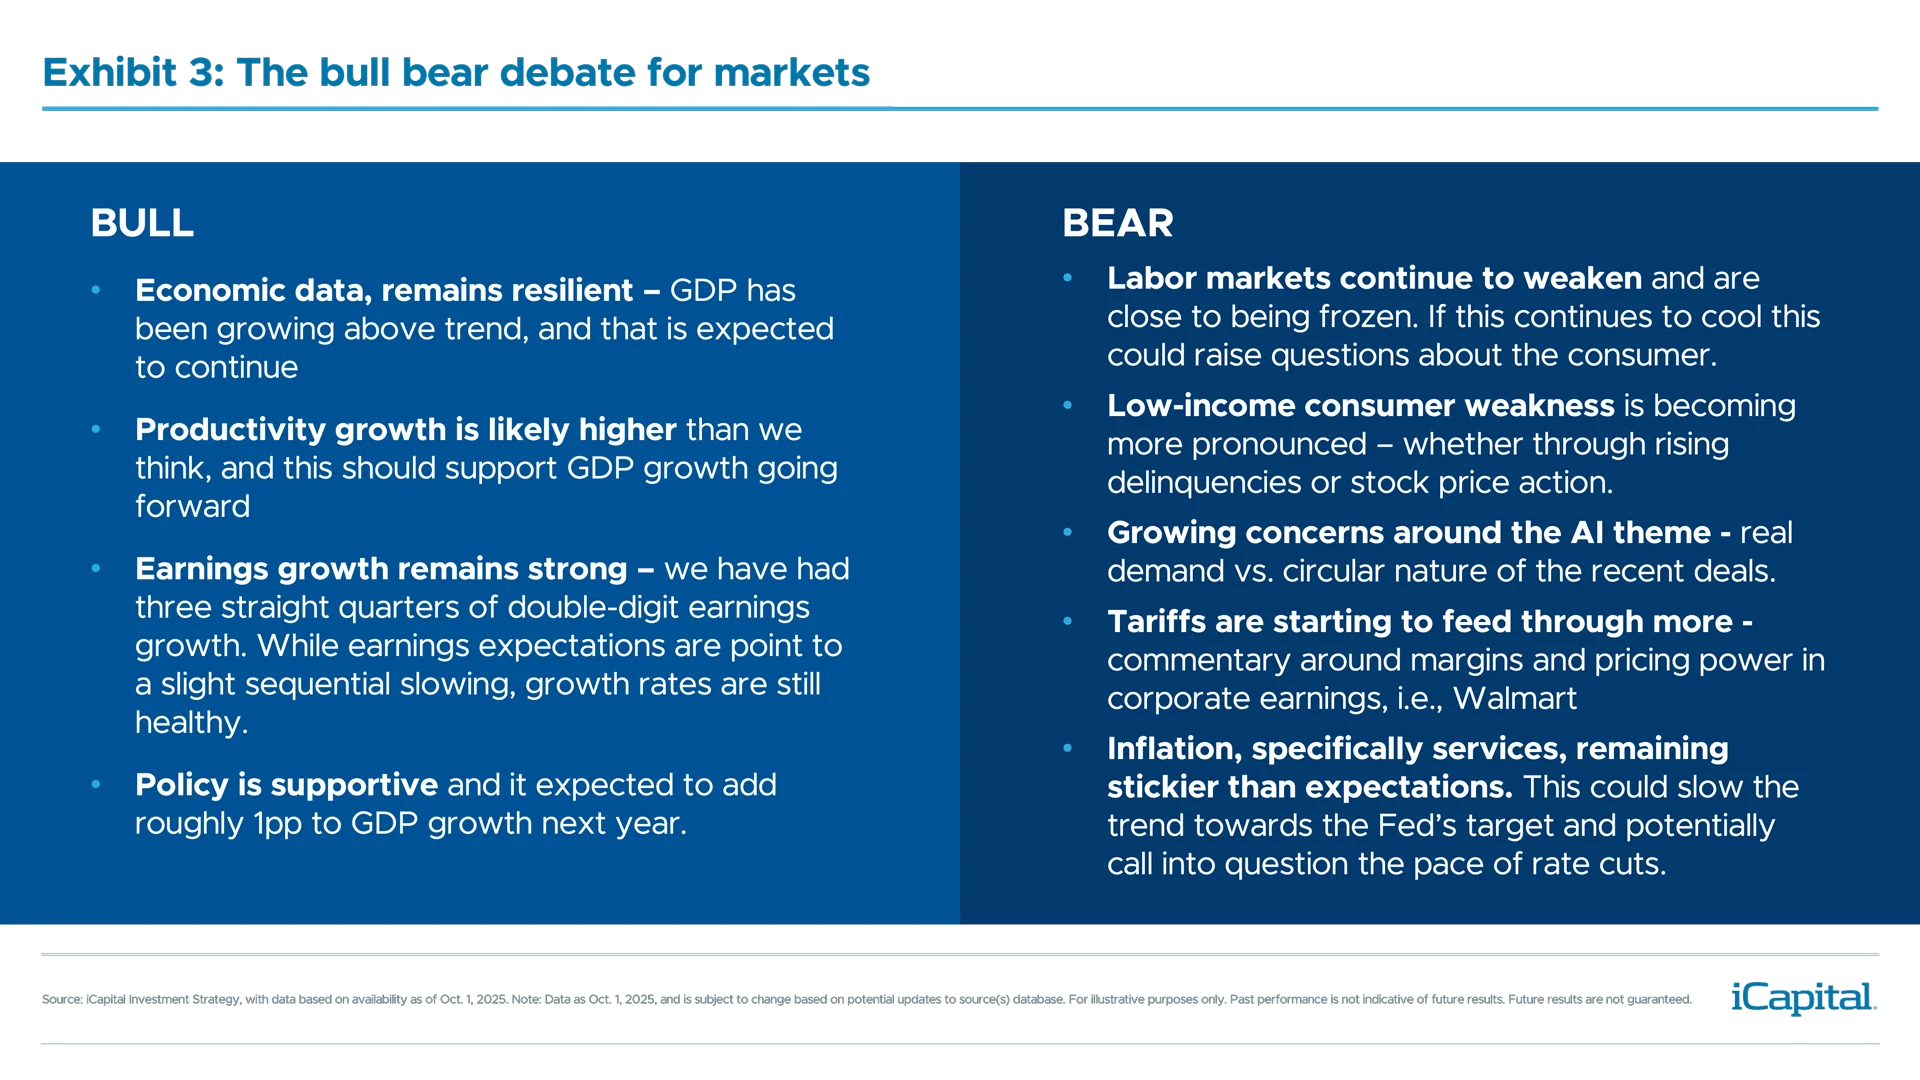
After the S&P 500 posted its best September in 15 years, and now trading above 6,700, we are within reach of the high-end of our fair value estimate. While we still see upside to equity markets from current levels, admittedly any further upside might be more limited. This could lead to a choppy equity environment, especially when valuations seem “full” to us.18 This is not to say there aren’t supportive factors to equity markets, we currently see three, but we wanted to take a more balanced view on markets at this current juncture, seen in Exhibit 3.
Three reasons why we still see upside from current levels include:
- Economic resilience – GDP has been growing above trend and could continue to be driven by productivity gains.
- Earnings growth remains strong – three straight quarters of double-digit year-over-year earnings growth.
- Policy is supportive – both monetary and fiscal policy could add about 1pp to GDP growth next year.
But, markets are also facing certain headwinds.
- Weakening labor markets – which could impact the outlook on the consumer, especially if layoffs start to rise.
- K-Shaped economy – the weakness in the low-income consumer has become more pronounced, indicating the breadth of economic growth has not been as broad.
- Questions about the AI theme – with the “circular” deal between Open AI and Nvidia, investors are asking themselves what is real demand vs. dollars changing hands.
- Inflation remains sticky – particularly in the service basket, which could slow the pace of cuts that have been priced into markets.
- Tariff pass-through – will we see more comments from companies on this during the reporting season, similar to Walmart.
 This is not to say that these factors will lead to a reversal in markets – we have been climbing a wall of worry throughout the year – but does warrant watching, especially as we are near 6800-6900 on the S&P 500.
Despite the choppiness we could see from an index level, we would look to areas where the team has conviction. Most notably we see durable growth and supportive tailwinds for infrastructure software over the coming quarters and year – discussed here.
INDEX DEFINITIONS
S&P 500 Index: The S&P 500 is widely regarded as the best single gauge of large-cap U.S. equities. The index includes 500 of the top companies in leading industries of the U.S. economy and covers approximately 80% of available market capitalization.
END NOTES
- Automatic Data Processing, as of Oct. 1, 2025.
- Automatic Data Processing, as of Oct. 1, 2025.
- Automatic Data Processing, as of Oct. 1, 2025.
- Automatic Data Processing, as of Oct. 1, 2025.
- Revelio Labs, as of Sept. 30, 2025.
- Revelio Labs, as of Sept. 30, 2025.
- Bureau of Labor Statistics, Bloomberg Economics, as of Oct. 3, 2025.
- Goldman Sachs, as of Sept. 28, 2025.
- Bureau of Labor Statistics, iCapital Investment Strategy, as of Oct. 2, 2025.
- Polymarket, Kalshi, as of Oct. 6, 2025.
- Goldman Sachs, Bank of America and Morgan Stanley, as of Sept. 29, 2025.
- Bloomberg Economics, as of Oct. 2, 2025.
- Bloomberg Economics, as of Oct. 3, 2025.
- Federal Reserve Bank of Atlanta, as of Oct. 3, 2025.
- Bureau of Economic Analysis, as of Sept. 30, 2025.
- Goldman Sachs, Bank of America, Apollo, Yale Budget Lab, iCapital Investment Strategy, as of Oct. 6, 2025.
- Tax Foundation, as of Jul. 13, 2025.
- S&P Capital IQ, as of Oct. 6, 2025.
IMPORTANT INFORMATION
The material herein has been provided to you for informational purposes only by Institutional Capital Network, Inc. (“iCapital Network”) or one of its affiliates (iCapital Network together with its affiliates, “iCapital”). This material is the property of iCapital and may not be shared without the written permission of iCapital. No part of this material may be reproduced in any form, or referred to in any other publication, without express written permission of iCapital.
This material is provided for informational purposes only and is not intended as, and may not be relied on in any manner as, legal, tax or investment advice, a recommendation, or as an offer or solicitation to buy or sell any security, financial product or instrument, or otherwise to participate in any particular trading strategy. This material does not intend to address the financial objectives, situation, or specific needs of any individual investor. You should consult your personal accounting, tax and legal advisors to understand the implications of any investment specific to your personal financial situation.
ALTERNATIVE INVESTMENTS ARE CONSIDERED COMPLEX PRODUCTS AND MAY NOT BE SUITABLE FOR ALL INVESTORS. Prospective investors should be aware that an investment in an alternative investment is speculative and involves a high degree of risk. Alternative Investments often engage in leveraging and other speculative investment practices that may increase the risk of investment loss; can be highly illiquid; may not be required to provide periodic pricing or valuation information to investors; may involve complex tax structures and delays in distributing important tax information; are not subject to the same regulatory requirements as mutual funds; and often charge high fees. There is no guarantee that an alternative investment will implement its investment strategy and/or achieve its objectives, generate profits, or avoid loss. An investment should only be considered by sophisticated investors who can afford to lose all or a substantial amount of their investment.
iCapital Markets LLC operates a platform that makes available financial products to financial professionals. In operating this platform, iCapital Markets LLC generally earns revenue based on the volume of transactions that take place in these products and would benefit by an increase in sales for these products.
The information contained herein is an opinion only, as of the date indicated, and should not be relied upon as the only important information available. Any prediction, projection or forecast on the economy, stock market, bond market or the economic trends of the markets is not necessarily indicative of the future or likely performance. The information contained herein is subject to change, incomplete, and may include information and/or data obtained from third party sources that iCapital believes, but does not guarantee, to be accurate. iCapital considers this third-party data reliable, but does not represent that it is accurate, complete and/or up to date, and it should not be relied on as such. iCapital makes no representation as to the accuracy or completeness of this material and accepts no liability for losses arising from the use of the material presented. No representation or warranty is made by iCapital as to the reasonableness or completeness of such forward-looking statements or to any other financial information contained herein.
Securities products and services are offered by iCapital Markets, an SEC-registered broker-dealer, member FINRA and SIPC, and an affiliate of iCapital, Inc. and Institutional Capital Network, Inc. These registrations and memberships in no way imply that the SEC, FINRA, or SIPC have endorsed any of the entities, products, or services discussed herein. Annuities and insurance services are provided by iCapital Annuities and Insurance Services LLC, an affiliate of iCapital, Inc. “iCapital” and “iCapital Network” are registered trademarks of Institutional Capital Network, Inc. Additional information is available upon request.
©2025 Institutional Capital Network, Inc. All Rights Reserved.


