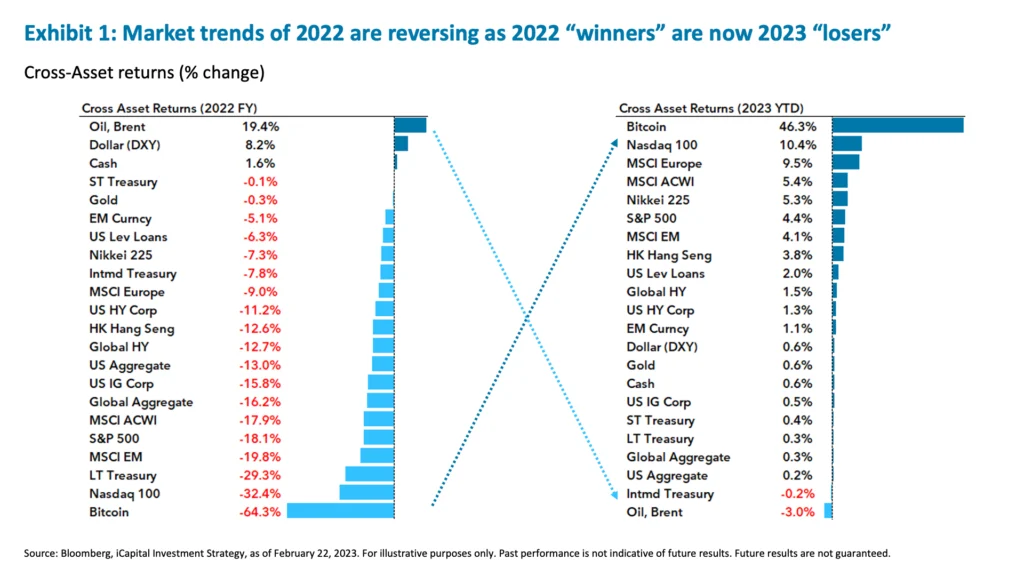
After a stellar rally to start the year, which was a complete reversal of 2022, the market was ripe for a pullback, as it reached overbought conditions. And given the extent of the recent rally, the build-up in positioning, and now key technical levels turning negative for systematic traders, there might be enough momentum to get the S&P 500 down to 3,900. But in our view, markets may defy near-term consensus calls for the aggressive drawdown as a result of a major mitigating factor – this economy can handle 5% rates without an imminent recession. We do admit that a potential policy re-think from the Fed regarding the next appropriate level of interest rates will likely cap the market upside (beyond 4,200) and, depending on how high the Fed ultimately plans to take the terminal rate, raises the probability of a hard landing risk later. For now, however, the S&P 500 may not have to reprice to the historical 13-14x recessionary multiple and can continue to oscillate around the 4,000 level.1
Why this economy can handle 5% rates
U.S. economic growth is proving to be resilient and consensus growth estimates are being revised higher. At the start of the year, consensus GDP growth for the first quarter of 2023 (Q1 ‘23) was expected to come in flat at 0%, but instead the Atlanta Fed GDPNow is currently tracking +2.5% GDP in Q1 ‘23 – a material upside surprise vs. initial consensus.2 This has come as the manufacturing sector seems to be troughing with ISM new orders picking back up, consumer confidence has begun to improve and retail sales saw a strong rebound last month – all of which bodes well for growth.3 But what about the lags in rising rates? In an interview this week St. Louis Fed’s James Bullard provided some re-assurance on that front saying that “this is the age of forward guidance and so the long and variable lags argument doesn’t make as much sense as it made decades ago,” suggesting that the lags are not that long and may already be felt by the economy. All of this suggests to us that this economy is taking 5% rates in stride.
But why is it that this economy can function with 5% rates? Here are some key reasons:
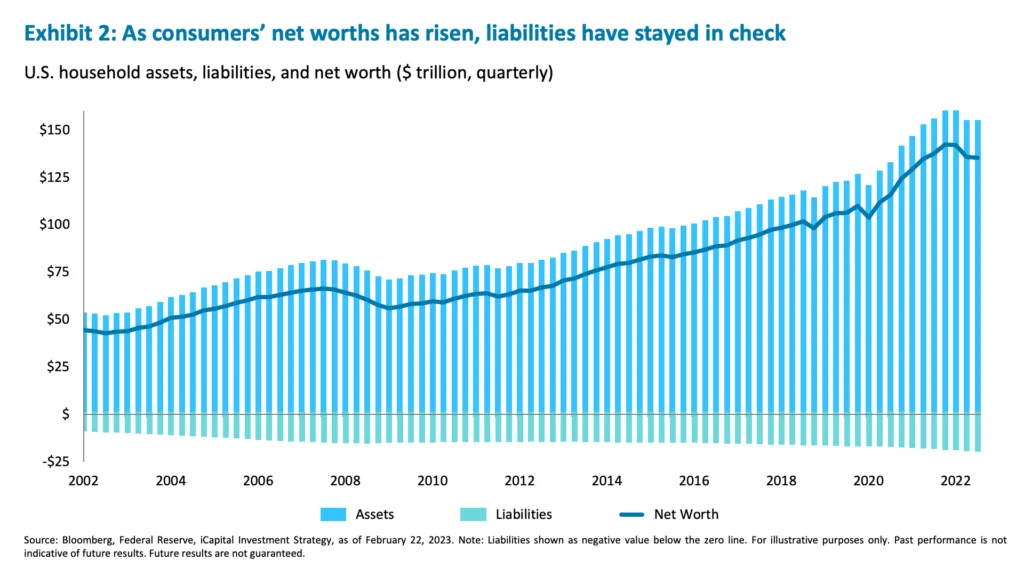
1. The consumer remains resilient and is benefitting from a solid labor market and higher rates. With the unemployment rate at a 55-year low of 3.4%, wage growth still running north of 4% at 4.4% year-on-year, and inflation continuing to ease, the real disposable income backdrop for consumers is supportive. For those receiving Social Security payments, the 8.7% cost-of-living adjustment (COLA) for 2023 payments was surely welcoming.4 And consumers’ net worth, despite the recent pullback in 2022, is still well above pre-pandemic levels – having risen from $110 trillion in the fourth quarter of 2019 to $135 trillion as of the third quarter of 2022 (Exhibit 2).5 In fact, consumers now hold $17.8 trillion of their assets in cash and cash equivalents, meaning that their interest income on those assets is set to rise from $456 billion in the third quarter of 2022 to $816 billion today – a staggering change from the mere $14.2 billion received in interest income in the fourth quarter of 2021.6 Finally, while assets rose, consumer liabilities have stayed in check, with liabilities as a percentage of disposable income actually falling from 125% to 100% today.7
 2. Corporates have healthy balance sheets and have limited debt exposure to higher rates. As we wrote here, the credit fundamentals of high-yield companies have improved over the years.8 The same is true for investment grade (IG).9 And most of the S&P 500 companies are not financed with floating rate debt – in fact, only about 25% of S&P 500 companies have floating rate debt.10 Corporates have also amassed large cash balances of roughly $8 trillion and, similar to consumers, are seeing a 58x factor return on those balances.11 Finally, while corporate net profit margins are down from the pandemic peak, they are still above pre-pandemic levels and are expected to improve higher as companies right-size their cost structures.12
3. A large chunk of infrastructure stimulus is still in the pipeline and will add to economic growth. Recall that over the last two years, the U.S. Congress passed the Infrastructure Investment and Jobs Act (IIJA), the Inflation Reduction Act (IRA), and the CHIPS Act, which together aims to invest nearly $1.5 trillion across the transportation, energy, and semiconductor sectors over the next five to ten years.13 Given this long tail with stimulus being injected into the economy over the next decade, the economy should benefit from near-term GDP growth. In fact, just the Infrastructure Investment and Jobs Act alone is expected to raise GDP growth by a cumulative 3.5% through 2031, and long-term GDP growth by 0.1% per annum.14 This stimulus may continue incrementally to support construction and manufacturing demand.
The improved economic backdrop may challenge the return to the Fed’s 2% inflation target, but we see scope for this renewed economic strength to be constructive for markets for two reasons: First, if the economy stays out of a recession, we may not need to price in a recessionary multiple of 13-14x on the S&P 500, and 17-18x, which is where we stand today, could hold under a soft landing/no landing scenario.15 And second, with 2023 S&P 500 earnings estimates having already been downgraded by 10.5% since the middle of 2022, there could be scope for upside surprises to consensus earnings estimates and/or at least fewer downgrades (Exhibit 3).16
The Fed’s re-think of terminal rates may ultimately upset the fragile balance
The markets have been able to digest stronger economic data quite well this year, all while pricing in additional rate hikes, due in part to central banks moving to a more incremental rate-hiking policy of 25 bps. Having to pencil in an additional three, or even four, 25 bps hikes, versus the initially anticipated two, is not that much for markets to absorb. And the market-implied terminal rate on the fed funds rate is now 5.3%, somewhat, but not materially, higher than 4.9% where it was a few weeks ago.17 However, the risk is that this incremental and predictable rate-hiking policy changes, the Fed has a measurable re-think of their policy, and potentially goes back to 50-75 bps hiking increments or moves the terminal rate to 6% and beyond.18 This, in our view, could ultimately trigger a hard-landing scenario, or at least more of a meaningful market correction.
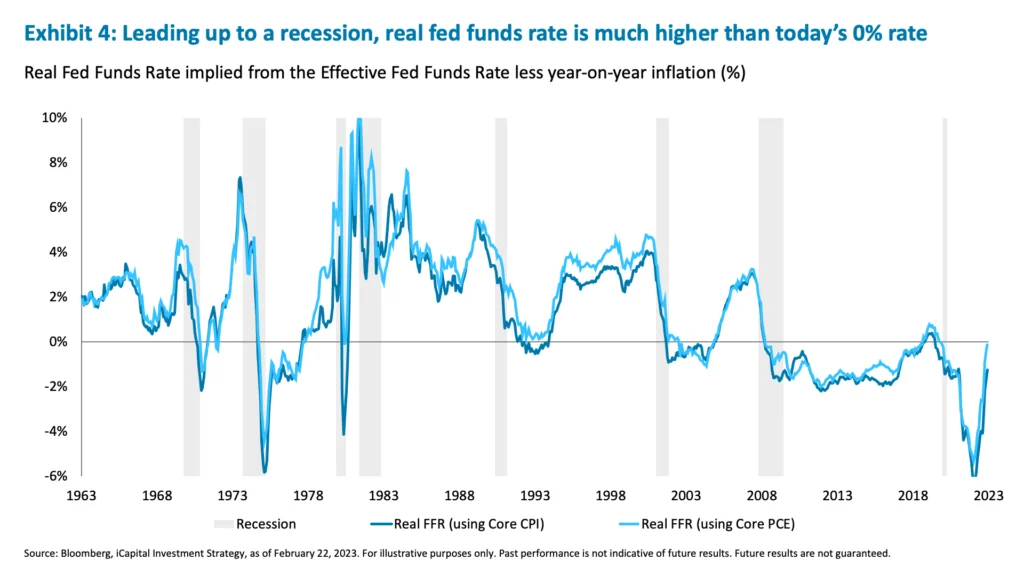
That said, depending on how hot incoming data is in March, the Fed’s re-think of the appropriate level of tightness (a rate beyond 5%) may come as soon as the March FOMC meeting when they release an updated Summary of Economic Projections (SEP). A few more higher-than-expected inflation prints and/or growth surprises may prompt central bank economists to revise growth and inflation higher than previously thought and as a result, prompt policymakers to re-think their newly adopted pace of 25 bps in favor of faster rate hikes again.19 Additionally, real fed fund rates have historically averaged around 5% leading up to a recession – a level much higher than the 0% real rate today.20 And we are clearly looking at a very different post-pandemic economy than a post-GFC economy, which could only handle 2% nominal rates.21 Also, 2% GDP growth is above potential, and the Fed has stated that they are aiming for a below potential GDP growth for a period of time to bring down inflation.22 All of these factors could contribute to a course correction.
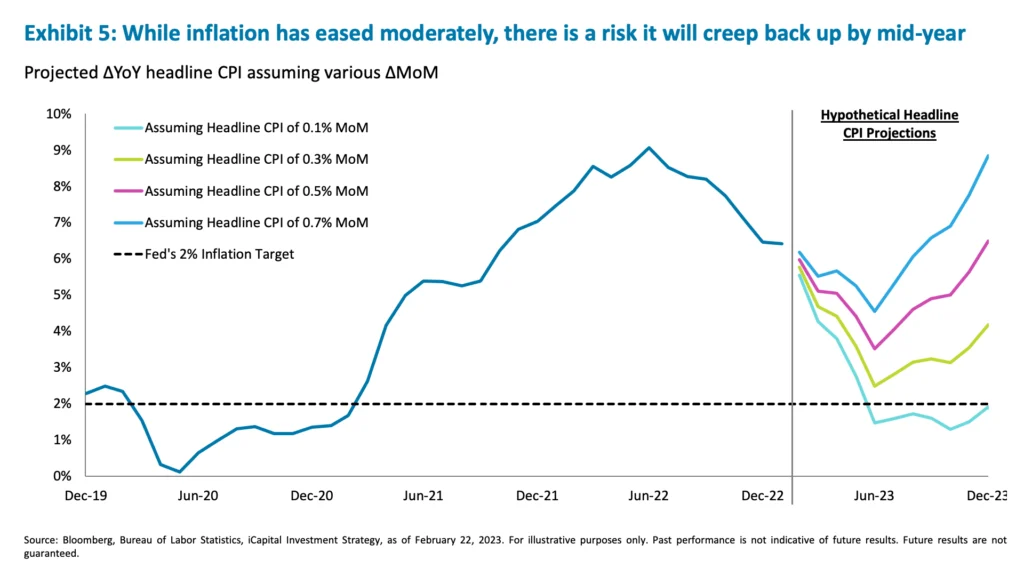
 Even if near-term inflation data cooperates and continues to ease, and the Fed sticks with its incremental rate hike policy for now, the re-think may still come in the second half of 2023 if the Fed looks further out to inflation projections. And at that point, there is a reasonable risk that inflation will start to creep back up again into the second half of the year. For example, if the monthly changes in CPI stay around current levels of +0.5% month-on-month, that is not good enough to bring inflation down to 2% (Exhibit 5).23 And importantly, year-on-year inflation may in fact start to head higher around mid-year once the inflation surge of the first half of 2022 falls out of the comparison and the second half of 2022 becomes the comp. Headline inflation peaked back in June of 2022, with first half of 2022 inflation running at a +13.1% annualized rate.24 In the second half of 2022, inflation annualized at +0.33%.25 But based on January’s print of +0.5%, the annualized increases might be stepping up again.26
 As a result, the odds are rising that this Fed re-think will happen at some point this year and will continue to clip the market’s wings. For that reason, in the near-term, we would be sellers of upside beyond the 4,200 level on S&P 500, acknowledging that our view is the market will likely continue to trade in a narrow range of 3,900-4,200 level in a no-landing scenario with ~5% rates; however, under a hard landing scenario, we could potentially move lower to 3,600 or below.
Our investment strategy is still a barbell of defensive and opportunistic
Given the expectation for a range-bound market (3,900-4,200 on the S&P 500) and Fed-related risks, we would be cautious not to chase the market at the top of the range and consider writing some covered calls or trimming positions in tech/unprofitable growth stocks that have run up a lot as of late. But as the markets approach the bottom of the range and technical conditions flip to oversold (we are not quite there yet), we would use the opportunity to dollar cost average into growth and rate-sensitive assets, such as semiconductors, software, clean energy, and REITs. Overall and beyond these tactical moves, our investment strategy is still focused on the following:
- Long cash, cash equivalents and investment grade bonds, which cheapened up the most across asset classes;
- Long private credit, which is still benefitting from rising Fed Funds rates; and
- Opportunistically add buyout private equity, opportunistic real estate, and macro hedge funds.
1. Bloomberg, iCapital Investment Strategy, as of February 22, 2023.
2. Bloomberg, iCapital Investment Strategy, as of February 22, 2023.
3. Bloomberg, iCapital Investment Strategy, as of February 22, 2023.
4. Social Security Administration, as of October 13, 2022.
5. Bloomberg, Federal Reserve, iCapital Investment Strategy, as of February 22, 2023.
6. Bloomberg, Federal Reserve, iCapital Investment Strategy, as of February 22, 2023. Note: Cash and cash equivalents include checkable deposits, short-term investments, and money market fund shares. To find interest income we multiplied the effective fed funds rate with the value of consumers’ cash and cash equivalents.
7. Bloomberg, Federal Reserve, iCapital Investment Strategy, as of February 22, 2023.
8. Bloomberg, S&P Global, LCD, iCapital Investment Strategy, as of February 22, 2023.
9. Bloomberg, S&P Global, LCD, iCapital Investment Strategy, as of February 22, 2023.
10. Bloomberg,
11. S&P Global Market Intelligence, as of July 15, 2022.
12. Bloomberg Intelligence, February 17, 2022.
13. Infrastructure Investment and Jobs Act as of November 15, 2021. Inflation Reduction Act, as of August 16, 2022. CHIPS and Science Act, as of August 9, 2022.
14. Moody’s Analytics, Cushman & Wakefield, iCapital Investment Strategy, as of August 21, 2021.
15. Bloomberg, iCapital Investment Strategy, as of February 22, 2023
16. FactSet Earnings Insight, iCapital Investment Strategy, as of February 27, 2023
17. Bloomberg, iCapital Investment Strategy, as of February 22, 2023
18. Bloomberg, iCapital Investment Strategy, as of February 22, 2023
19. Bloomberg, iCapital Investment Strategy, as of February 22, 2023
20. Bloomberg, iCapital Investment Strategy, as of February 22, 2023
21. Bloomberg, iCapital Investment Strategy, as of February 22, 2023
22. Bloomberg, Federal Reserve, iCapital Investment Strategy, as of February 22, 2023
23. Bloomberg, iCapital Investment Strategy, as of February 22, 2023
24. Bloomberg, iCapital Investment Strategy, as of February 22, 2023
25. Bloomberg, iCapital Investment Strategy, as of February 22, 2023
26. Bloomberg, iCapital Investment Strategy, as of February 22, 2023
IMPORTANT INFORMATION
The material herein has been provided to you for informational purposes only by iCapital, Inc. (“iCapital”). This material is the property of iCapital and may not be shared without the written permission of iCapital. No part of this material may be reproduced in any form, or referred to in any other publication, without express written permission of iCapital.
This material is provided for informational purposes only and is not intended as, and may not be relied on in any manner as, legal, tax or investment advice, a recommendation, or as an offer to sell, a solicitation of an offer to purchase or a recommendation of any interest in any fund or security. You should consult your personal accounting, tax and legal advisors to understand the implications of any investment specific to your personal financial situation. This material does not intend to address the financial objectives, situation or specific needs of any individual investor. Alternative investments are complex, speculative investment vehicles and are not suitable for all investors.
The information contained herein is an opinion only, as of the date indicated, and should not be relied upon as the only important information available. Any prediction, projection or forecast on the economy, stock market, bond market or the economic trends of the markets is not necessarily indicative of the future or likely performance. The information contained herein is subject to change, incomplete, and may include information and/or data obtained from third party sources that iCapital believes, but does not guarantee, to be accurate. iCapital considers this third-party data reliable, but does not represent that it is accurate, complete and/or up to date, and it should not be relied on as such. iCapital makes no representation as to the accuracy or completeness of this material and accepts no liability for losses arising from the use of the material presented. No representation or warranty is made by iCapital as to the reasonableness or completeness of such forward-looking statements or to any other financial information contained herein.
Securities products and services are offered by iCapital Markets, an SEC-registered broker-dealer, member FINRA and SIPC, and an affiliate of iCapital, Inc. and Institutional Capital Network, Inc. These registrations and memberships in no way imply that the SEC, FINRA, or SIPC have endorsed any of the entities, products, or services discussed herein. Annuities and insurance services are provided by iCapital Annuities and Insurance Services LLC, an affiliate of iCapital, Inc. “iCapital” and “iCapital Network” are registered trademarks of Institutional Capital Network, Inc. Additional information is available upon request.
© 2023 Institutional Capital Network, Inc. All Rights Reserved.


