Amidst a highly volatile April, global equity markets have shown more stability following the Trump Administration’s 90-day tariff pause and lowering the reciprocal rate for all countries, excluding China. Despite this, there is still much uncertainty about the economic and earnings outlook. How should investors position for this challenging period? In this week’s commentary, we explore why the phrase “short-term pain for long-term gain” is starting to define the current U.S. economic policy backdrop, a phrase that investors may need to embrace in their portfolios as well.
Recession avoided for now, but markets may still have to endure some short-term pain
A disaster – that is a recession – may have been avoided for now, as the Trump Administration pared back the tariffs and ramped up certain exemptions. While the administration’s recent announcements suggest that it is open to negotiations – which could reduce the drag on growth and boost to inflation – their policies could still cause some “short-term pain.”
Indeed, Q2 ’25 is likely to be about adjusting to the reorientation of the domestic and global economy. Though the tariff pause announcement put a floor under sentiment, uncertainty still remains as sector tariffs (semiconductors, pharmaceuticals and critical minerals) could be implemented in the coming months. Furthermore, the impact of 10% universal and 145% China tariffs is likely to be felt and realized in Q2 and will likely squeeze both corporate margins and consumer wallets. Finally, the on/off trade negotiations can still rattle markets, especially when S&P 500 margins are expected to fall to 12.1%, which is down from 12.6% in the prior quarter.1
Despite the extreme bearish sentiment, however, consumers may continue to spend as they take advantage of the 90-day pause to “fast-track” their purchases of various electronics and cars. This was seen in the March retail sales data, where motor vehicle purchases contributed 1.0% of the 1.4% gain, or 75% of the total monthly increase.2
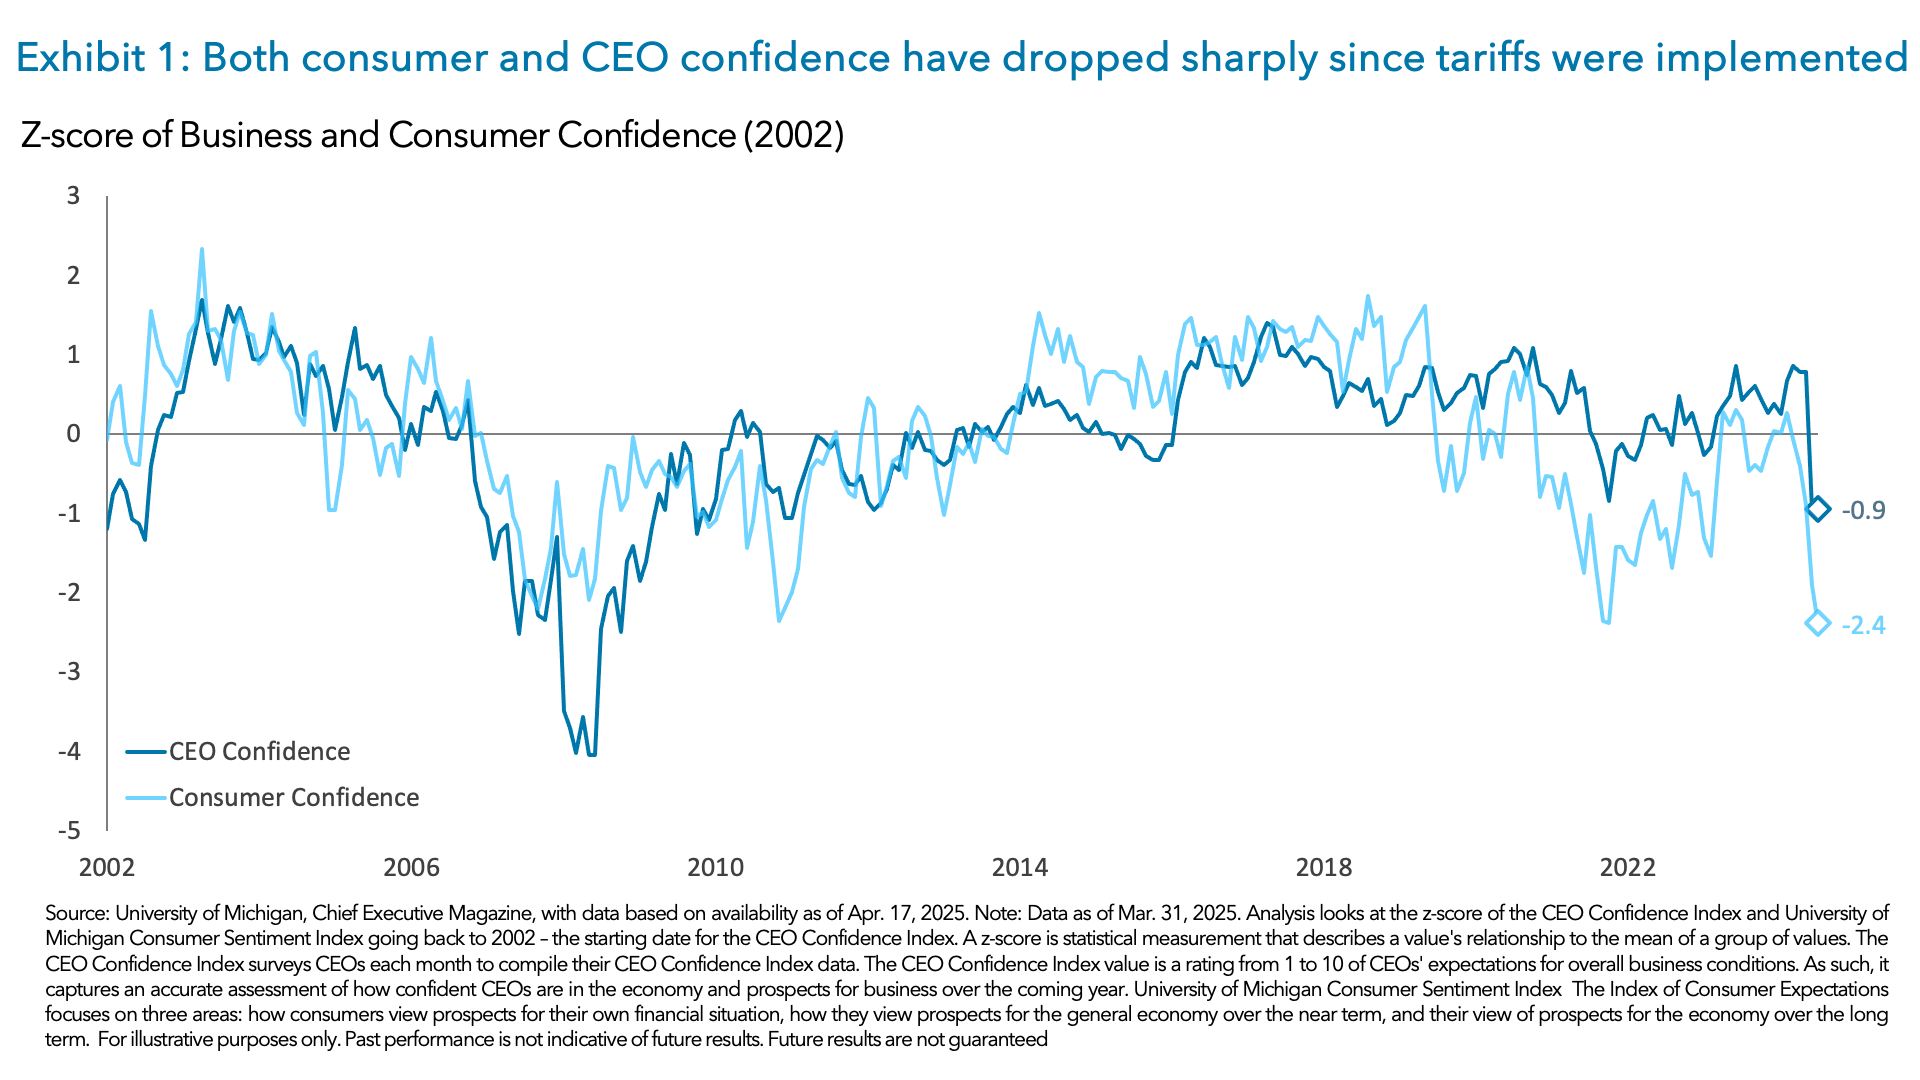
This behavior might provide some temporary relief to economic data and corporate earnings, but there will ultimately be a payback from this pull forward in demand. In addition, overall sentiment remains cautious and could weigh on hard data over the coming months. Indeed, consumer confidence has fallen to its lowest level since 19803 and CEO confidence to its lowest level since 2011.4
If we do start to see the weakness in soft-data bleed over into hard-data, markets will begin to worry about the rising risk of a recession – similar to what we saw in August of last year.
If recession odds rise, this could further pressure equity markets as the current peak-to-trough decline of -14.80% only implies about a 50% chance of a recession.5
This earnings season could offer some clues about how companies are responding to this period of adjustment
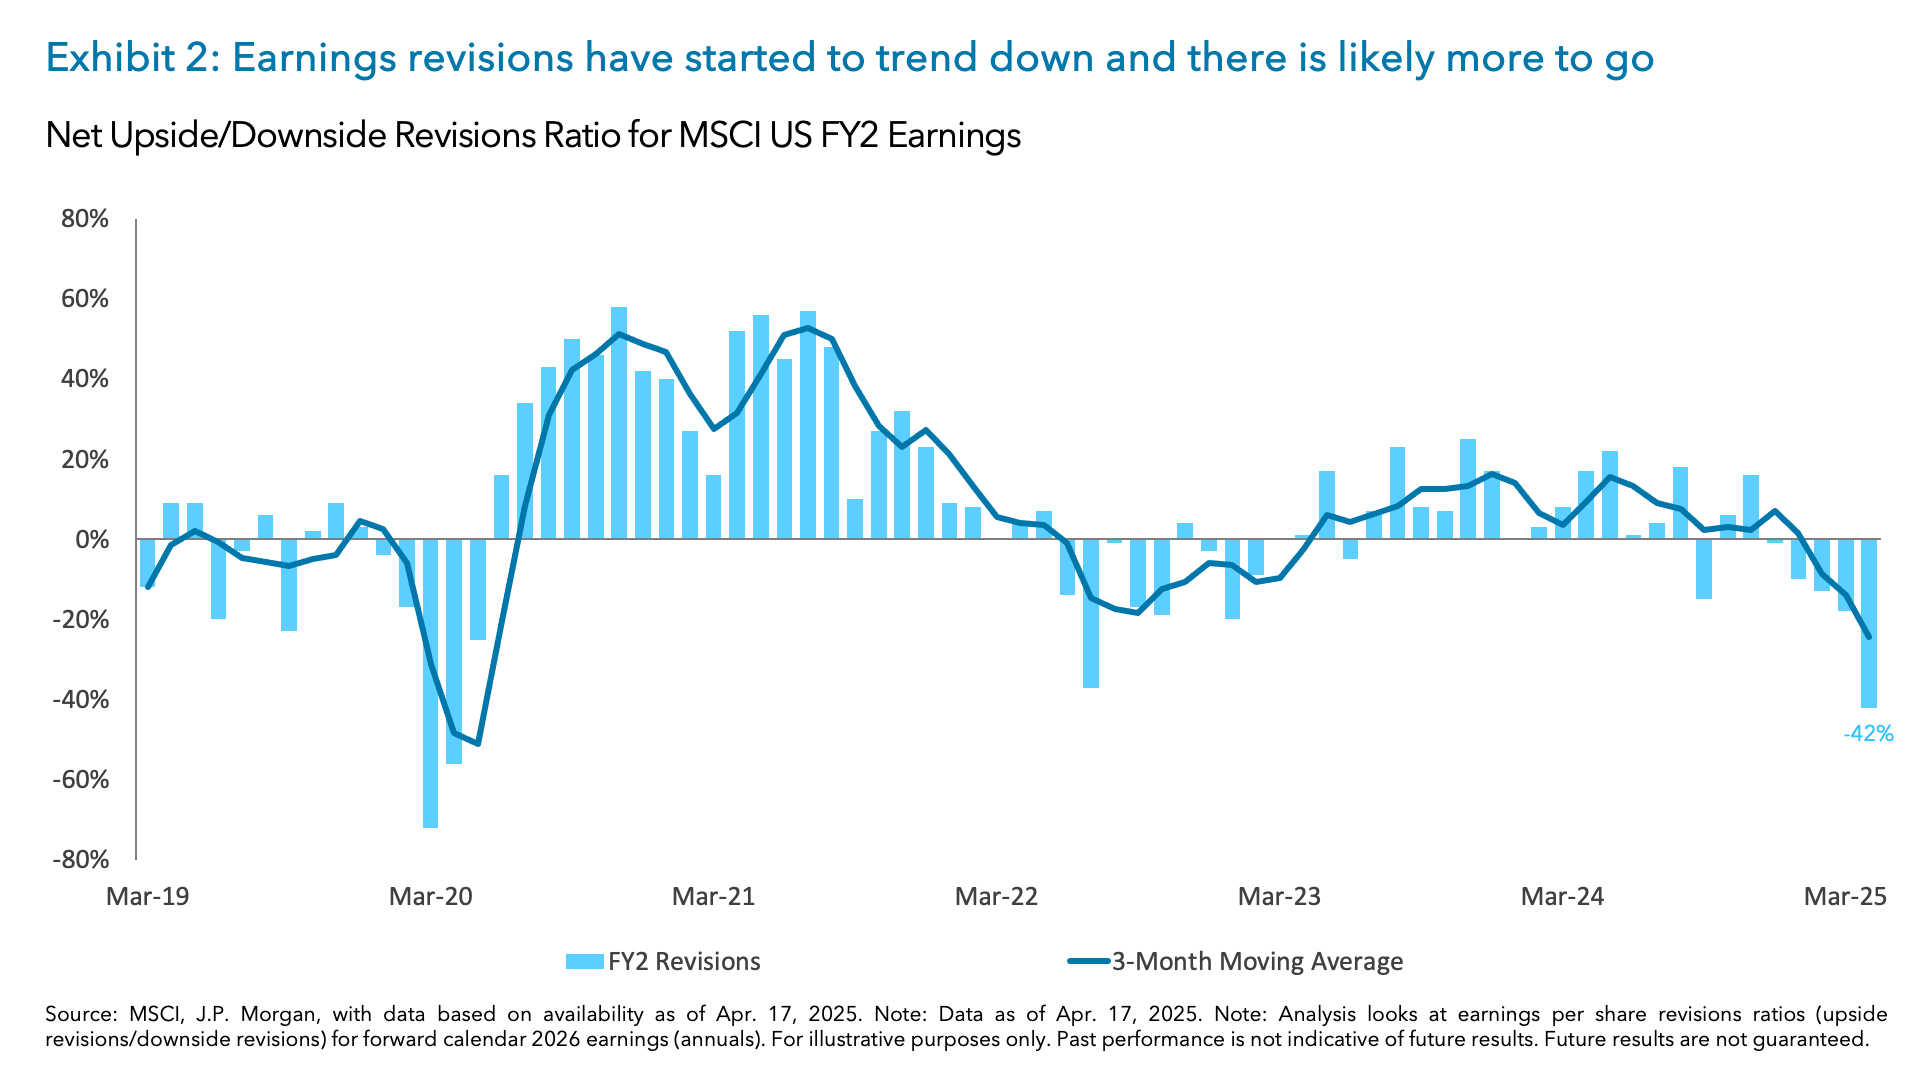
Earnings expectations have been trending lower, with 2025 EPS estimates cut -3.5% from their high.6 However, given the uncertainty about the economic outlook and how high proposed tariff rates will ultimately be, earnings could be adjusted lower by another -3% to -6%.7 Although the markets have priced this in to a large extent – the S&P is roughly -15% below its 52-week high8 – the environment of negative earnings revisions has historically tended to be a headwind for stocks.
Given this uncertainty, investors will be closely listening to companies to gain insights into how they are responding to this evolving environment – how companies are evaluating their supply chains, how companies are addressing cost increases and whether companies will reiterate their full-year guidance.
The last time we operated under this uncertain of an environment was Q1 2020, when 183 companies pulled their full year guidance.9 So far, only two companies have scraped their full year guidance.10 However, it will be interesting to see if more companies follow United Airlines, who recently issued two earnings scenarios – a stable environment and a recessionary environment.11 While this may not necessarily help reduce uncertainty, it may give markets more conviction in understanding and pricing in the full downside as it pertains to tariffs and weaker economic growth.
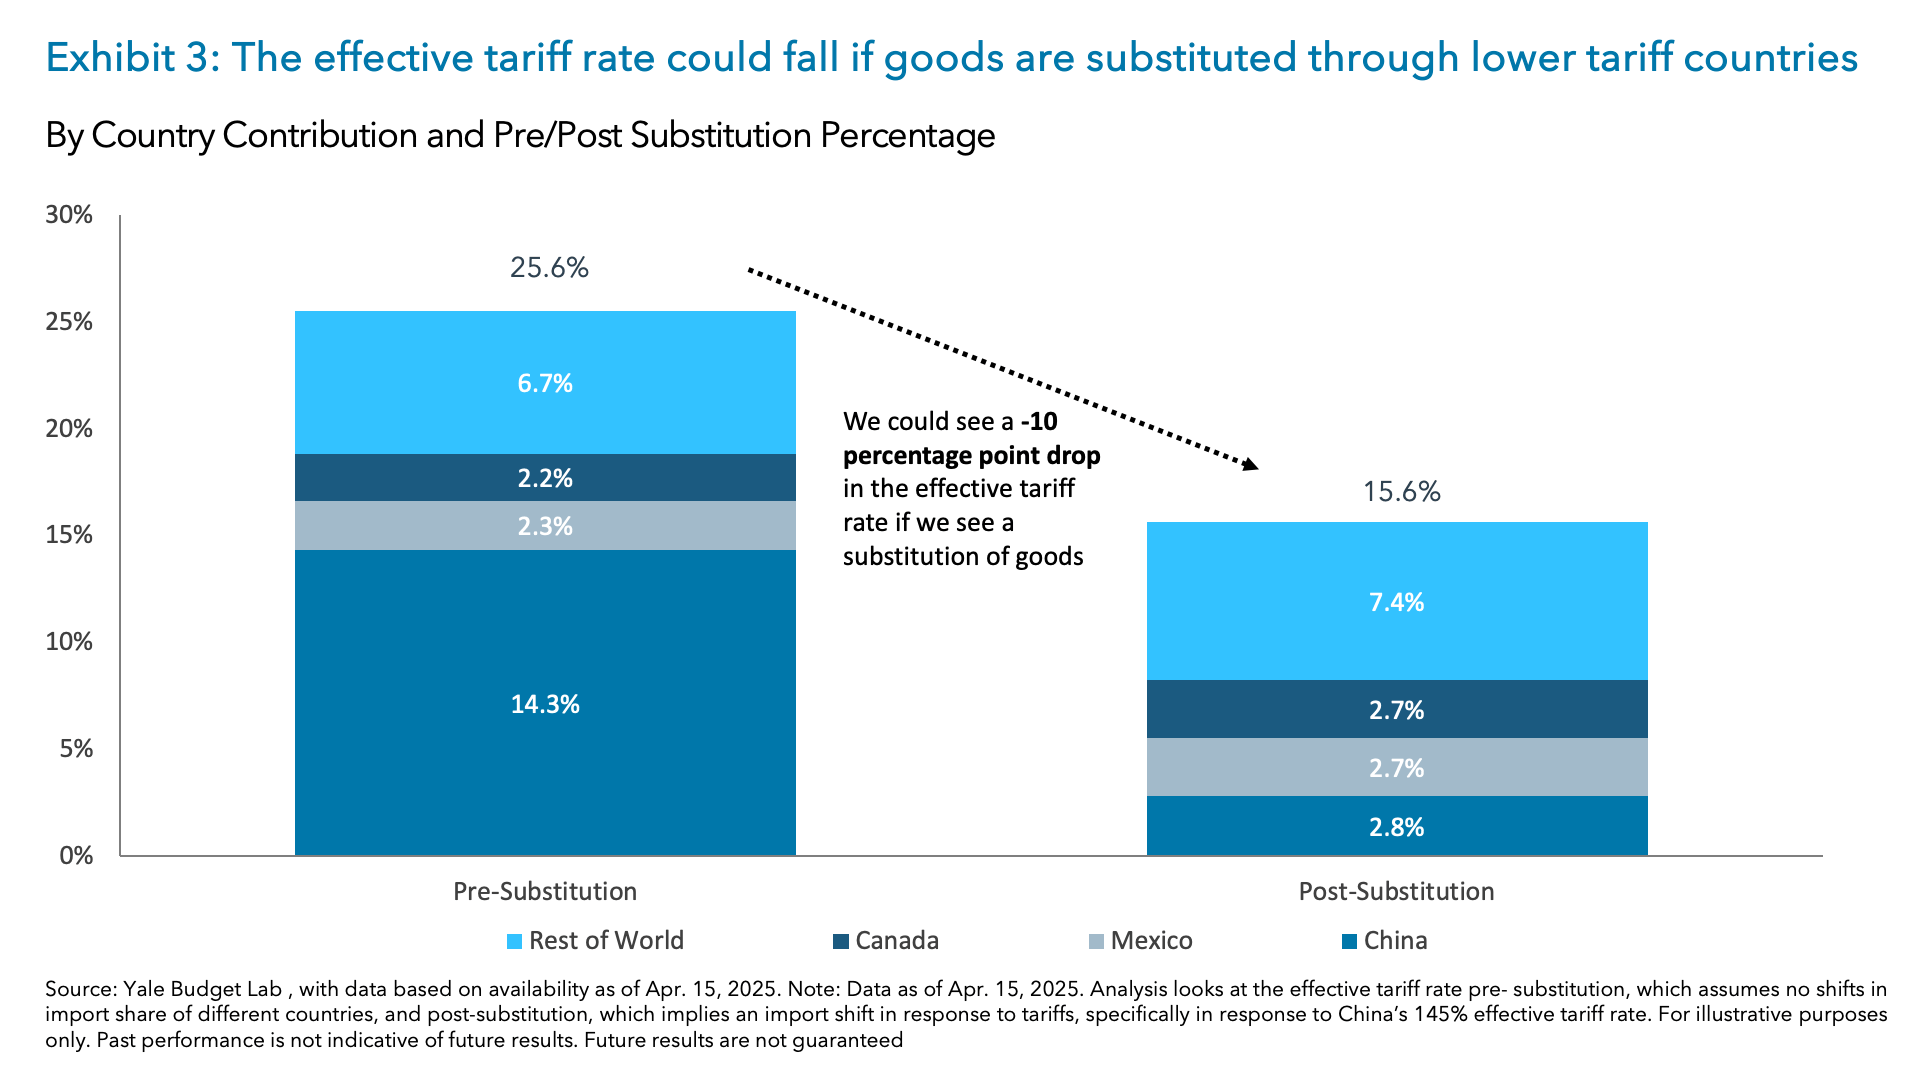
Another big focal point for investors will be how corporates might be substituting goods/imports from China to other countries with a lower tariff rate. To some extent, we think companies are prepared for this, as many of them have already diversified their supply chain after the first trade war and COVID. Based on estimates, if companies do substitute goods, this could lower the effective tariff rate to 15.6%, down from the estimated 25.6% rate pre-substitution.12
While we may not gain full clarity from companies this earnings season, investors will likely gain incremental information to help them assess the downside scenarios for certain sectors and companies.
Despite the uncertainty we believe there could be “long-term gains” from these policies and realignment
Beyond the short-term, the long-term objective of the Administration is to re-orient the U.S. economy to be more self-sufficient and grow the share of manufacturing that has dwindled over the years. With the key objective to boost production capacity in the U.S. – whether it is from domestic U.S. manufacturers or foreign multinationals selling products in the U.S. – this shift aims to create a more resilient economic framework able to withstand global uncertainties (such as COVID) and prioritizes investment in the U.S. If successful, the trade negotiations could also result in trade and no-trade barriers that are lower all around.
This strategy aims to attract significant investments into the U.S., both from domestic and international sources. In fact, the Trump Administration claims that they have already secured $3 trillion in private investment so far.13
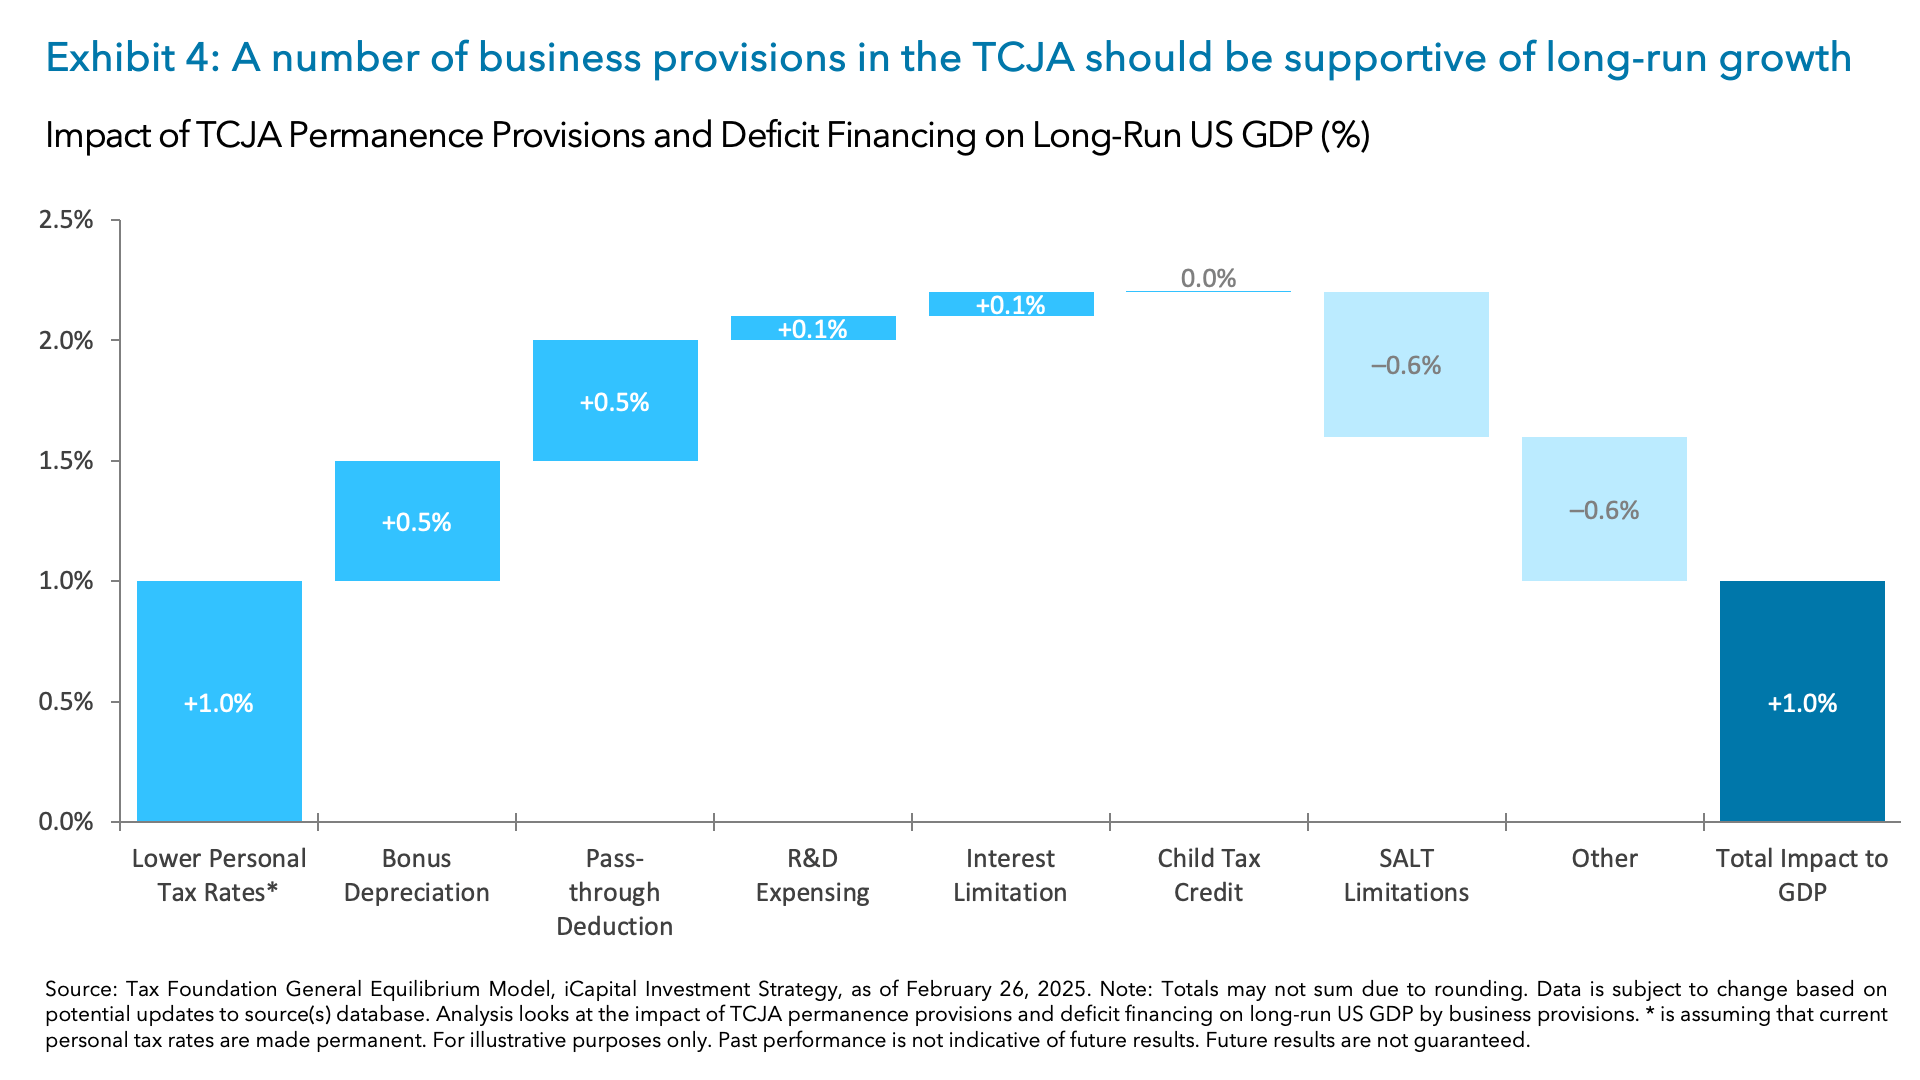
We also believe tax policy in the U.S. could help facilitate further investment. First, U.S. corporations pay a 21% corporate tax rate, which is below the average 24% rate for the OECD, which could also incentivize investment to come back to the U.S.14 Second, the extension of the Tax Cuts and Jobs Act (TCJA) could provide additional incentives. Currently, the Administration is looking to make items such as bonus depreciation, interest deductibility and the immediate expensing of R&D permanent, as well as expanding write-offs for building factories in the U.S.15 If these provisions are made permanent, they could support investments and boost long-run GDP growth by 0.7%, as seen in Exhibit 4.16
Given the budget that has been proposed by the House and amended by the Senate, we think there is the potential for other items, like write-offs for building factories, to be added to the bill – not just an extension of current law.
Investment Implications: a combination of a defensive and opportunistic approach
Similar to the Administration’s approach, we believe investors should be prepared for more short-term pain or at least market choppiness/uncertainty, while also focusing on the possibility of longer-term gain and clarity. In our view, this requires a combination of defensive and opportunistic investment. And we think it is important to think about portfolios in two ways – existing portfolios and long-term portfolios that have cash on the sidelines.
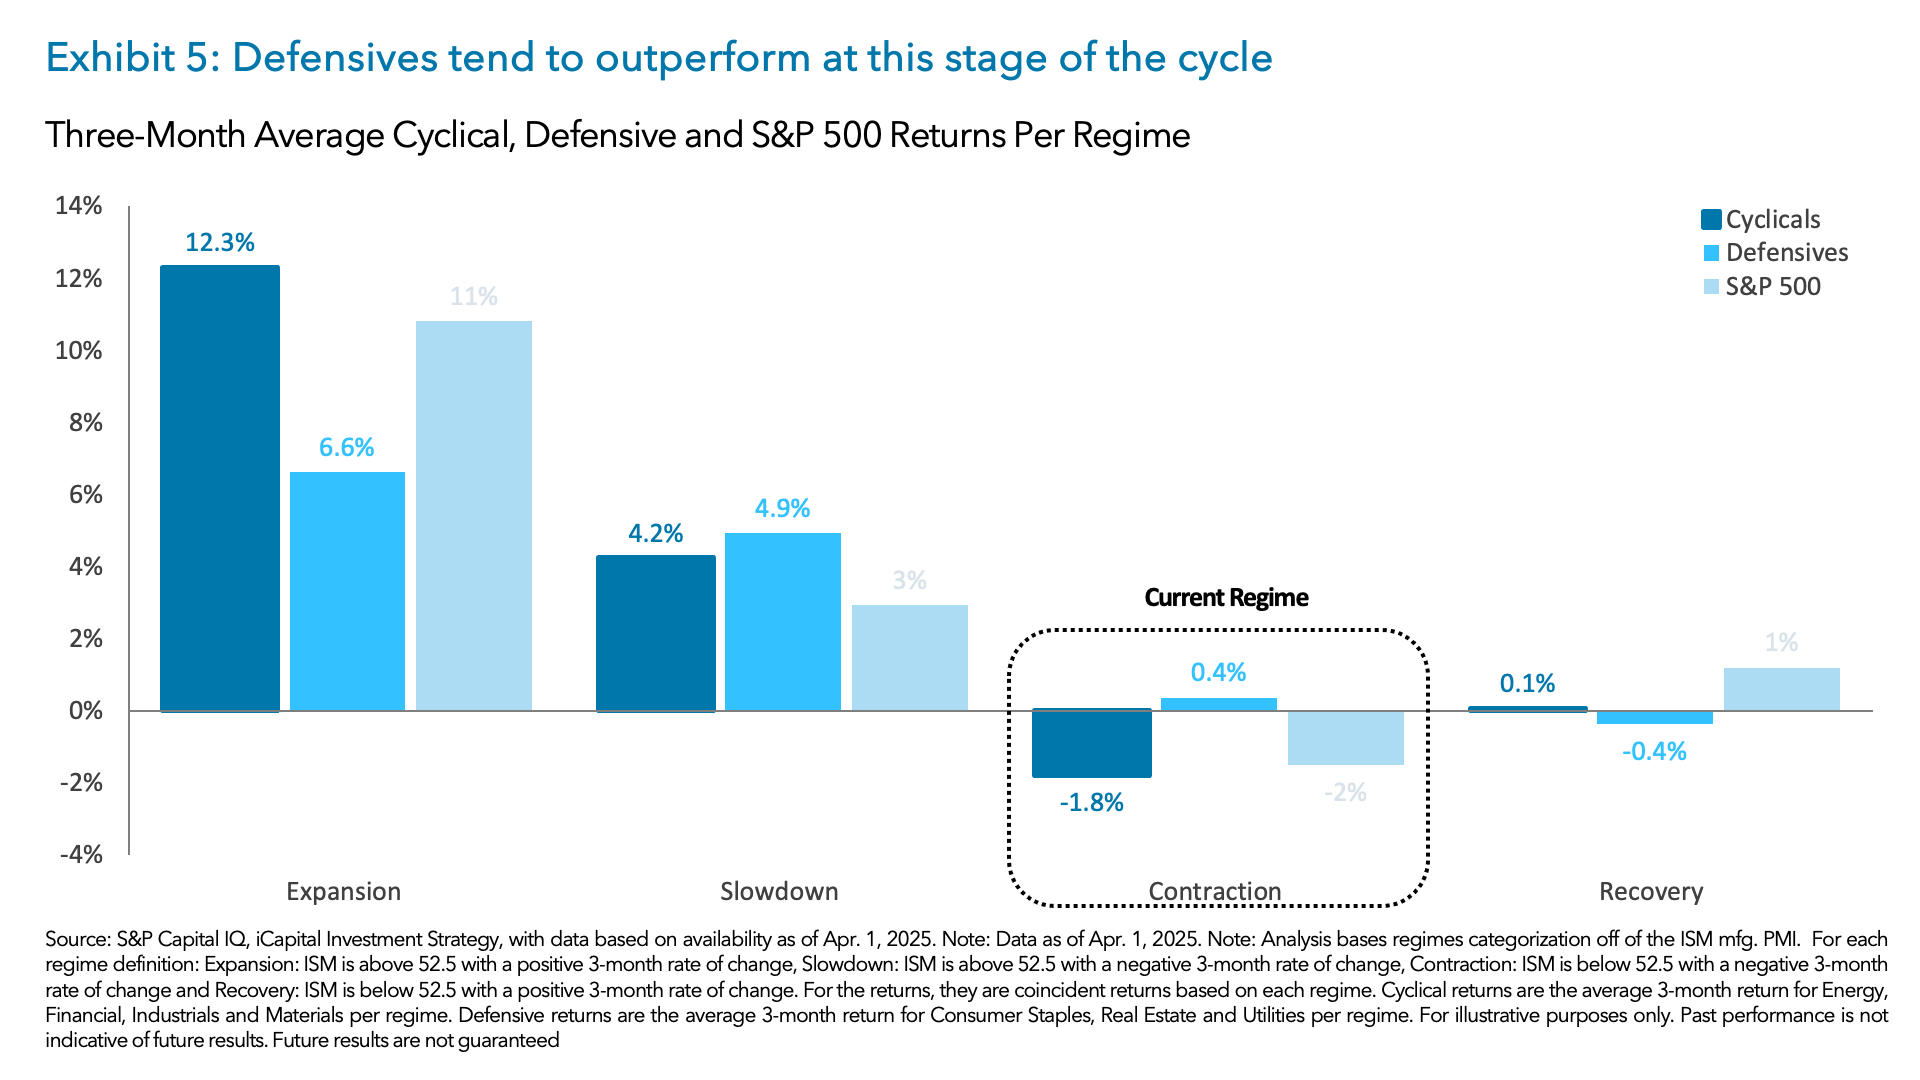
For existing portfolios, we continue to favor defensive and income-generating assets. Given the uncertainty that is expected in Q2 ’25, the potential for further fiscal restraint, and a Fed that remains on pause, we favor sectors such as staples and utilities, which tend to perform well during economic downturns, as seen in Exhibit 5. We would also look towards income generating assets, as one “gets paid to wait out the volatility” in public markets. Here, we favor high quality Private Credit and Real Estate, which can provide a steady stream of income and help mitigate the impact of market fluctuations.
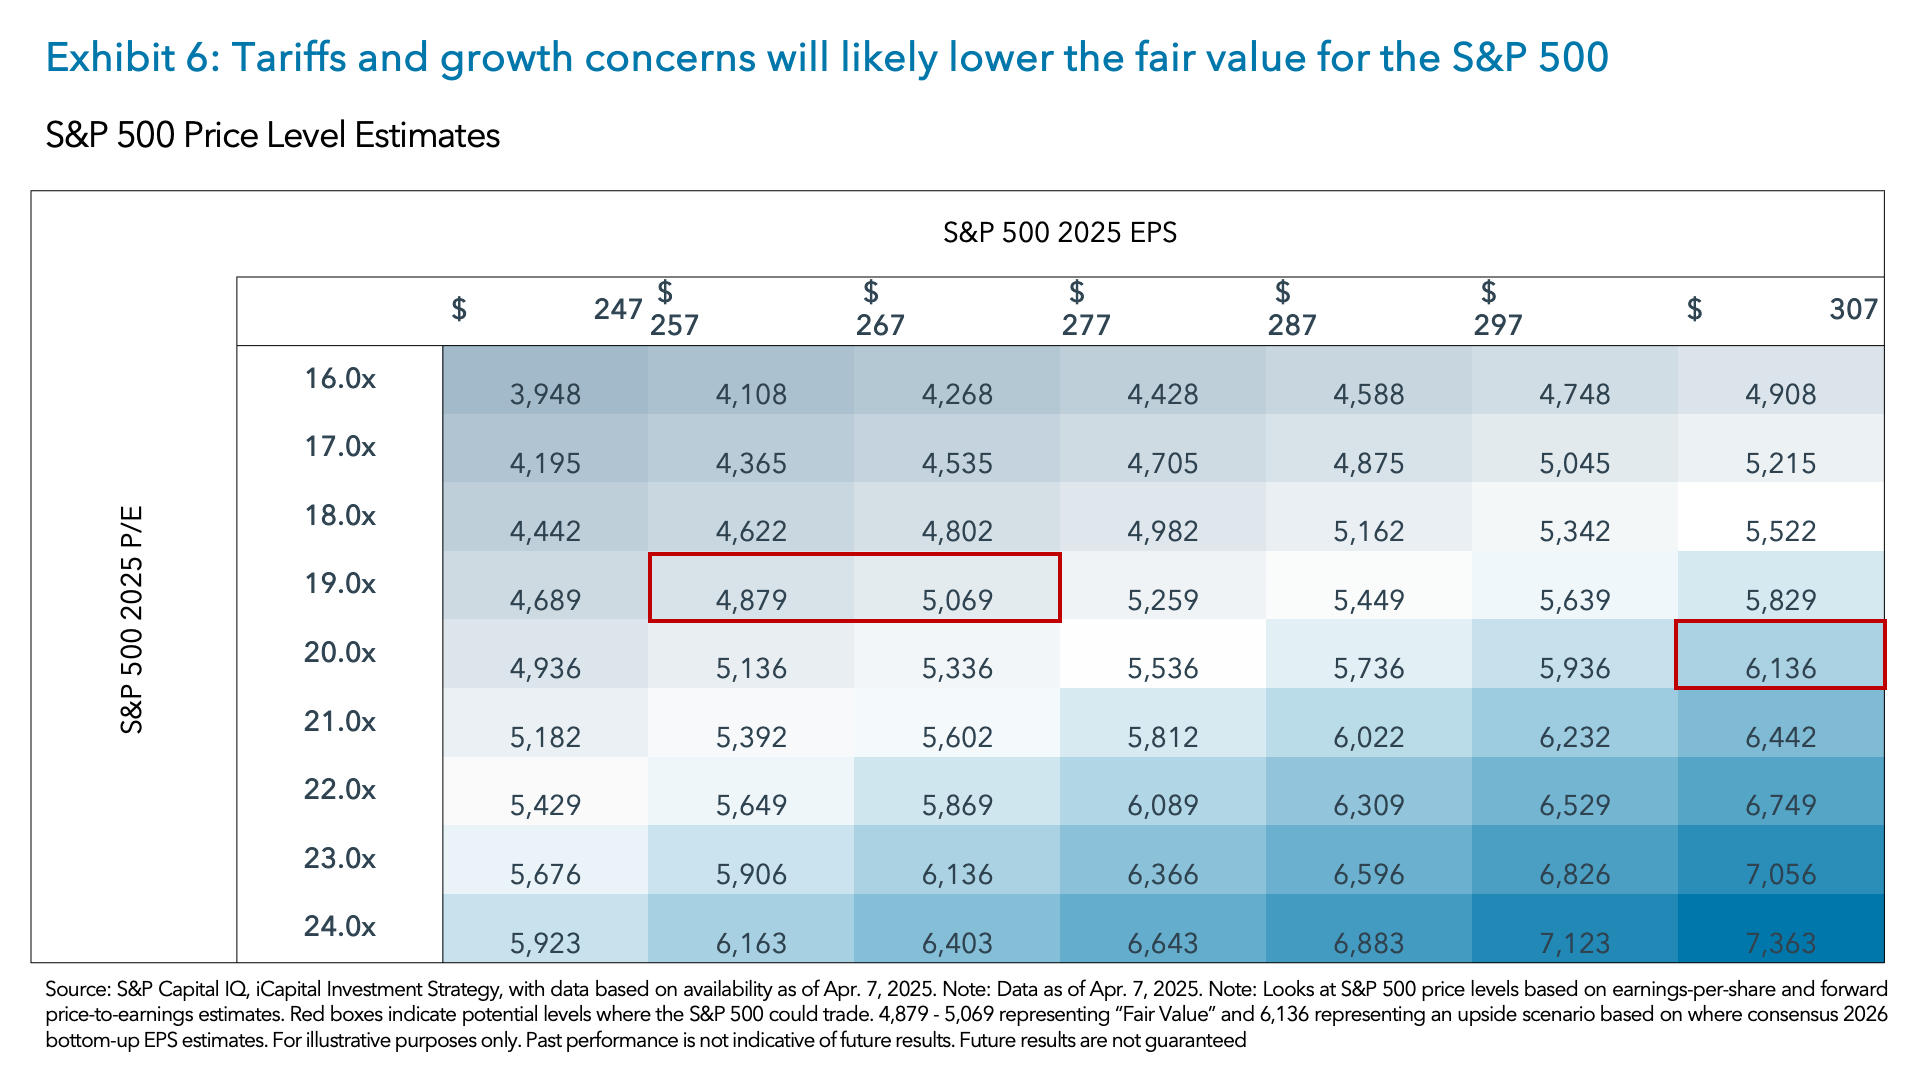
For longer-term portfolios that have cash, times like this have historically presented opportunities for investors. Today, the “fair value” on the S&P 500 is somewhere around 4,800-5,000 given what we currently know about tariffs. Assuming the 19x multiple holds and earnings adjust downwards by another ~5% to $257 (down from $267), the fair value is around 4,800.17 This is also a level where the Trump Administration has started to make more market “friendly” announcements – possibly giving way to a “Trump Put.”
Barring any worse tariff news, long-term investors with cash may want to use this “period of adjustment” and gradually add to risk-assets at or around these levels. We also think these investors should favor structural themes that are set to benefit from the Administration’s push to onshore manufacturing production.
As the Administration looks to bring back manufacturing jobs to the U.S., the likely focus will be on “factories of the future” that make extensive use of automation and robotics, advanced 5G connectivity and “digital twin” software. Indeed, given the aging demographics in the U.S., we think robotics will become a more prevalent theme, not to mention it should be supported by the physical AI tailwind.
The bottom line is – this period of adjustment likely means short-term pain for – hopefully – long-term gain. And as the economic reset is unfolding in real time, investors can benefit from being prepared for the near-term volatility while also positioning for the longer-term gains.
1. FactSet, as of Apr. 11, 2025.
2. U.S. Census Bureau, as of Apr. 16, 2025.
3. University of Michigan, as of Apr.11, 2025.
4. Chief Executive Magazine, as of Mar. 2025.
5. S&P Capital IQ, iCapital Investment Strategy, as of Apr. 16, 2025.
6. FactSet, as of Apr. 11, 2025.
7. FactSet, iCapital Investment Strategy, as of Apr. 11, 2025.
8. S&P Capital IQ, as of Apr. 16, 2025.
9. FactSet, as of Apr. 16, 2025.
10. FactSet, as of Apr. 11, 2025.
11. United Airlines, as of Apr. 15, 2025.
12. Yale Budget Lab, as of Apr. 11, 2025.
13. The White House, as of Mar. 31, 2025.
14. OECD, as of Dec. 17, 2024.
15. Politico, as of Apr. 16, 2025.
16. Tax Foundation, as of Oct. 14, 2024.
17. S&P Capital IQ, iCapital Investment Strategy, as of Apr. 16, 2025.
INDEX DEFINITIONS
MSCI US Index: The MSCI USA Index is designed to measure the performance of the large and mid cap segments of the US market. With 576 constituents, the index covers approximately 85% of the free float-adjusted market capitalization in the US
S&P 500 Index: The S&P 500 is widely regarded as the best single gauge of large-cap U.S. equities. The index includes 500 of the top companies in leading industries of the U.S. economy and covers approximately 80% of available market capitalization.
S&P 500 Consumer Staples Index: The S&P 500® Consumer Staples comprises those companies included in the S&P 500 that are classified as members of the GICS® consumer staples sector.
S&P 500 Energy Index: The S&P 500® Energy comprises those companies included in the S&P 500 that are classified as members of the GICS® energy sector.
S&P 500 Financials Index: The S&P 500® Financials comprises those companies included in the S&P 500 that are classified as members of the GICS® financials sector.
S&P 500 Industrials Index: The S&P 500® Industrials comprises those companies included in the S&P 500 that are classified as members of the GICS® industrials sector.
S&P 500 Materials Index: The S&P 500® Materials comprises those companies included in the S&P 500 that are classified as members of the GICS® materials sector.
S&P 500 Real Estate Index: The S&P Real Estate Sector Index, part of the S&P 500, measures the performance of companies classified in the Global Industry Classification Standard (GICS) Real Estate sector, including real estate management and development, and REITs (excluding mortgage REITs).
S&P 500 Utilities Index: Standard and Poor's 500 Utilities Index is a capitalization -weighted index that tracks the performance of utility companies within the S&P 500, providing a view of energy, water, and electric service providers
IMPORTANT INFORMATION
The material herein has been provided to you for informational purposes only by Institutional Capital Network, Inc. (“iCapital Network”) or one of its affiliates (iCapital Network together with its affiliates, “iCapital”). This material is the property of iCapital and may not be shared without the written permission of iCapital. No part of this material may be reproduced in any form, or referred to in any other publication, without express written permission of iCapital.
This material is provided for informational purposes only and is not intended as, and may not be relied on in any manner as, legal, tax or investment advice, a recommendation, or as an offer or solicitation to buy or sell any security, financial product or instrument, or otherwise to participate in any particular trading strategy. This material does not intend to address the financial objectives, situation, or specific needs of any individual investor. You should consult your personal accounting, tax and legal advisors to understand the implications of any investment specific to your personal financial situation.
ALTERNATIVE INVESTMENTS ARE CONSIDERED COMPLEX PRODUCTS AND MAY NOT BE SUITABLE FOR ALL INVESTORS. Prospective investors should be aware that an investment in an alternative investment is speculative and involves a high degree of risk. Alternative Investments often engage in leveraging and other speculative investment practices that may increase the risk of investment loss; can be highly illiquid; may not be required to provide periodic pricing or valuation information to investors; may involve complex tax structures and delays in distributing important tax information; are not subject to the same regulatory requirements as mutual funds; and often charge high fees. There is no guarantee that an alternative investment will implement its investment strategy and/or achieve its objectives, generate profits, or avoid loss. An investment should only be considered by sophisticated investors who can afford to lose all or a substantial amount of their investment.
iCapital Markets LLC operates a platform that makes available financial products to financial professionals. In operating this platform, iCapital Markets LLC generally earns revenue based on the volume of transactions that take place in these products and would benefit by an increase in sales for these products.
The information contained herein is an opinion only, as of the date indicated, and should not be relied upon as the only important information available. Any prediction, projection or forecast on the economy, stock market, bond market or the economic trends of the markets is not necessarily indicative of the future or likely performance. The information contained herein is subject to change, incomplete, and may include information and/or data obtained from third party sources that iCapital believes, but does not guarantee, to be accurate. iCapital considers this third-party data reliable, but does not represent that it is accurate, complete and/or up to date, and it should not be relied on as such. iCapital makes no representation as to the accuracy or completeness of this material and accepts no liability for losses arising from the use of the material presented. No representation or warranty is made by iCapital as to the reasonableness or completeness of such forward-looking statements or to any other financial information contained herein.
Securities products and services are offered by iCapital Markets, an SEC-registered broker-dealer, member FINRA and SIPC, and an affiliate of iCapital, Inc. and Institutional Capital Network, Inc. These registrations and memberships in no way imply that the SEC, FINRA, or SIPC have endorsed any of the entities, products, or services discussed herein. Annuities and insurance services are provided by iCapital Annuities and Insurance Services LLC, an affiliate of iCapital, Inc. “iCapital” and “iCapital Network” are registered trademarks of Institutional Capital Network, Inc. Additional information is available upon request.
©2025 Institutional Capital Network, Inc. All Rights Reserved.


