With school back in session for many students in the U.S. and the fourth quarter around the corner, we felt like this was a perfect time to level set and examine the macro, policy and market landscape.
Growth has remained above its long-term historical trend of 2%, but has slowed from a year ago. This was highlighted by the September 5 jobs report, which came in well below consensus expectations. This has called into question the outlook for the labor market, where job gains have slowed to their slowest level since the pandemic.
But there are some tailwinds. The One Big Beautiful Bill Act (OBBBA) was passed and the Fed is expected to cut rates at their upcoming Federal Open Market Committee (FOMC) meeting after being on hold for all of this year. All these changes will likely have important implications for markets and asset class recommendations.
September is a historically weak month for markets. Indeed, the S&P 500 has had a -1.51% average return over the last 25 years. And while there are catalysts that could pressure markets, we believe pullbacks could be limited as both macro and micro fundamentals are supportive. Coupled with sentiment that is not overly stretched and plenty of cash remaining on the sidelines, we continue to believe that investors will look to buy dips.
As policy uncertainty continues to abate, this should support various asset classes across both public and private markets. Specifically in private markets we would be favoring middle market buyout, lower middle market direct lending and infrastructure. While in public markets we would be favoring financials, industrials and rate sensitive areas such as homebuilders.
Wake Me Up When September Ends
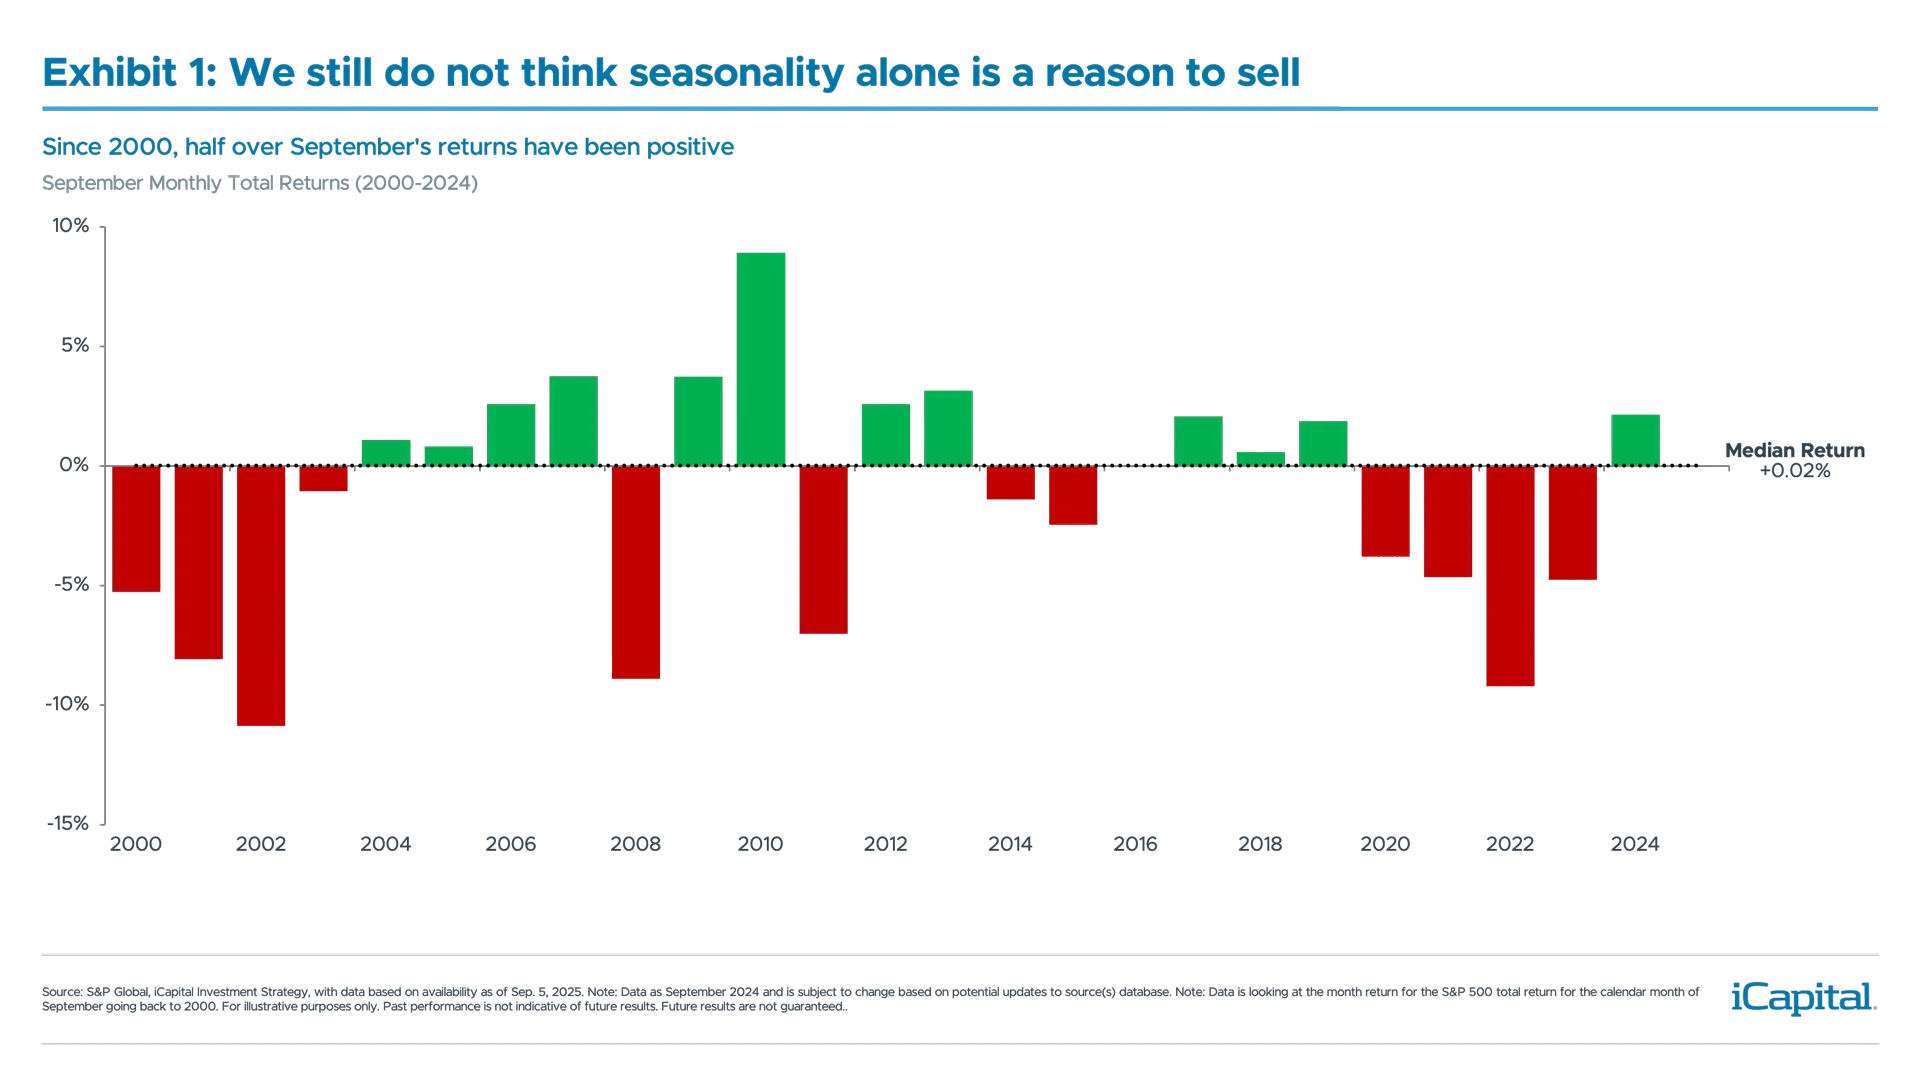
September is historically the weakest month for the S&P 500, as it has produced an average return of -1.51% over the last 25 years (Exhibit 1). Yet, as we noted in our September 2024 Market Pulse, seasonals are not always a good reason to sell. If you look at the last 24 Septembers (back to 2000), 12 of those observations have been positive. Therefore, the median September return for the S&P is closer to flat.
 While seasonal factors alone aren’t a reason to reduce exposure to risk assets, several headwinds could weigh on markets and sentiment—one of the most notable being rates. As we entered September, upward pressure on the long end of the curve emerged, driven by fiscal concerns in the United Kingdom, France, and even the United States.
From a U.S. perspective, the recent court ruling deemed tariffs under the International Emergency Economic Powers Act (IEEPA) illegal, which has raised questions about whether previously collected duties will need to be refunded. This could worsen the deficit outlook, as tariff revenue was expected to partially offset the cost of the OBBBA, potentially adding further upward pressure on yields.
If this leads to a sharp rise in yields, it could begin to weigh on markets. According to analysis from Goldman Sachs, a two standard deviation increase in the U.S. 10-year Treasury yield has historically coincided with a ~5% decline in the S&P 500. Such a move would push the 10-year yield to around 4.80%, near its year-to-date (YTD) high.
That said, we continue to expect the 10-year yield to remain within a range of 4.00% to 4.50%. Additionally, current fair value estimates for the 10-year Treasury stand at approximately 4.175%, suggesting that any further upward pressure may be limited from current levels. Should the Fed signal a greater need for rate cuts, long-term yields could also decline. Historically, the 10-year yield has fallen a median of ~40 basis points (bps) in the 12 months following the start of a cutting cycle—though we will note that yields have actually risen ~60 bps since the Fed’s last cut in September 2024.
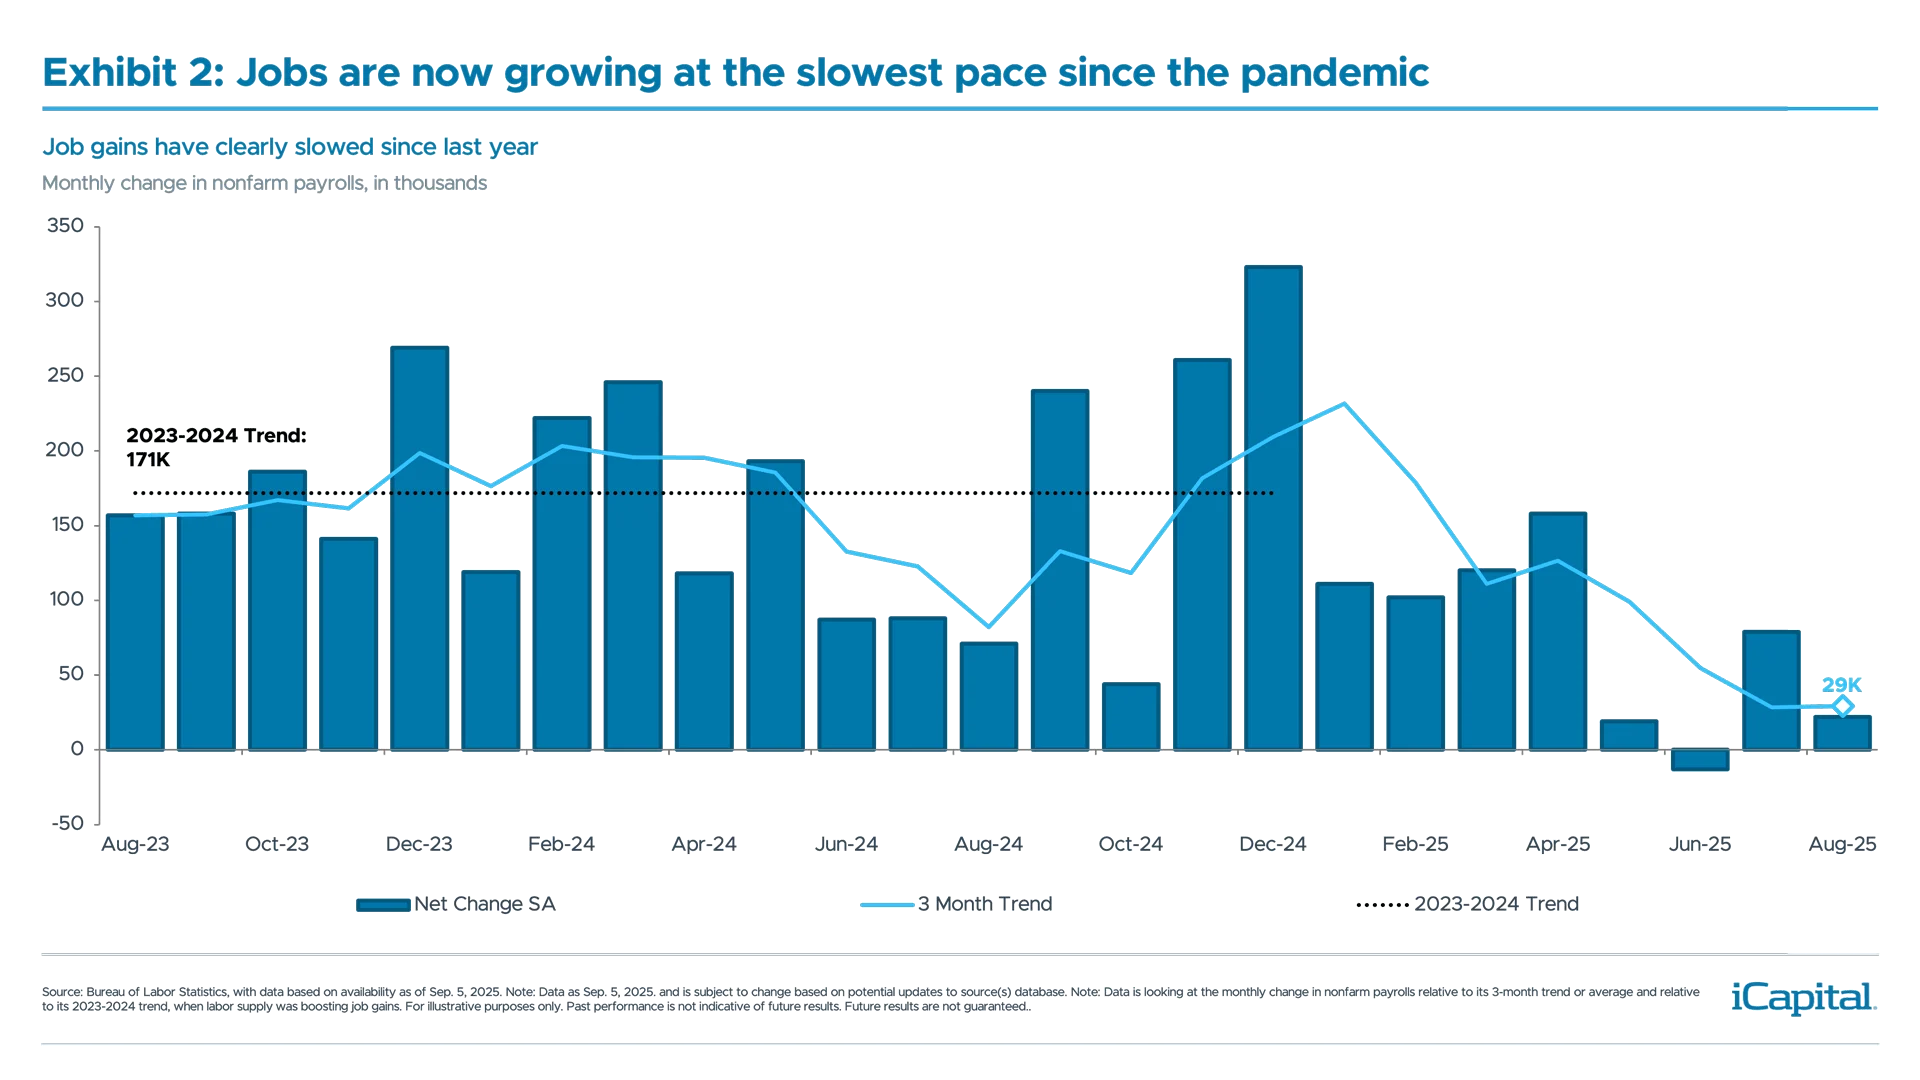
Another area drawing investor attention is the continued slowdown in labor market activity. While economic growth remains positive, the labor market has softened, with the 3-month trend rate of job gains now at just 29K – the slowest pace since the pandemic (Exhibit 2). The unemployment rate has also edged higher, now at 4.3%, just 20bps below the Fed’s median year-end estimate for 2025.
Although high-frequency indicators and initial claims data still suggest some underlying strength, this trend warrants close monitoring. Historically, once the unemployment rate begins to rise, it tends not to reverse this trend—a dynamic captured by the Sahm Rule.
Throughout September, investors will be closely watching QCEW revisions, weekly claims, and labor-related components in consumer confidence data to better assess the trajectory of the labor market.
 Four Factors That Should Keep Pullbacks Limited
While a sharp rise in yields and further weakness in the labor market could weigh on markets, we see four factors that might keep any pullbacks limited.
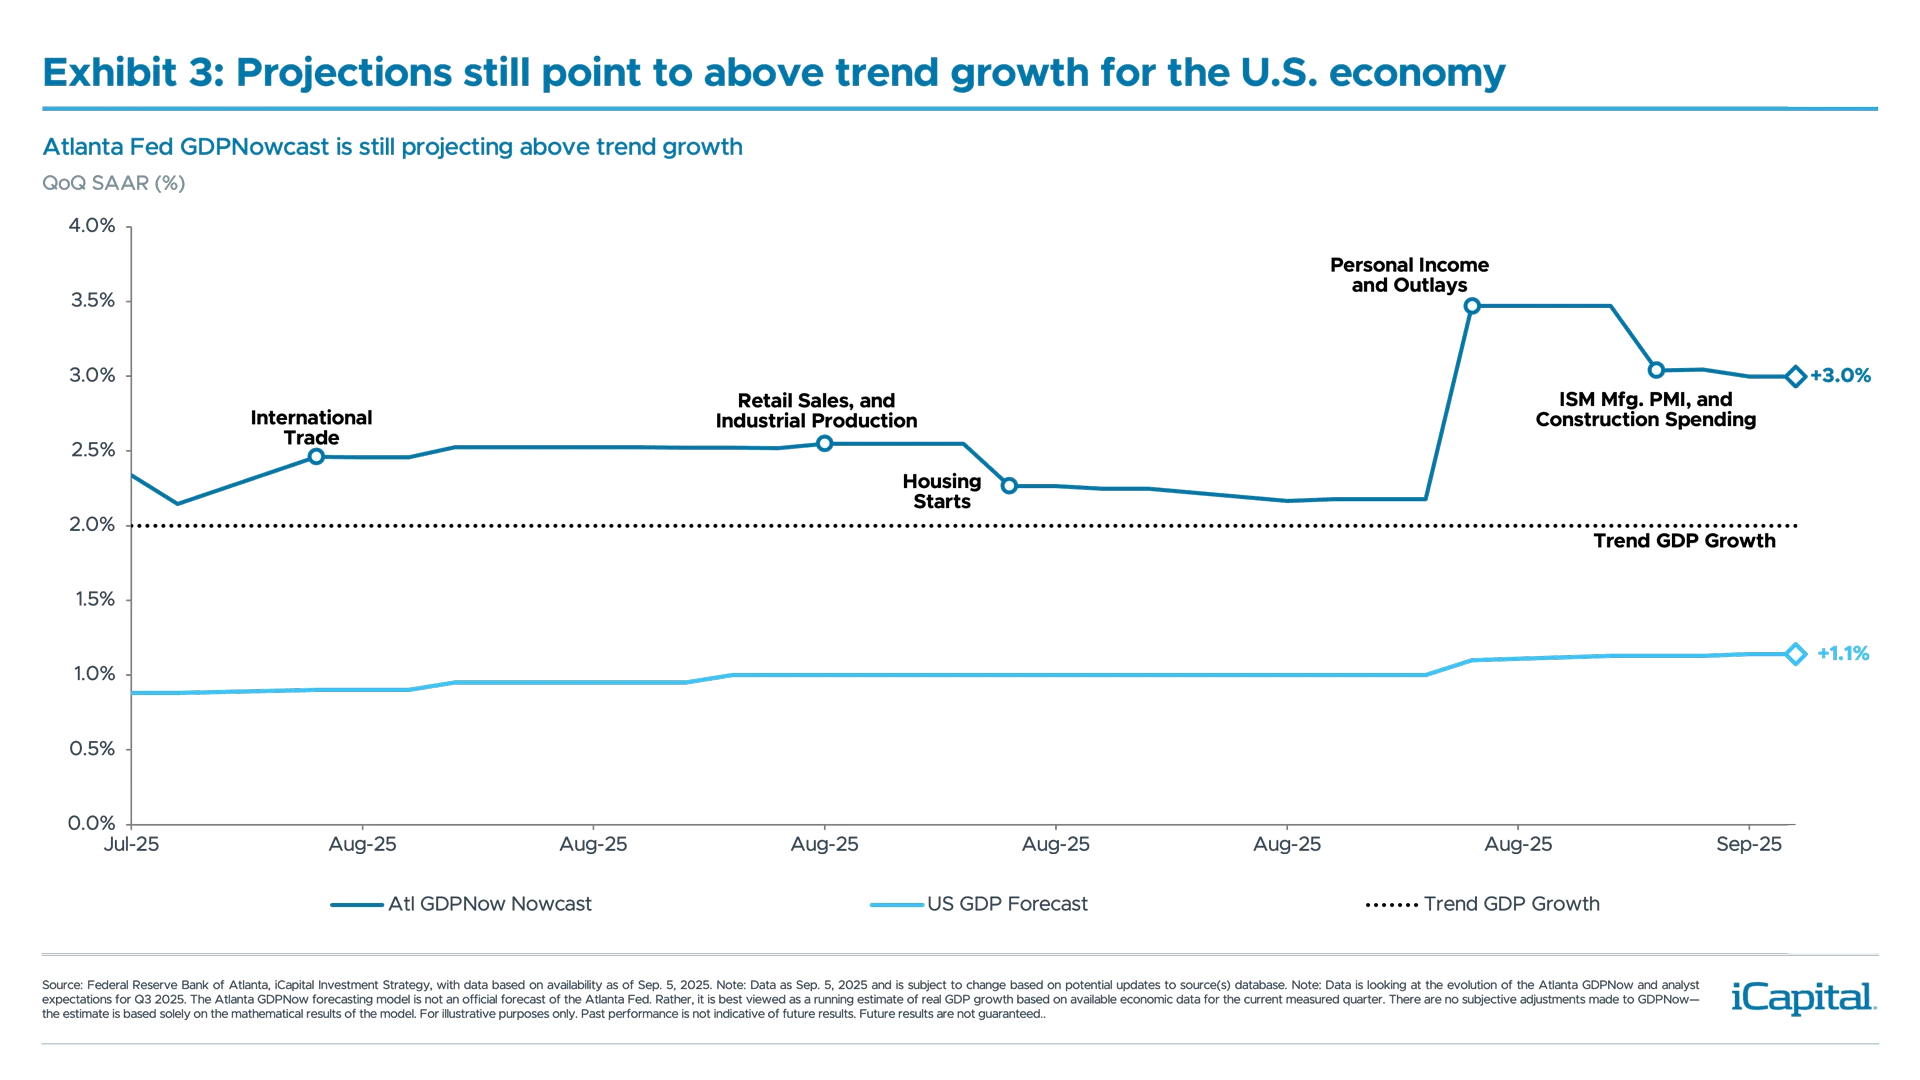
1. Growth remains resilient: Despite concerns about the economic outlook after the April 2025 liberation day announcement, growth has exceeded expectations, as highlighted with the Citi Economic Surprise Index reaching a YTD high. There are signs that this resilience may continue as the Atlanta GDPNow is projecting 3.0% GDP growth in Q3 (Exhibit 3), and the improvement in leading indicators, such as the purchasing managers index (PMI), is also pointing to further upside for growth.
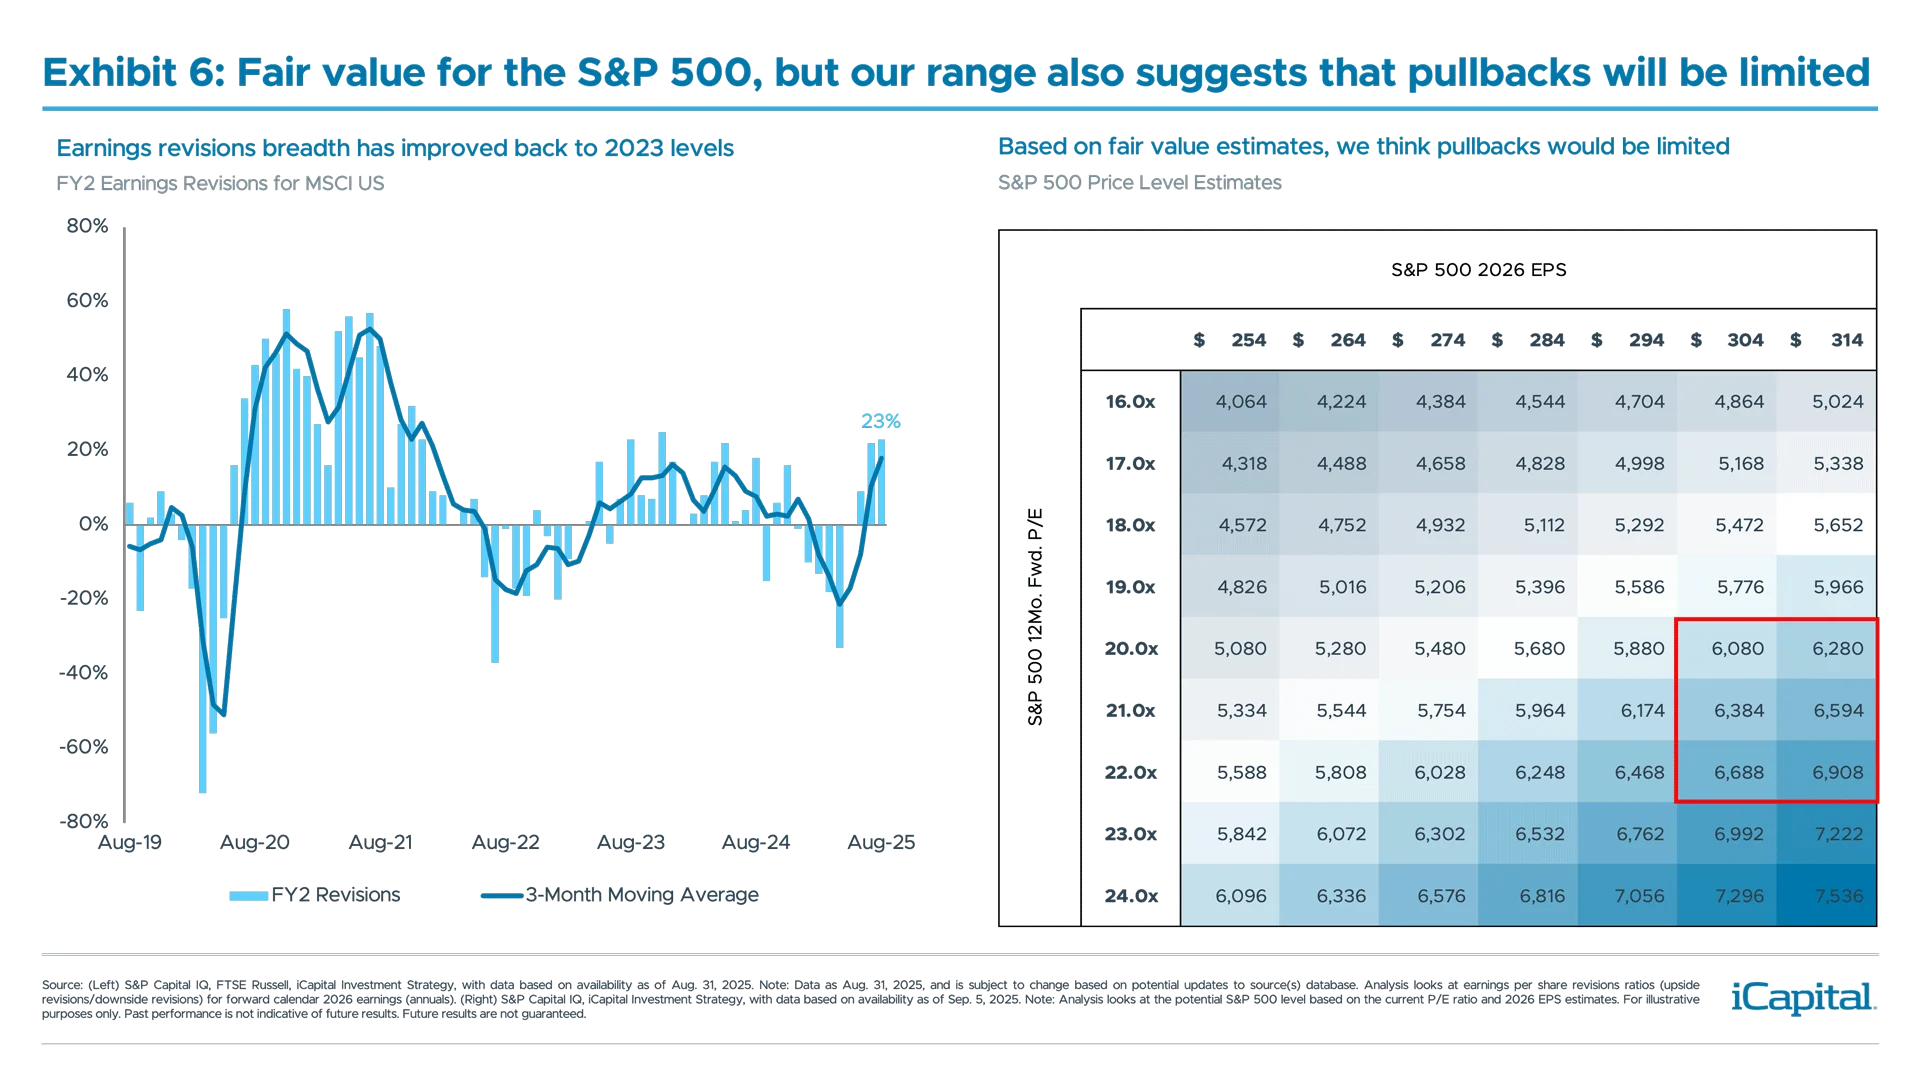
2. Earnings growth remains healthy: In the latest Q2 2025 reporting season, we continued to see corporates report profits come in above expectations, as we have now seen double-digit earnings growth over the last three quarters. The breadth of earnings beats was also quite strong as 81% of companies reported earnings that were above expectations—above the five-and10-year average. We would expect this trend to continue as earnings revisions have been moving higher and are now back to levels last seen in 2023.
3. Policy is supportive: Both monetary and fiscal policy should not only be a tailwind for the remainder of the year, but also through 2026. Indeed, the OBBBA is expected to boost growth by 0.1% this year, and by 0.5%-1.2% next year, based on estimates. In addition, with the Fed having cut rates by 100bps since last year, and expected to restart its cutting cycle in September, financial conditions have eased. Based on a Fed measure, these easier conditions are expected to boost growth by 0.45% over the next 12 months (Exhibit 4). All else equal, these tailwinds from policy should help support the economy grow at, or above, its trend rate.
4. Sentiment is not overly stretched: Even with markets trading around all-time highs, sentiment is far from euphoric. When looking at the American Association for Individual Investors (AAII), the number of bears is still outpacing the number of pulls. When looking over the last five years the spread between bulls and bears is in its 30th percentile – indicating that sentiment isn’t necessarily a headwind to markets.
An eye towards 2026 – themes we are focused on for the rest of the year
1. Private Assets in 401(k) Plans: President Trump’s executive order aiming to broaden 401(k) allocations to private markets could eventually unlock $800 billion to $2 trillion of new AUM, serving as a new source of capital for GPs. With $12.4 trillion in defined-contribution and 401(k) assets, much of the potential allocations are likely to flow through the $4 trillion target-date fund market. Given current private market offerings most suitable for 401(k)s, initial flows are likely to favor private credit and commercial real estate – largely through non-traded BDCs and REITs. However, there are still significant unknowns, particularly in regard to regulatory hurdles and adoption. Federal agencies including the Department of Labor have been directed to review existing guidance and propose safeguards by the start of February 2026.
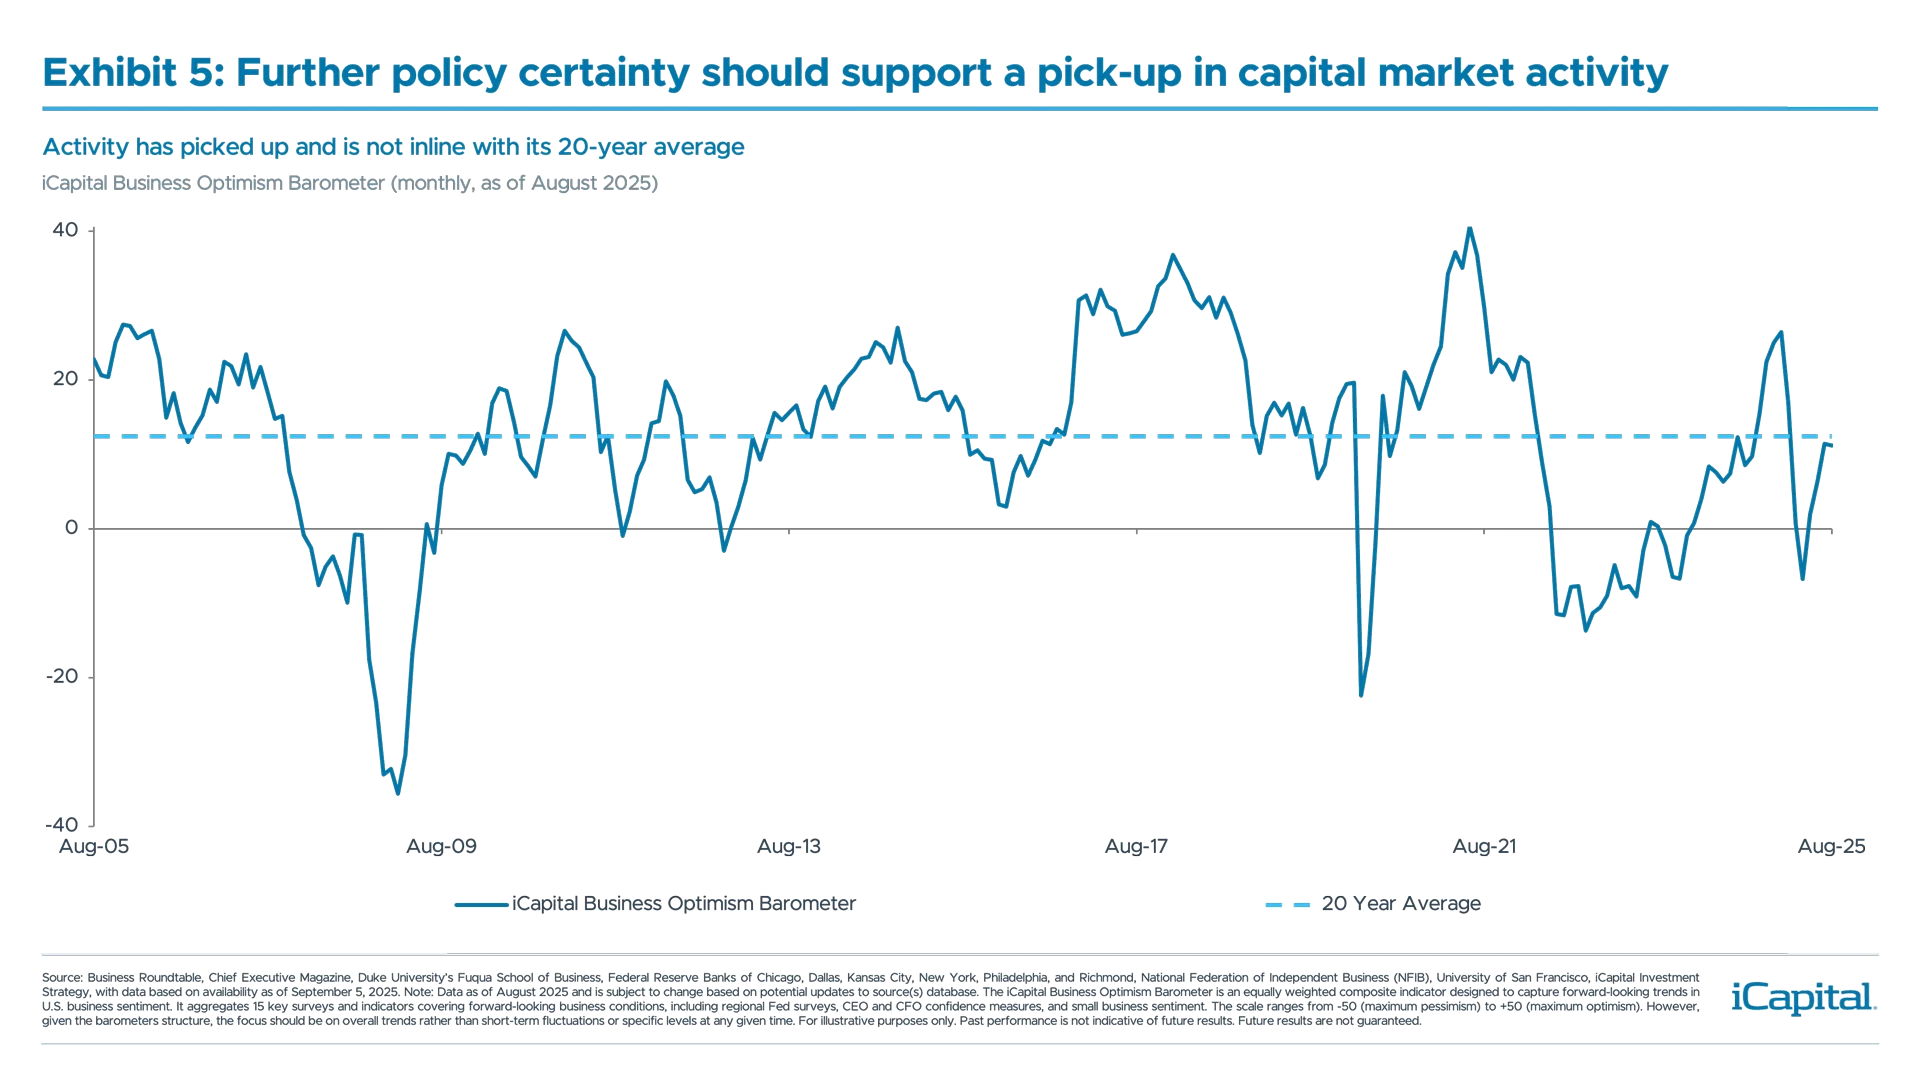
2. Capital Market Activity: Since our June update, capital markets have gained traction. The anticipated pro-business environment – driven by clearer trade and Fed policy, as well as lighter regulatory touch – has fueled an uptick in deal activity. M&A volumes are back to 2021-22 levels (on a YTD basis) , while the number of listed IPOs are running +51% higher compared to the same period in 2024 , led by high-quality tech and AI names. With policy certainty boosting business sentiment – iCapital Business Optimism Barometer has rebounded significantly off April 2025 lows (Exhibit 5) – and a near record $3.9 trillion of private capital dry powder is waiting to be deployed, the deal pipeline for Q4 and 2026 looks robust. Dealmakers will look to capitalize on stabilizing valuations and a more favorable macro backdrop.
3. K-Shaped Economy: Not only has economic data remained resilient, so has consumption. In fact, looking at the last GDP print, personal consumption was revised higher to 1.6% from 1.4%, and total card spending also rose by 1.8% YoY in July, the highest growth rate since January. Yet, despite the increase, the low-income consumer saw their spending decelerate from 1.6% to 1.3%, while the high-income consumer saw their spending rise from 2.9% to 3.2% – with the gap between the two cohorts at its widest level since February 2021. This trend will be important to monitor, especially if the labor market continues to weaken.
How to position portfolios? We would be looking through the near-term noise
While there is still a risk of a pullback in September, we think these pullbacks will be limited. Even with the factors that we think are supportive of the economy and markets, based on our fair value framework, we currently see the downside risk to the S&P 500 of ~-5% from current levels (Exhibit 6). And with plenty of cash on the sidelines, just over $7 trillion in money market funds, we think investors will maintain their buy the dip bias.
 But as we gain further policy clarity, we think this environment should favor specific asset classes and sectors in both private and public markets.
In private markets we would continue to favor middle market buyout and infrastructure, as we discussed here and here. However, we also think the current environment should be supportive of lower middle market direct lending. Many of the companies in this part of the market are economically sensitive, so easier financial conditions should be a tailwind for these companies, especially when compared to the upper middle market. In addition, if rates continue to fall, lower middle market firms will likely offer yields that are attractive relative to the broader landscape.
From a sector perspective, we continue to maintain a slight cyclical bias and are favoring sectors such as financials and industrials, which should benefit from economic growth remaining resilient. In addition, there are also secular factors such as deregulation and the administration’s push to reshore manufacturing activity. Elsewhere, we also think the current environment should favor rate sensitive sectors such as Homebuilders. While there are upside risks to rates, we are still of the view that rates will remain rangebound for the remainder of the year. Therefore, with coming rate cuts and the long end of the curve remaining stable, this should be supportive of homebuilders, but also other rate sensitive parts of the markets.
- S&P Global, as of Sept. 3, 2025.
- S&P Global, as of Sept. 3, 2025.
- S&P Global, as of Sept. 3, 2025.
- S&P Global, iCapital Investment Strategy, as of Sept. 3, 2025.
- Goldman Sachs, as of May 30, 2025.
- Bloomberg Index Services, as of Sept. 4, 2025.
- JP Morgan, as of Sept. 5, 2025.
- Bureau of Labor Statistics, as of Sept. 5, 2025.
- S&P Global, Federal Reserve, as of Sept. 3, 2025.
- Citi, as of Sept. 3, 2025.
- FactSet, as of Aug. 29, 2025.
- S&P Global, as of Sept. 4, 2025.
- Tax Policy Center, Tax Foundation, as of July 8, 2025.
- Federal Reserve, as of Sept. 4, 2025.
- American Association for Individual Investors, as Sept. 4, 2025.
- Bloomberg, iCapital Investment Strategy Analysis, as of Sept. 5, 2025. Note: Aggregated M&A deal volume data can differ across sources and based on inputted criteria. M&A data used in this commentary is sourced from Bloomberg data and is based on completed M&A deals exceeding $50 million in size. Announced or pending deals are not included unless otherwise noted. Data is analyzed by region of company. Self-tenders, recaps, exchange offers, and spinoffs are excluded.
- Bloomberg, iCapital Investment Strategy Analysis, as of Sept. 5, 2025. Note: Aggregated IPO data can differ across sources and based on inputted criteria. IPO data used in this commentary is sourced from Bloomberg data and is based on U.S. exchange-listed IPOs that have priced, are currently trading, and have market caps of at least $25 million. Closed-end funds, unit offerings, and SPACs are excluded.
- iCapital Investment Strategy Analysis, Business Roundtable, Chief Executive Magazine, Duke University’s Fuqua School of Business, Federal Reserve Bank of Dallas, Federal Reserve Bank of Kansas City, Federal Reserve Bank of New York, Federal Reserve Bank of Richmond, Federal Reserve Bank of Philadelphia, Federal Reserve Bank of Chicago, National Federation of Independent Business, iCapital Investment Strategy, with data based on availability as of Sept. 5, 2025. Note: Data as of August 2025 and is subject to change based on potential updates to source(s) database. The iCapital Business Optimism Barometer is a composite leading measure designed to offer forward-looking insights into underlying trends in U.S. business confidence. It draws on 14 key indicators including Dallas Fed Texas Service Sector Outlook Survey - General Business Conditions 6mo Ahead, Dallas Fed Texas Manufacturing Outlook Survey - General Business Conditions 6mo Ahead, Kansas City Fed Manufacturing Survey - Composite Index Expected in Six Months, Kansas City Fed Service Sector Survey - Composite Index Expected in Six Months, FRBNY U.S. Empire State Manufacturing Survey - General Business Conditions 6mo Ahead, FRBNY Business Leaders Survey - Business Climate Expected in Six Months, Richmond Fed Services Sector Activity Survey - Expected Local Business Condition, Philadelphia Fed Business Outlook Survey - General Business Conditions 6mo Ahead, Chicago Fed Survey of Economic Conditions - 6-12 Mo Outlook for U.S. Economy, U.S. Duke CFO Survey - Optimism about the U.S. Economy, U.S. Duke CFO Survey - Optimism About Own Company, Chief Executive Magazine CEO Confidence Index - Confidence in the Economy 1 Year from Now, U.S. Business Roundtable CEO Survey Economic Outlook Index, NFIB Small Business Optimism Index - Outlook for General Business Conditions. Given the indicator’s structure, the focus should be on overall trends rather than short-term fluctuations or specific levels at any given time.
- Preqin, iCapital Alternatives Decoded, with data based on availability as of July 31, 2025. Note: Data through December 2024 and is subject to change based on potential updates to source(s) database. Dry powder refers to committed but uninvested capital. Dry powder shown is for all private capital asset classes as defined by Preqin. In this analysis, Real Assets includes Infrastructure and Natural Resources but excludes Real Estate. Within Real Assets, Natural Resources is based on pure-play natural resource-type funds only, with more traditional/old-school natural resource-type funds, such as Oil & Gas, categorized under Private Equity as defined by Preqin. Secondaries and Fund of Funds includes all available secondaries and fund of funds categories as defined by Preqin. RMB-denominated funds are excluded for greater data accuracy.
- Bureau of Economic Analysis, Bank of America, as of Aug. 12, 2025.
- Bank of America, as of Aug. 12, 2025.
- iCapital Investment Strategy, as of Sept. 5, 2025. Note: Assume Fwd. P/Es fall to 20x (the five year average) and consensus earnings growth for 2026 of $304.
INDEX DEFINITIONS
Atlanta Fed GDPNow Index: The GDPNow model is a real-time estimate of U.S. GDP growth published by the Federal Reserve Bank of Atlanta. It provides a “nowcast” of the official GDP growth rate before its release, updating frequently as new economic data become available.
Citi Economic Surprise Index (CESI): The Citi Economic Surprise Index measures the degree to which economic data releases have been beating or missing consensus forecasts. A positive reading indicates that data have generally exceeded expectations, while a negative reading reflects weaker-than-expected releases.
S&P 500 Index: The S&P 500 is widely regarded as the best single gauge of large-cap U.S. equities. The index includes 500 of the top companies in leading industries of the U.S. economy and covers approximately 80% of available market capitalization.
IMPORTANT INFORMATION
The material herein has been provided to you for informational purposes only by Institutional Capital Network, Inc. (“iCapital Network”) or one of its affiliates (iCapital Network together with its affiliates, “iCapital”). This material is the property of iCapital and may not be shared without the written permission of iCapital. No part of this material may be reproduced in any form, or referred to in any other publication, without express written permission of iCapital.
This material is provided for informational purposes only and is not intended as, and may not be relied on in any manner as, legal, tax or investment advice, a recommendation, or as an offer or solicitation to buy or sell any security, financial product or instrument, or otherwise to participate in any particular trading strategy. This material does not intend to address the financial objectives, situation, or specific needs of any individual investor. You should consult your personal accounting, tax and legal advisors to understand the implications of any investment specific to your personal financial situation.
ALTERNATIVE INVESTMENTS ARE CONSIDERED COMPLEX PRODUCTS AND MAY NOT BE SUITABLE FOR ALL INVESTORS. Prospective investors should be aware that an investment in an alternative investment is speculative and involves a high degree of risk. Alternative Investments often engage in leveraging and other speculative investment practices that may increase the risk of investment loss; can be highly illiquid; may not be required to provide periodic pricing or valuation information to investors; may involve complex tax structures and delays in distributing important tax information; are not subject to the same regulatory requirements as mutual funds; and often charge high fees. There is no guarantee that an alternative investment will implement its investment strategy and/or achieve its objectives, generate profits, or avoid loss. An investment should only be considered by sophisticated investors who can afford to lose all or a substantial amount of their investment.
iCapital Markets LLC operates a platform that makes available financial products to financial professionals. In operating this platform, iCapital Markets LLC generally earns revenue based on the volume of transactions that take place in these products and would benefit by an increase in sales for these products.
The information contained herein is an opinion only, as of the date indicated, and should not be relied upon as the only important information available. Any prediction, projection or forecast on the economy, stock market, bond market or the economic trends of the markets is not necessarily indicative of the future or likely performance. The information contained herein is subject to change, incomplete, and may include information and/or data obtained from third party sources that iCapital believes, but does not guarantee, to be accurate. iCapital considers this third-party data reliable, but does not represent that it is accurate, complete and/or up to date, and it should not be relied on as such. iCapital makes no representation as to the accuracy or completeness of this material and accepts no liability for losses arising from the use of the material presented. No representation or warranty is made by iCapital as to the reasonableness or completeness of such forward-looking statements or to any other financial information contained herein.
Securities products and services are offered by iCapital Markets, an SEC-registered broker-dealer, member FINRA and SIPC, and an affiliate of iCapital, Inc. and Institutional Capital Network, Inc. These registrations and memberships in no way imply that the SEC, FINRA, or SIPC have endorsed any of the entities, products, or services discussed herein. Annuities and insurance services are provided by iCapital Annuities and Insurance Services LLC, an affiliate of iCapital, Inc. “iCapital” and “iCapital Network” are registered trademarks of Institutional Capital Network, Inc. Additional information is available upon request.
©2025 Institutional Capital Network, Inc. All Rights Reserved.


