The developments of the last few days have been extraordinary. Regional banks had one of the largest 3-day sell-offs on record, falling more than 21%.1 The anticipated terminal rate for fed funds plummeted close to 100 basis points (bps) during this time, with consensus quickly shifting from four more rate hikes in 2023 to now pricing in zero to just one more 25 bps rate hike in March before being followed by rate cuts in July.2

While we are not yet convinced that these particular moves by the market to price-in future rate cuts are justified, we do see the cause for a Fed pause in March. The cost of skipping a 25 bps rate hike after already hiking 450 bps within 12 months is low, but preserving financial stability is paramount since banks are vital to both households and corporates, and clearly are deemed systemic enough by the Fed. One caveat – if we do see the price moves in the banking sector stabilize between now and next week, the Fed may opt to hike 25 bps. But either way, any near-term rate hikes should be very cautious given recent developments.
Although on the surface failure of Silicon Valley Bank (SVB) and Signature Bank (SBNY) may be seen as idiosyncratic, additional risk factors may still be at play for regional banks. This is why the regulators moved quickly to address the risk of uninsured deposits by fully protecting all depositors of those two banks. Policymakers also created a new Bank Term Funding Program, which enables eligible depository institutions to access additional funding through this program rather than having to sell securities, potentially at a loss. Both of these were important and critical moves to try to stabilize contagion concerns since all deposits – insured or above the typical $250,000 FDIC limit – are now explicitly protected for the two closed down banks and implicitly protected for others, while also providing banks with access to additional liquidity. However, the markets are clearly still concerned about further risks to regional banks as their shares continued to suffer losses on Monday. This is likely for two reasons – first, because the equity and bond holders were not protected by the same backstop that protected depositors and second, because regional banks still face risks further described below.
Significant challenges are affecting more regional banks
Accelerated deposit outflows from a concentrated depositor base were at the heart of the SVB and SBNY collapse.3 In addition, for SVB, securities, some of which suffered mark-to-market losses, were a high percentage of overall assets.4 But there are a host of reasons why regional banks may continue to be challenged to a varying degree.
1. Higher yielding options are increasingly available with U.S. Treasuries, money markets tied to fed funds, and other non-bank alternatives yielding materially more than typical checking and savings accounts.5 This is understandably forcing outflows from some non-interest-bearing and low-interest bank accounts.
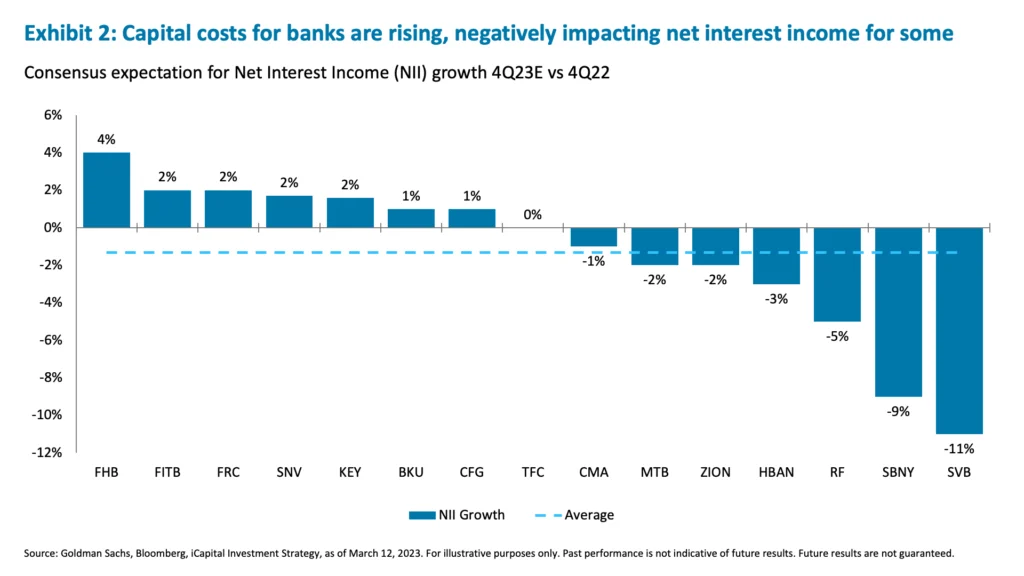
2. To compete against higher interest rate options, banks are seeing their cost of capital rise. For example, deposit betas have been rising, and may continue to rise, for regional banks.6 With the yield curve inverted, these rising funding costs are lowering consensus net interest income expectations. Not surprisingly, in retrospect, SVB and SBNY were among the banks with the highest cumulative deposit betas and the names that analysts expected would see the largest decline to net interest income by the end of 2023.7
3. With rates rising north of 450 bps, all banks are nursing some mark-to-market losses on their available-for-sale (AFS) securities portfolios.8 However, not every bank had 58% of their assets in securities like SVB did, but a ~30% of asset securities portfolio is typical for regionals.9 This securities portfolio is typically comprised of a portion in AFS securities that need to be marked to fair value, as well as the held-to-maturity (HTM) securities, which are carried at amortized cost. The risk is that if deposit outflows continue, it’s not only the AFS securities that will experience a loss, but some of the HTM securities may need to be re-classified and losses realized if required to be sold to meet deposit outflows.10
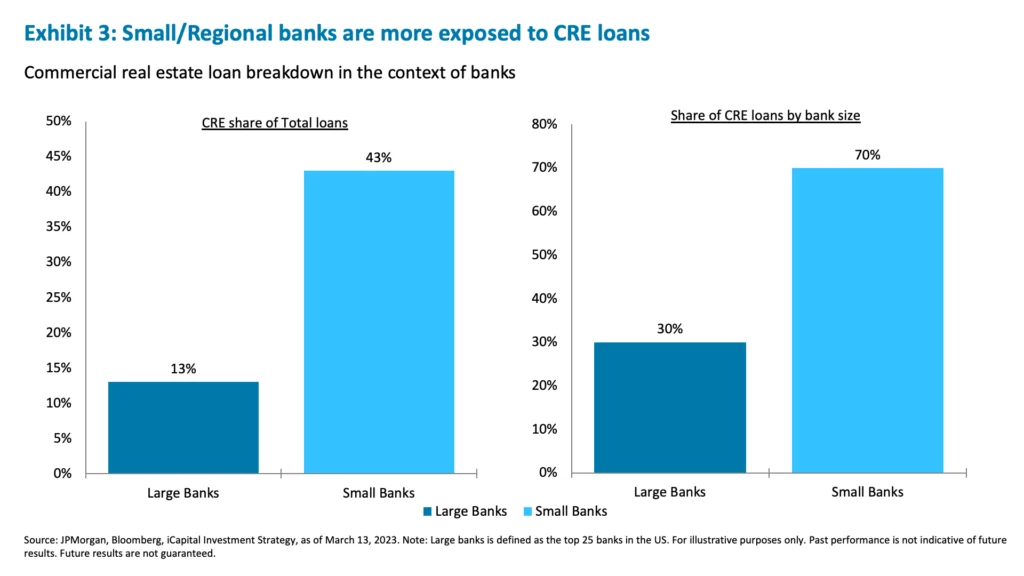
4. Potential default risk in commercial real estate (CRE) may impact regional banks. As rates on floating-rate CRE mortgages rose from roughly 3.5% in 2022 to close to 7% today, and income yields and cap rates remained near 4%-4.5%, many properties may find themselves in an unstable and untenable financial situation.11 As a result, real estate owners may be forced or may even choose to strategically default on properties that are no longer economical and where fundamentals are deteriorating (for example, office CRE). This poses a rising default risk in CRE portfolios of smaller banks. Regional banks account for 70% of total CRE loan exposure, and CRE loans represent 43% of all loans for small banks versus only 13% for large banks.12 Couple that with an upcoming wall of maturities in CRE loans, and it is easy to see the risk of rising defaults for regional banks.
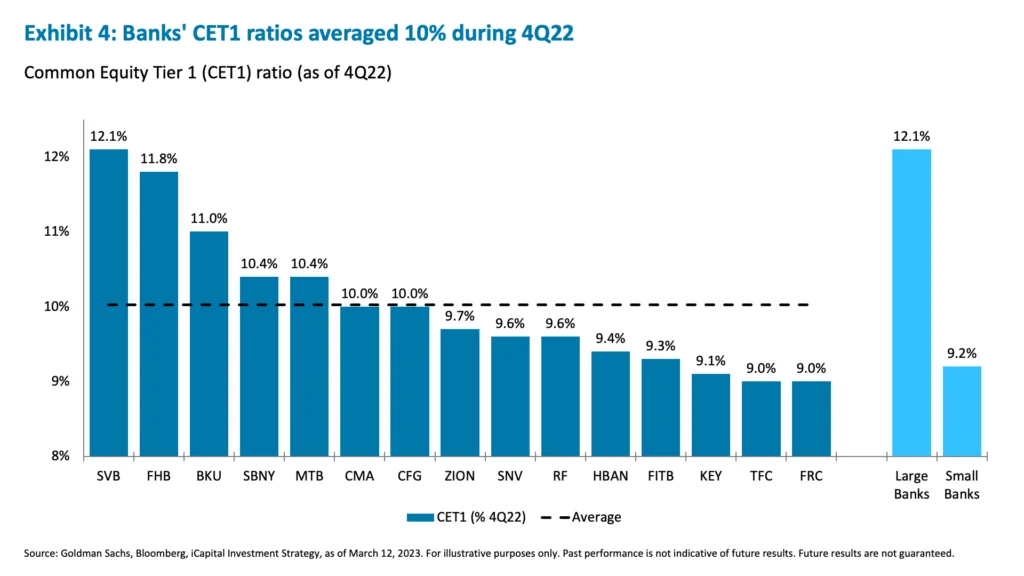
5. Finally, smaller regional banks are not as well capitalized or regulated as the larger global systemically important banks (G-SIBs). Following the 2008 Global Financial Crisis, Dodd-Frank required banks to conduct company-run stress tests and disclose the results. In May of 2018, the Economic Growth, Regulatory Relief, and Consumer Protection Act increased the minimum threshold for stress testing to $250 billion in assets, exempting regional banks under this threshold from the requirements.13 Further, as of Dec 31, 2019, the liquidity coverage ratio (LCR), which stipulated how much high-quality liquid assets (HQLAs) the bank must hold to cover 30 days’ worth of net cash flows, does not always apply to smaller banks.14 Some banks were allowed to apply a reduced LCR while others were exempt altogether.15 The common equity tier 1 (CET1) capital ratios for smaller banks average ~10% versus 12% for G-SIBs.16 Finally, the loan-to-deposit ratios are 82% for small versus 60% for large banks,17 giving these banks less of a buffer. These combined factors mean regional banks have less liquidity than their G-SIB counterparts.
All of these challenges combined seem to point to deposits moving over to larger banks. This also impacts investor confidence, as all of these banks share a degree of vulnerability given market dynamics. While regulators moved quickly, only time will tell whether the action taken is enough to alleviate market concerns, and we suspect more regulatory action will be needed to stabilize the banks given these recent price moves.
The Fed is not likely to abandon its resolve on inflation, but should at least pause it in March
Given the sharp market repricing in rates and the current bank instability, we believe the Fed should pause, at least temporarily, to assess the impact. It made sense to hike rates unabated if nothing broke, but strains are now evident in banking broadly. Prior crypto meltdowns were not large enough to warrant a pause, but the banking sector is the lifeblood of the economy, and its proper functioning is essential. Since the SVB fallout is now affecting the regional bank market, the impact is broad enough to warrant a reprieve.
But what about inflation? We think today’s CPI data gives the Fed an opening to pause. The CPI came in as expected at 6% YoY versus the 6.4% YoY last month, and 5.5% YoY core CPI vs. 5.6% YoY last month, respectively. The monthly change in core CPI was higher than anticipated at a +0.5% month-over-month increase versus +0.4%. But given that most other inflation numbers within the report were as expected and last week’s payrolls report showed slower month-over-month wage growth and a higher unemployment rate of 3.6%,18 this should make the Fed more comfortable halting rate hikes for now, or at least slowing down to 25 bps temporarily, given the regional bank sector turmoil is fresh in investors’ minds.19
Finally, with 450 bps of rate hikes already delivered since March of 2022, the incremental impact of just another 25 bps is small; therefore, the cost of skipping it is low, relative to the need to preserve financial stability. The near-term focus needs to be towards stabilizing regional banks, which are essential for the functionality of households and corporates across the U.S. Beyond March, the near 100 bps drop in the fed funds terminal rate may not be justified, but the ensuing developments of the next few weeks will tell us more.
Opportunities amidst the turmoil
For reasons outlined above, we believe challenges still lie ahead for the regional banks as the risk of contagion remains imminent. Even the larger bank equities have not been immune from the sell-off, though they did hold up much better. Still, we would be looking for opportunities elsewhere, and specifically here:
1. Look to investment grade (IG) bonds of large financial firms and big bank preferreds. The yield-to-worst yields are close to 6% as spreads widen across the IG universe and within financials.20 Regulatory ratios and stress tests make us more comfortable with solvency and liquidity of these G-SIBs. Within the overall IG universe, regional banks represent only 1.6% of total notional outstanding,21 so we continue to like the space as a defensive, high-quality piece of the portfolio.
2. Look to the tech and Nasdaq stocks. These stocks are likely to be the key beneficiaries of the Fed’s pause, or at least a slower pace, of rate hikes. Despite last week’s market turmoil, the info tech sector of the S&P 500, for example, is down just -0.6% in March versus a -7.9% decline for the financial sector.22 While the banks are grappling with basic liquidity and profitability challenges, many tech companies are still growing in this environment, have high profit margins, and may not have to suffer from the valuation pressure as they did last year, given the Fed‘s anticipated pause. Not surprisingly, they have been holding up much better.
1. Bloomberg, iCapital Investment Strategy, as of March 13, 2023.
2. Bloomberg, iCapital Investment Strategy, as of March 13, 2023.
3. Bloomberg, iCapital Investment Strategy, as of March 13, 2023.
4. Bloomberg, Silicon Valley Bank 10-K, iCapital Investment Strategy, as of March 13, 2023.
5. Bloomberg, iCapital Investment Strategy, as of March 13, 2023.
6. Bloomberg, Goldman Sachs, iCapital Investment Strategy, as of March 12, 2023.
7. Bloomberg, Goldman Sachs, iCapital Investment Strategy, as of March 12, 2023.
8. Bloomberg, iCapital Investment Strategy, as of March 12, 2023.
9. Bloomberg, Goldman Sachs, iCapital Investment Strategy, as of March 12, 2023.
10. Bloomberg, iCapital Investment Strategy, as of March 12, 2023.
11. Trepp, CoStar, Bloomberg, iCapital Investment Strategy, as of March 13, 2023.
12. JPMorgan, Federal Reserve, iCapital Investment Strategy, as of March 2023.
13. Office of the Comptroller of the Currency, as of November 24, 2019.
14. Office of the Comptroller of the Currency, Federal Register, as of December 31, 2019.
15. Office of the Comptroller of the Currency, Federal Register, as of December 31, 2019.
16. Goldman Sachs, iCapital Investment Strategy, as of March 12, 2023.
17. Goldman Sachs, iCapital Investment Strategy, as of March 12, 2023.
18. Bloomberg, Bureau of Labor Statistics, iCapital Investment Strategy, as of March 10, 2023.
19. Bloomberg, iCapital Investment Strategy, as of March 13, 2023.
20. Bloomberg, iCapital Investment Strategy, as of March 12, 2023.
21. Bloomberg, iBoxx, iCapital Investment Strategy, as of March 13, 2023.
22. Bloomberg, iCapital Investment Strategy, as of March 12, 2023.
IMPORTANT INFORMATION
The material herein has been provided to you for informational purposes only by iCapital, Inc. (“iCapital”). This material is the property of iCapital and may not be shared without the written permission of iCapital. No part of this material may be reproduced in any form, or referred to in any other publication, without express written permission of iCapital.
This material is provided for informational purposes only and is not intended as, and may not be relied on in any manner as, legal, tax or investment advice, a recommendation, or as an offer to sell, a solicitation of an offer to purchase or a recommendation of any interest in any fund or security. You should consult your personal accounting, tax and legal advisors to understand the implications of any investment specific to your personal financial situation. This material does not intend to address the financial objectives, situation or specific needs of any individual investor. Alternative investments are complex, speculative investment vehicles and are not suitable for all investors.
The information contained herein is an opinion only, as of the date indicated, and should not be relied upon as the only important information available. Any prediction, projection or forecast on the economy, stock market, bond market or the economic trends of the markets is not necessarily indicative of the future or likely performance. The information contained herein is subject to change, incomplete, and may include information and/or data obtained from third party sources that iCapital believes, but does not guarantee, to be accurate. iCapital considers this third-party data reliable, but does not represent that it is accurate, complete and/or up to date, and it should not be relied on as such. iCapital makes no representation as to the accuracy or completeness of this material and accepts no liability for losses arising from the use of the material presented. No representation or warranty is made by iCapital as to the reasonableness or completeness of such forward-looking statements or to any other financial information contained herein.
Securities products and services are offered by iCapital Markets, an SEC-registered broker-dealer, member FINRA and SIPC, and an affiliate of iCapital, Inc. and Institutional Capital Network, Inc. These registrations and memberships in no way imply that the SEC, FINRA, or SIPC have endorsed any of the entities, products, or services discussed herein. Annuities and insurance services are provided by iCapital Annuities and Insurance Services LLC, an affiliate of iCapital, Inc. “iCapital” and “iCapital Network” are registered trademarks of Institutional Capital Network, Inc. Additional information is available upon request.
© 2023 Institutional Capital Network, Inc. All Rights Reserved.


