A Fresh Perspective
The end of summer brought with it a respite from the hectic day-to-day pace of the year, and a reset in the financial markets. The S&P 500 finished August lower by -1.8%1, while the U.S. 10 Year Treasury Rate settled persuasively above 4% to finish the month with a 4.1% yield.2 As a result, the S&P 500 was down 2.2% from its 52-week high, while the Nasdaq was down -2.8%.3 With back-to-school season and a race to year-end now upon us, we are sharing our thoughts on why despite the reset and higher rates, we still see several reasons for market optimism for the rest of the year.
Reasons for Market Optimism
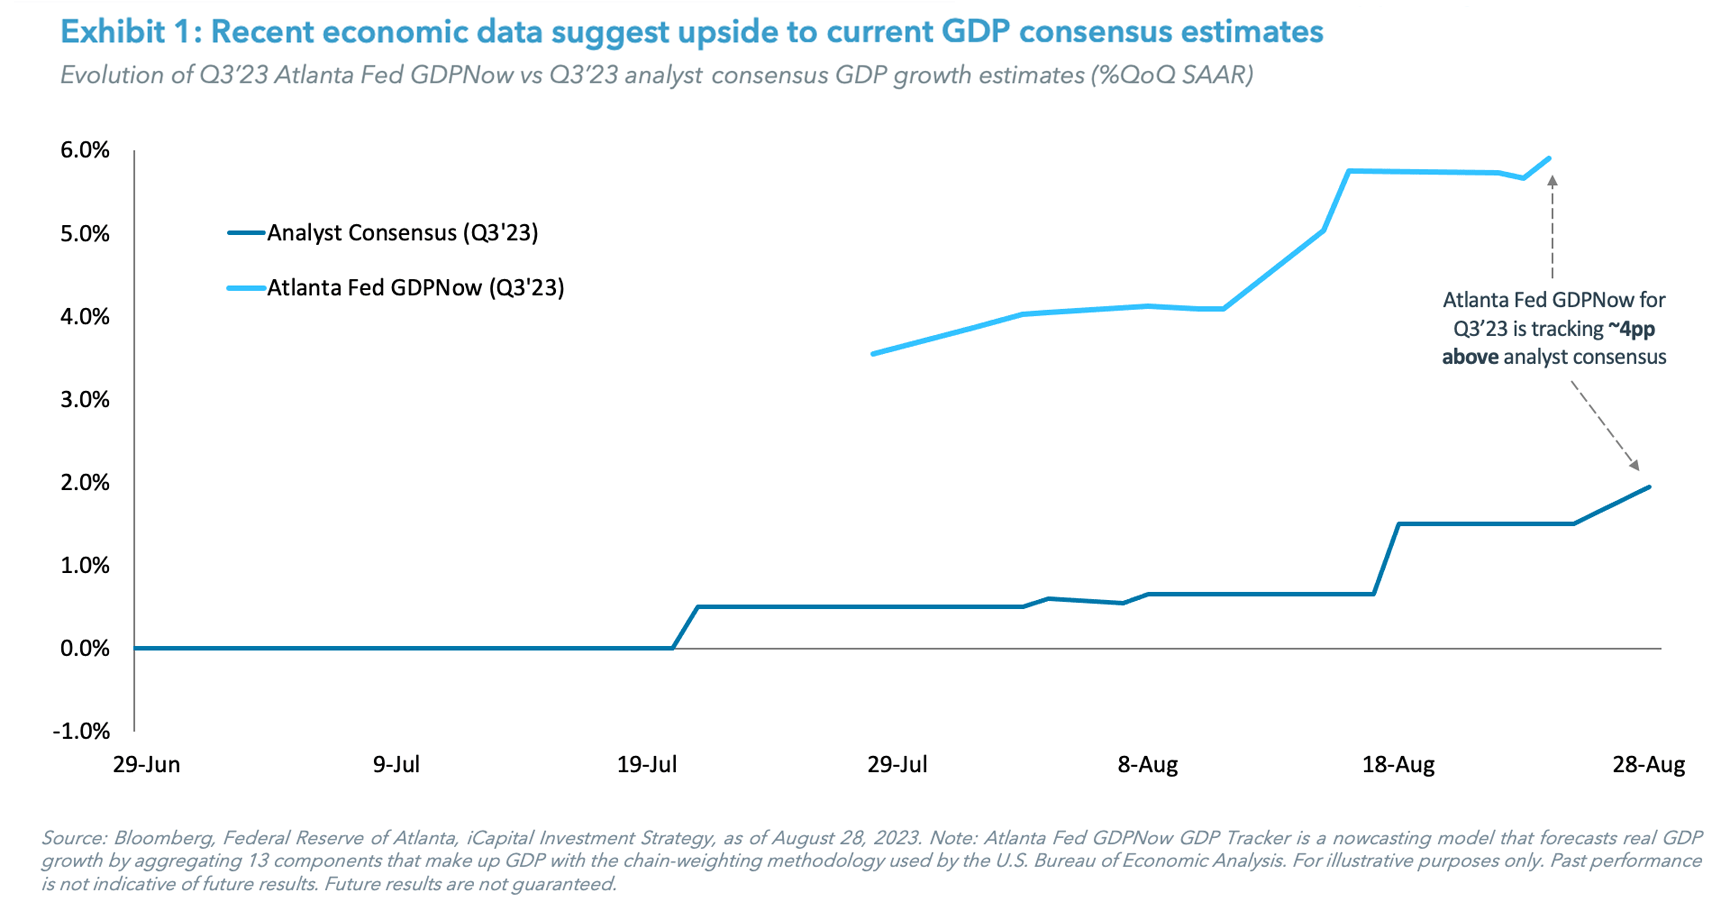
First, the economy is entering September with strong momentum. The Federal Reserve Bank of Atlanta GDPNow tracker of third quarter gross domestic product (GDP) growth suggests that the economy is on pace to grow a staggering +5.9% in the quarter, well above the economists’ forecast of +2.0% (Exhibit 1).4 Indeed, recent data on retail sales has remained strong, with the gauge rising +0.7% month-over-month for the July period versus the +0.4% expected, and above the prior months revised reading of +0.3%.5 And the higher frequency, real-time data also points to consumer demand remaining robust.6 Manufacturing has been notably weak, but in our view, it is clear consumer strength offsets that.
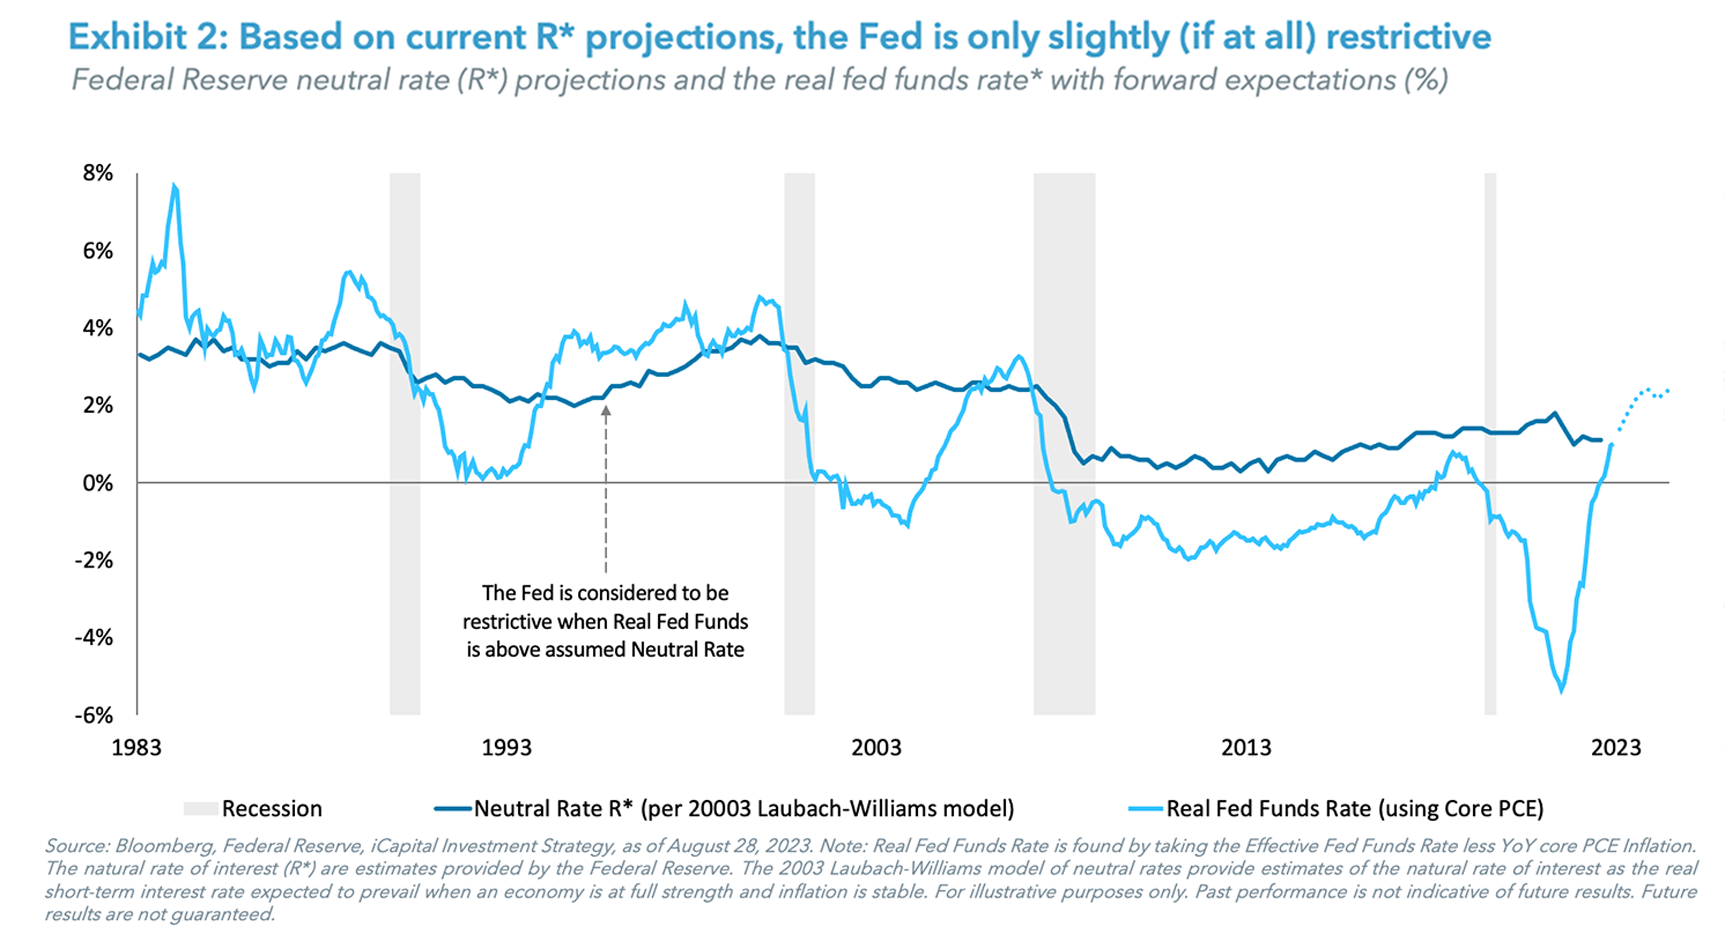
Second, the Fed is only slightly (if at all) restrictive, so we don’t expect an imminent recession. To measure whether the fed funds rate is “restrictive,” the Fed looks to the current level of the fed funds rate relative to the so- called neutral rate (also called r*).7 Using several estimates for this neutral rate and comparing that to the nominal rate minus core PCE inflation implies that rates are only very slightly in restrictive territory (Exhibit 2).8 Further, there is considerable uncertainty about the precise level of the neutral rate – as mentioned by Fed Chair Powell at Jackson Hole – and there is a very real possibility that the actual neutral rate is higher than various forecasts suggest.9
Indeed, with the fed funds rate at a target range of 5.25-5.5% and third quarter GDP at close to 6%, central banks might have a suspicion that rates might not be as restrictive yet because r* is higher than previously thought.10 The factors that may be pushing up this rate include: previously approved fiscal spending, which is still working its way through the economy and supporting growth (like the semiconductor spending bill and the IRA legislation); imbalances in the labor market, which keep the labor market tight and wage pressures elevated (in turn supporting consumer spending); and upcoming AI productivity increases, which could boost GDP growth potential.11 If these factors are indeed lifting the neutral rate, the actual fed funds rate may not even be restrictive just yet, further pushing out a potential recession.
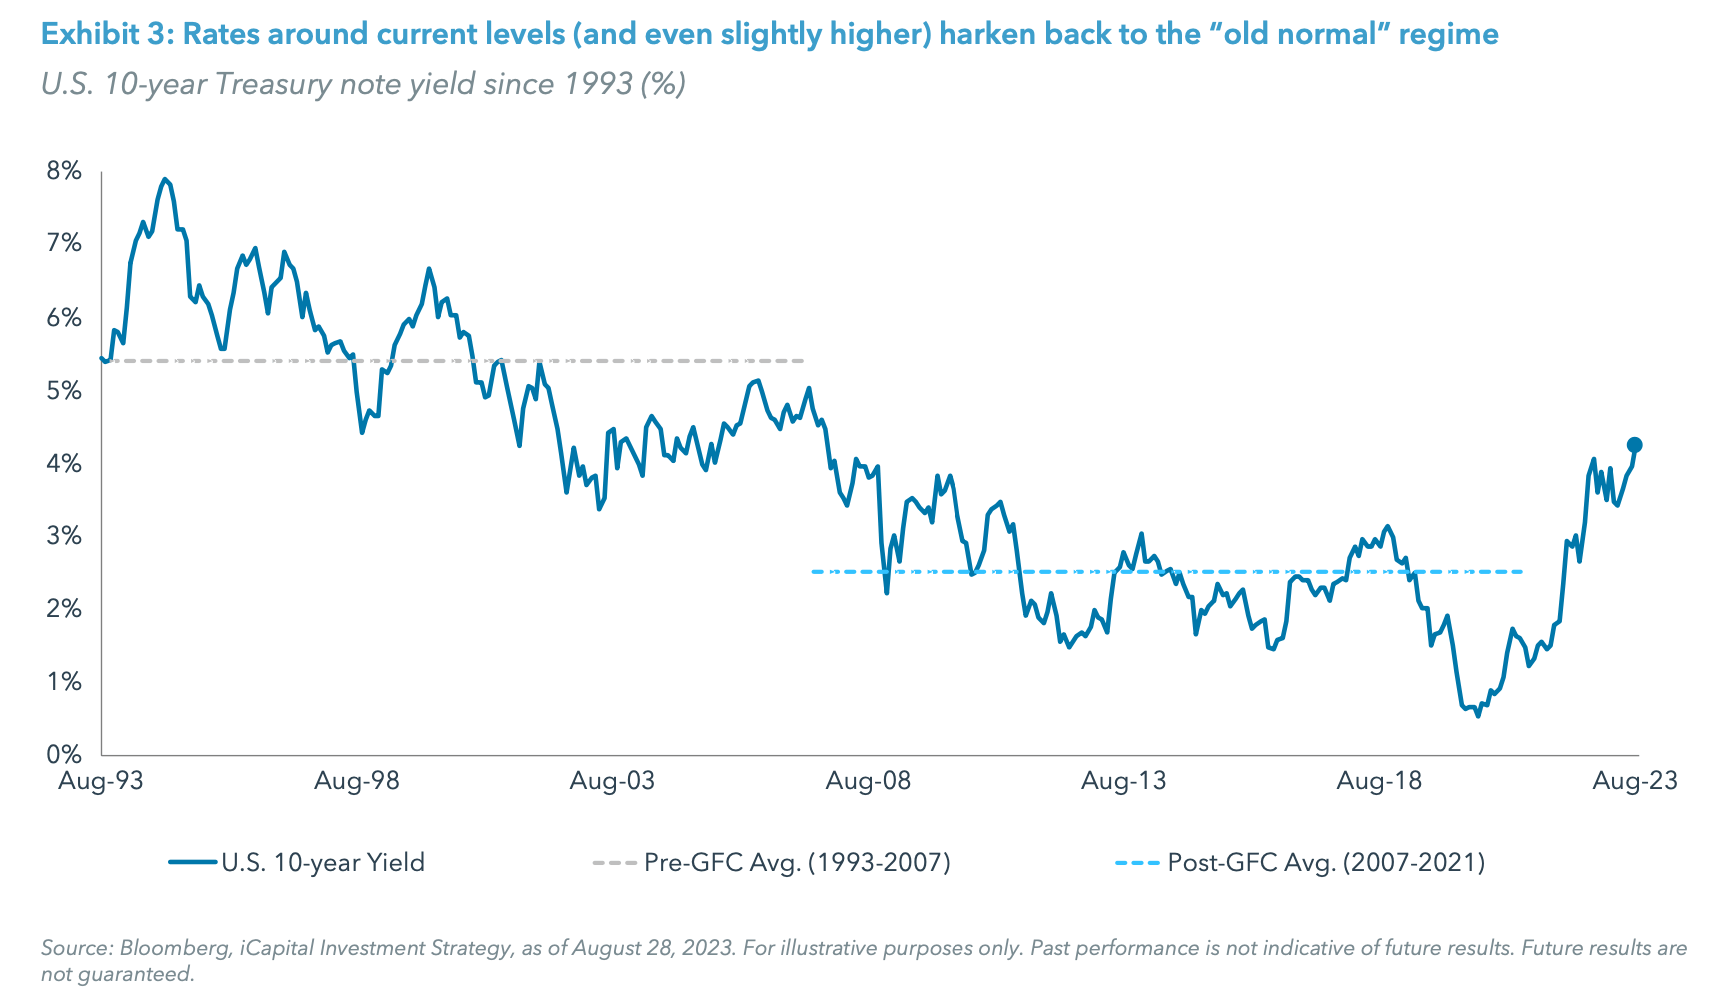
Third, although the recent rise in the U.S. 10 Year Treasury Rate yield exerts downward pressure on stocks, particularly in the Technology sector, rates around current levels and even slightly higher harken back to the “old normal” regime.
We note that the move higher in the U.S. 10-year during August is not all bad. Analysis on the fair value of the 10-year yield suggests that the move higher was partially attributed to higher short-term rate expectations and somewhat higher inflation expectations, but also to higher growth revisions.12 And if all of those continue to hold, the current over 4% U.S. 10-year yield could go higher still, especially considering the upcoming rise in Treasury issuance.13 But for perspective, although 4-5% feels like a sky-high interest rate today, that was the norm for years prior to the Global Financial Crisis (GFC). In the 14 years following the GFC, U.S. 10-year yields averaged~2.5%.14 However, yields on the U.S. 10-year averaged around 5.4% in the 15 years leading up to the GFC (Exhibit 3).15 Thus, the latest move may just be the return to the “old normal” regime.
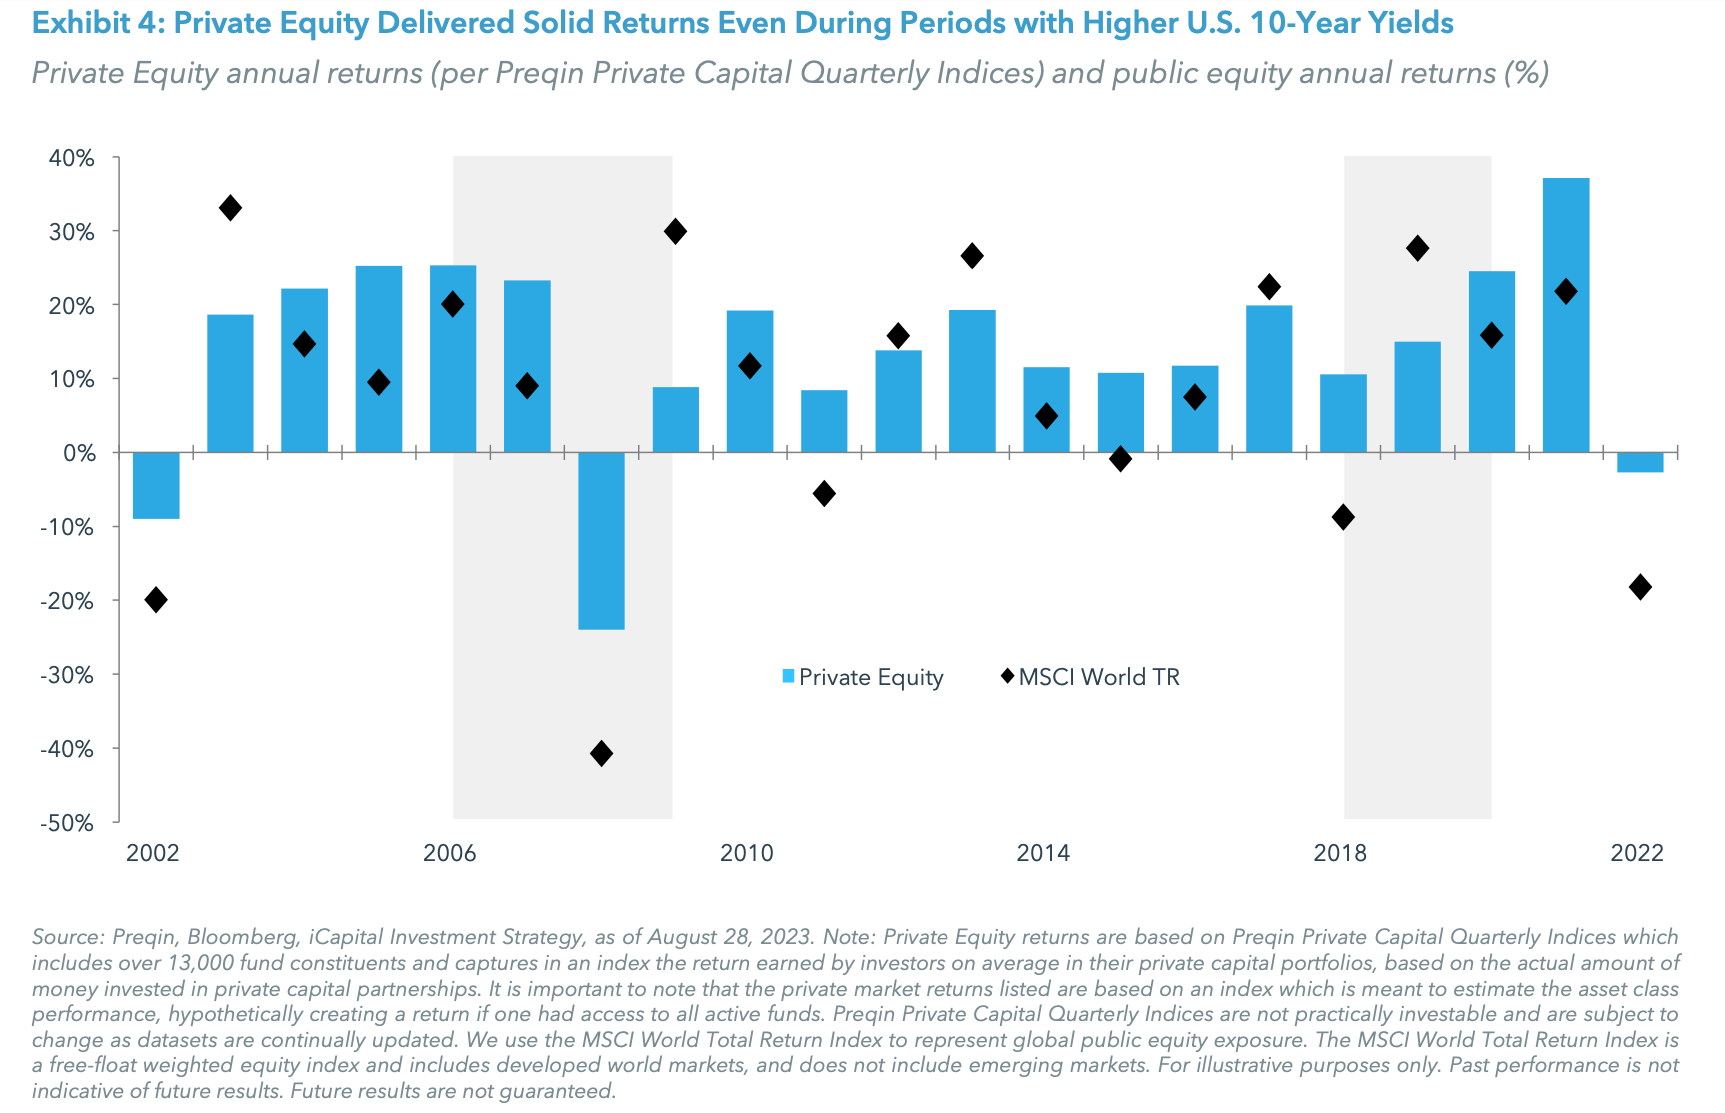
Fortunately, even with those higher levels of yields, there were plenty of investment strategies that delivered returns for investors before GFC. For example, during those years, stocks were able to move higher, corporate bonds outperformed U.S. Treasuries, and private equity delivered solid returns.16 In fact, based on the Preqin Private Equity Index, private equity strategies delivered an average annual return of around 23% from 2003-2006 despite U.S. 10-year yields consistently around 4.5% during that time (Exhibit 4).17 This is because there is more to public and private market returns than leverage, and one of the major drivers of performance is revenue and earnings growth. And with growth potential, an economy that can withstand and function with 5%+ rates (which we first highlighted here), and earnings growth forecasts to re-accelerate in the coming quarters, there is a conducive environment for stocks and private equity strategies, which help offset higher rates.
The bottom line for investors in this back-to-school season is that despite the reset higher in rates, which (we think, temporarily) dented stocks, there are strategies to take advantage in this “old normal” environment of higher rates. We believe the key to success in this regime is lower leverage. Investors should consider strategies that don’t rely heavily on leverage to generate returns. For example, private equity managers are using less leverage in the traditional buyout strategies. The average share of private equity leverage buyout (LBO) debt to enterprise value (EV) dropped from 50.8% in 2022 to 43.3% this year.18 Also, as the costs of borrowing increase, private equity managers have shifted their focus toward add-on and growth-focused private equity strategies which use less leverage and instead focus on growing profitability and market share. We recently discussed this in the Market Pulse snapshot here. In the public markets, Technology companies are typically less leveraged that those in other sectors and we favor adding to the Artificial Intelligence opportunities on pullbacks (which we wrote about here).
Of course, some companies will still have to finance their growth with debt, and providers of that debt can generate attractive income opportunities for investors. Private credit strategies can offer investors a coupon rate of a 500-700 bps spread over a short-term rate like the Secured Overnight Financing Rate (SOFR), helping generate income returns above cash and inflation. Finally, with back-to-school season in full swing, there are plenty of other opportunities for investors to study as well. Below we provide an update on five investment ideas that we believe are also well suited for this “old normal” environment.
PRIVATE MARKETS
PRIVATE CREDIT
Idea #1: Distressed Investing
After the steep rise in interest rates in 2022 and the first half of 2023, and with the Fed Funds Rate increasing to its highest level since July 2007,19 companies are facing the prospects of higher interest payments. As a result, over-levered companies are now facing a difficult environment to service or refinance their debt. This creates the potential for an increase in the number of defaults for the remainder of 2023 into 2024.
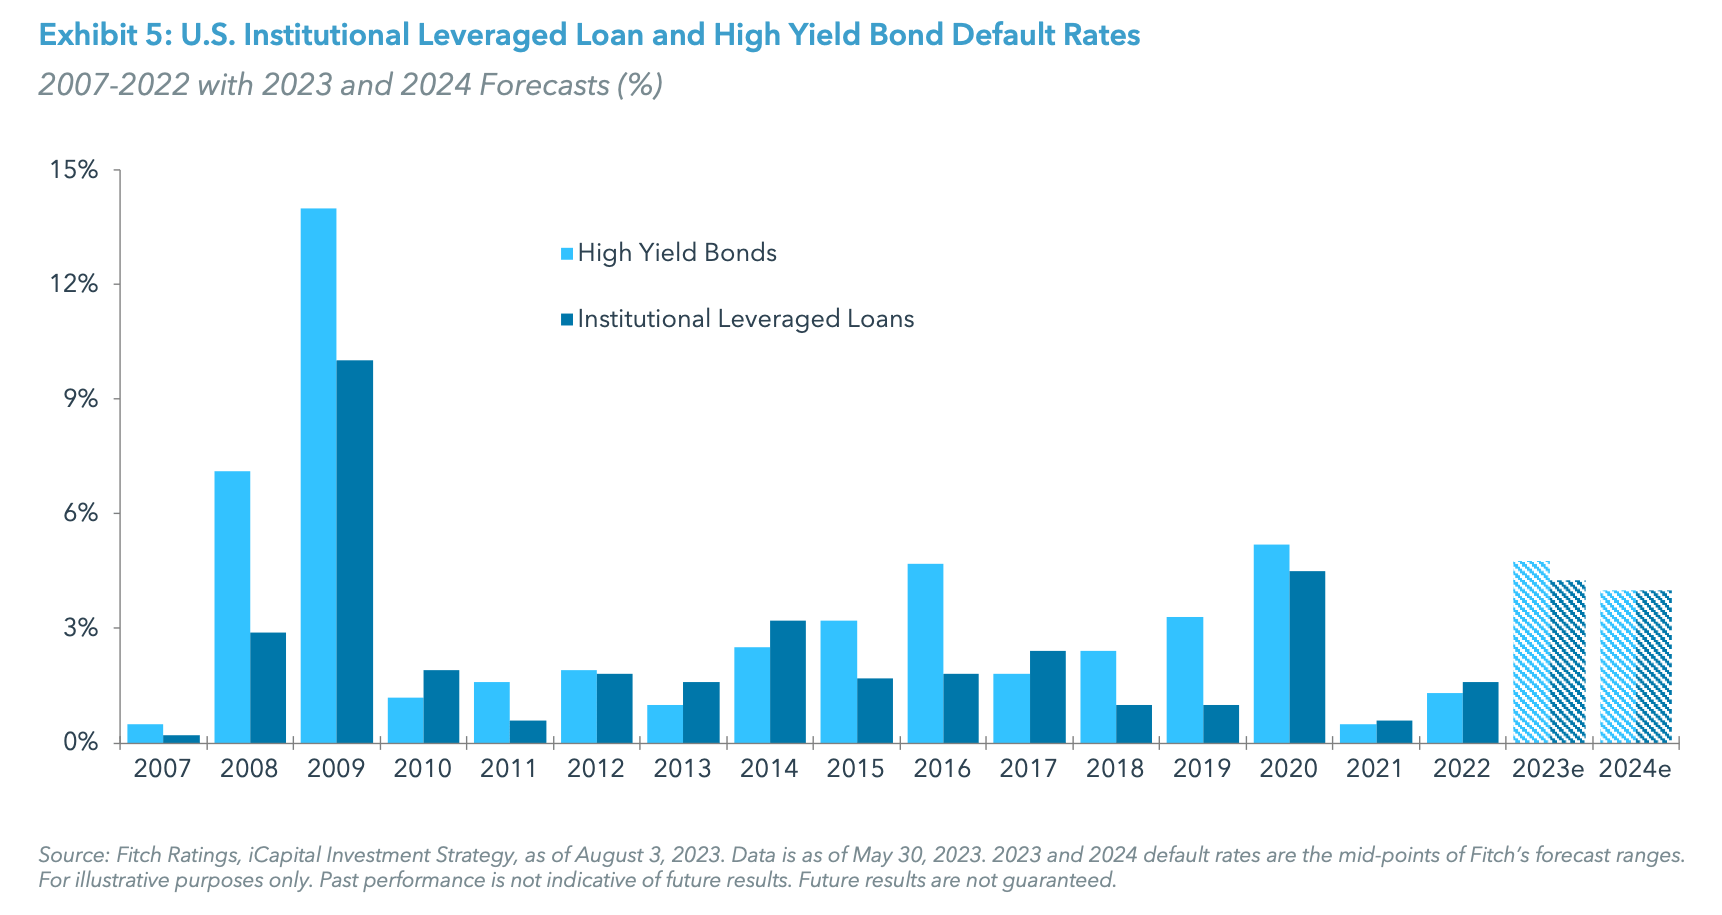
Signs of credit stress are already emerging with the failures of several regional banks, highlighting the potentially unexpected outcomes of increasing and elevated interest rates. Cracks in regional banks also have serious knock-on effects as lending standards tighten across the financial system, making refinancing maturing debt difficult for highly levered companies. In addition to the recent stress and uptick in defaults, Fitch Ratings’ 2023 U.S. LevFin Default forecasts for high yield loans rose from 3.0-3.5% in January 2023 to 4.5-5% in their May 2023 report (Exhibit 5).20 Given the significant growth in the credit markets since the GFC, even a moderate increase in default rates can create an enormous opportunity for distressed investing. Investors may want to prioritize this segment of the market in 2023 to add diversification and enhance the return and income potential of their portfolios.
PRIVATE EQUITY
Idea #2: Buyout
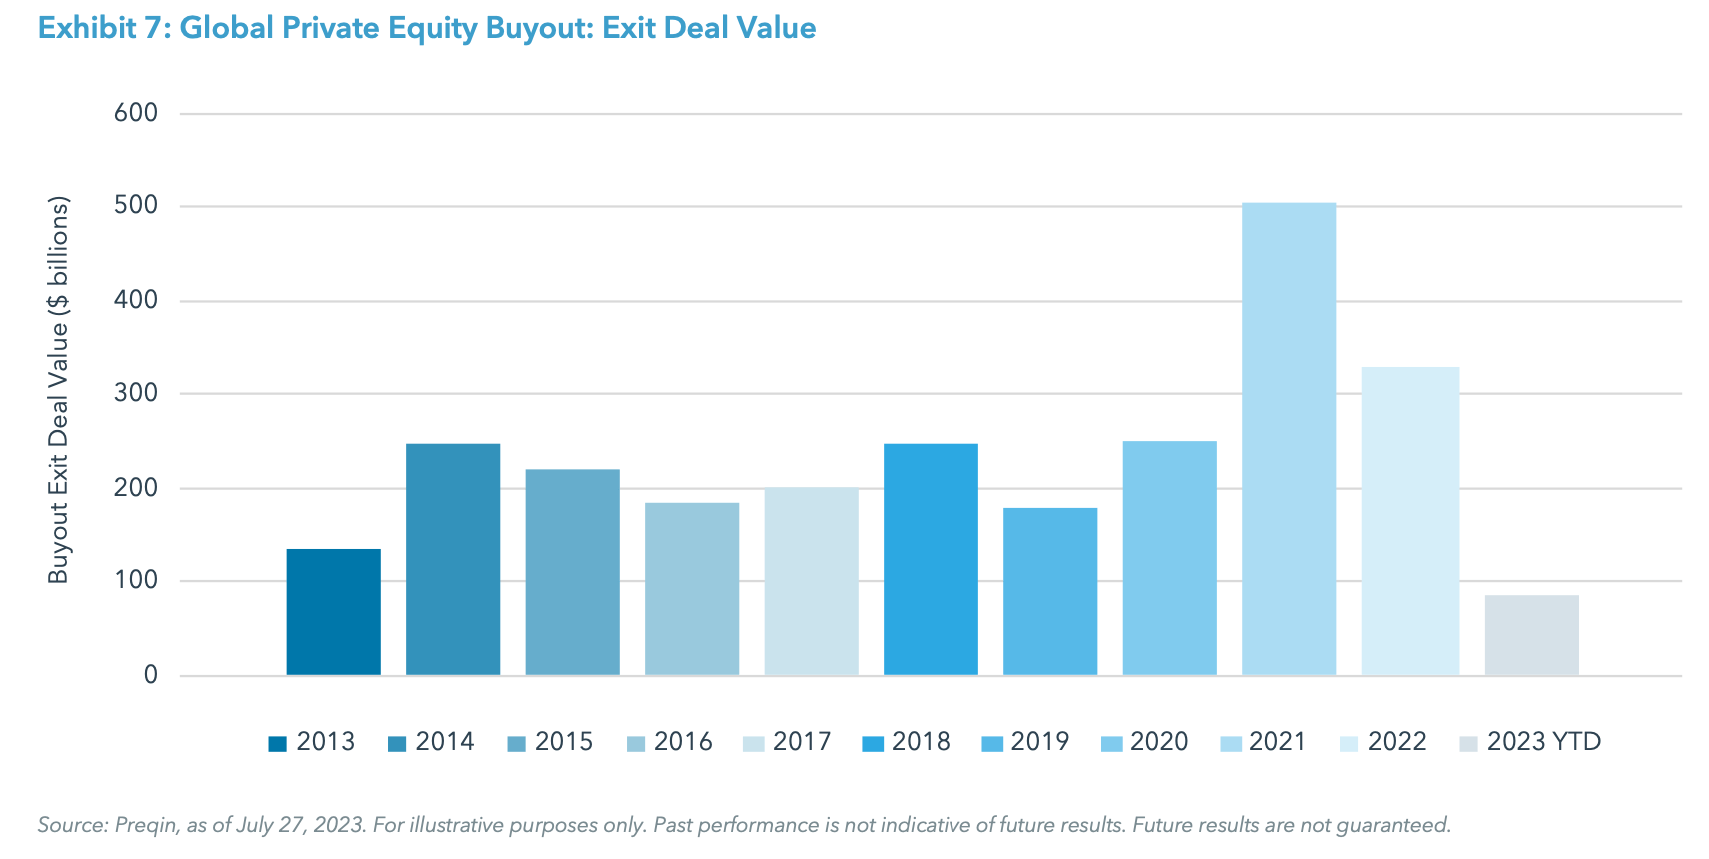
The first half of 2023 has generally seen a continuation of 2022 sentiments with macro uncertainty, limited exits, and subdued fundraising dominating private equity headlines. These prevailing circumstances are causing general partners (GPs) to pivot to quality, creativity, and discipline more heavily, with a tighter focus on selectivity and value creation. In the first quarter of 2023, completed buyout deals were valued at 10-15% lower than the same period in 2022.21 Our conviction for the buyout investment theme was partly rooted in the lower valuation which has started to take effect.
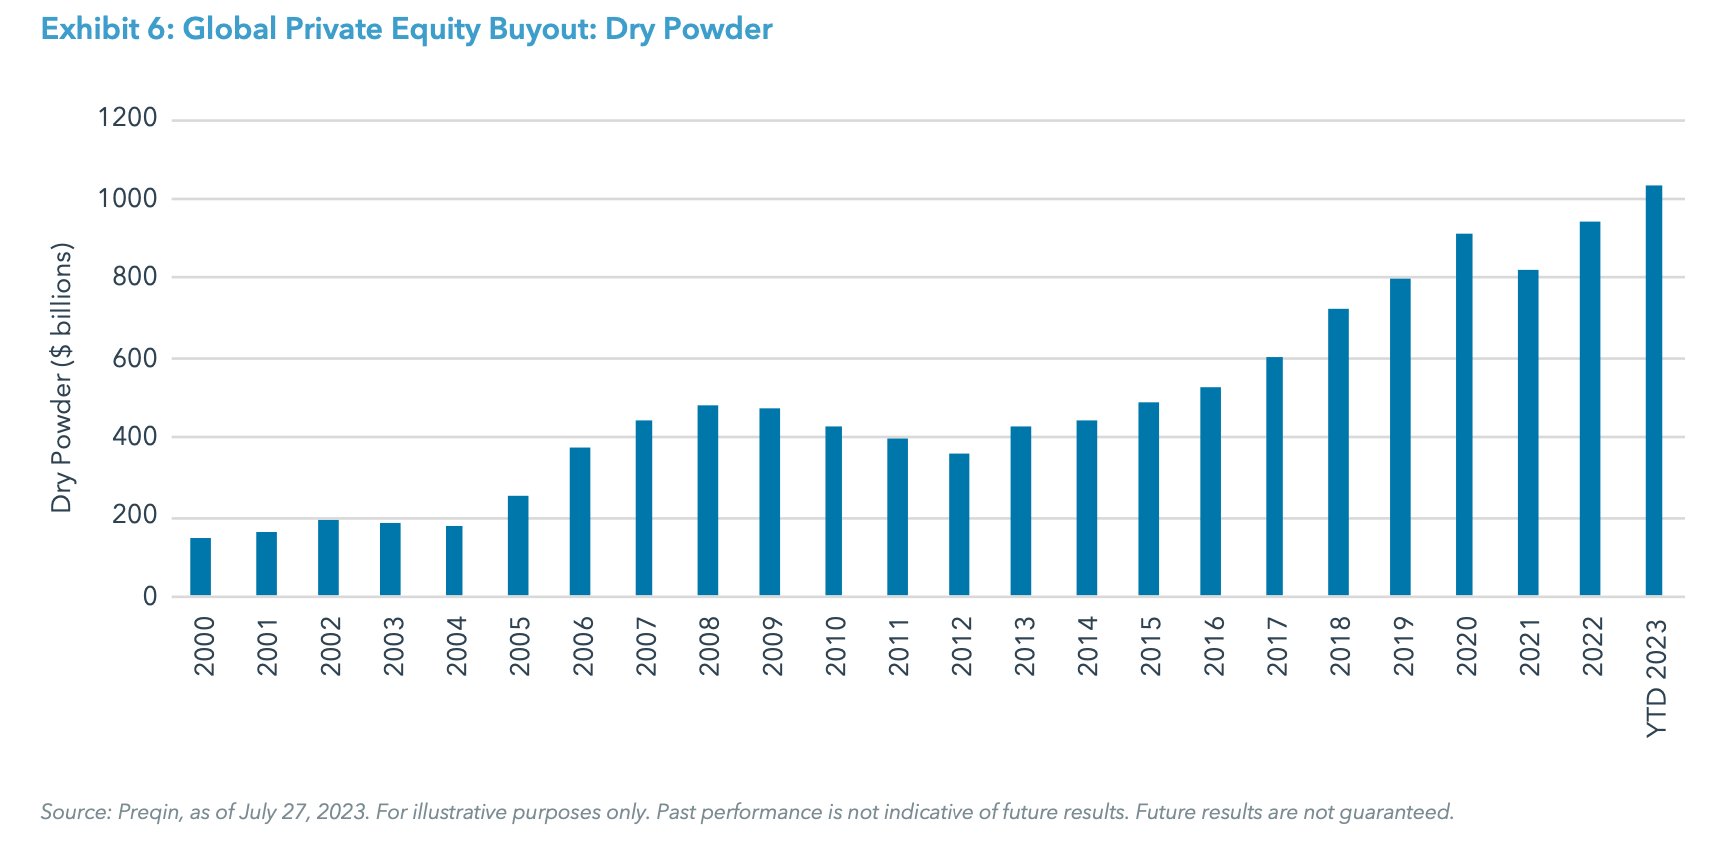
However, we are keeping a keen eye on the amount of dry powder in the private equity buyout ecosystem, which currently stands globally at about $1.1 trillion.22 With the rebound of public markets in the first half of the year,23 signs of the relative easing of inflation, and some green shoots showing in the IPO market, there is a concern that deal valuations will rebound back to the levels they were in late 2021/early 2022. Fundraising for new funds has been slow to date, which is keeping dry powder in check. But as market conditions improve faster than expected, investors’ sentiment towards new deals and new fund commitments will play an important role in valuations for new deals.
REAL ASSETS
Idea #3: Opportunistic Real Estate
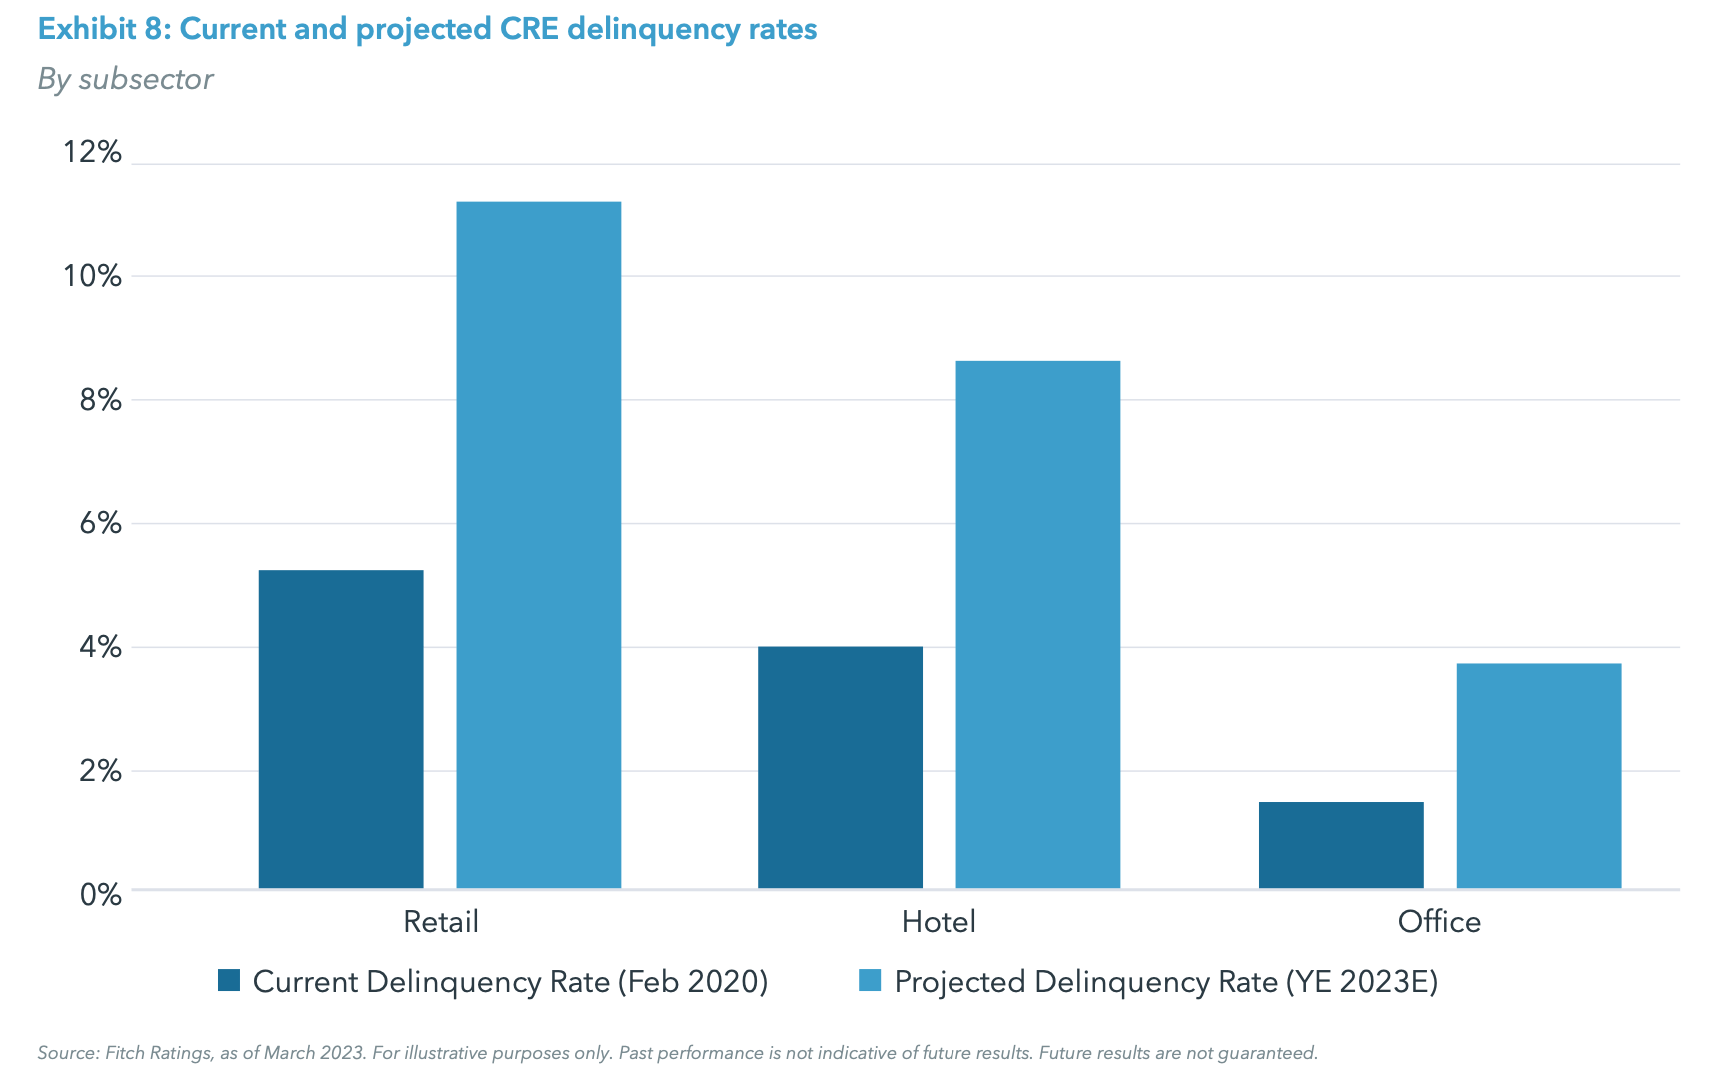
As borrowing costs have risen, cracks have started to appear in the commercial real estate (“CRE”) market, exacerbated by a $1.5 trillion wall of looming loan maturities by the end of 2025,24 and instability among regional banks. Moreover, an economic slowdown could further dampen demand for real estate, increasing the stress on pricing (Exhibit 8). This has led to a CRE sell-off in recent quarters, particularly in the more duration-risk sensitive core and core-plus segments of the market.
Against this backdrop, we believe, a combination of factors makes investing in higher-returning opportunistic real estate very compelling: 1) near-term refinancings at higher rates and less clarity on net income is expected to lead to stress and even distress; 2) ongoing secular shifts and trends within in multifamily, logistics, and office resulting in potentially large property type dispersions; and 3) the chance to deploy fresh capital in a new vintage without the drag of existing assets weighing on returns. In our view, experienced opportunistic real estate managers are positioned to capitalize on opportunities that are experiencing financial and/or operational dislocation, and have the potential to generate returns via improvements and repositioning, rather than raising rents (which is difficult to do in challenging economic environments). Adding an allocation (or increasing an existing allocation) to opportunistic real estate could diversify growth options within a client portfolio.
HEDGE FUNDS
Idea #4: Macro
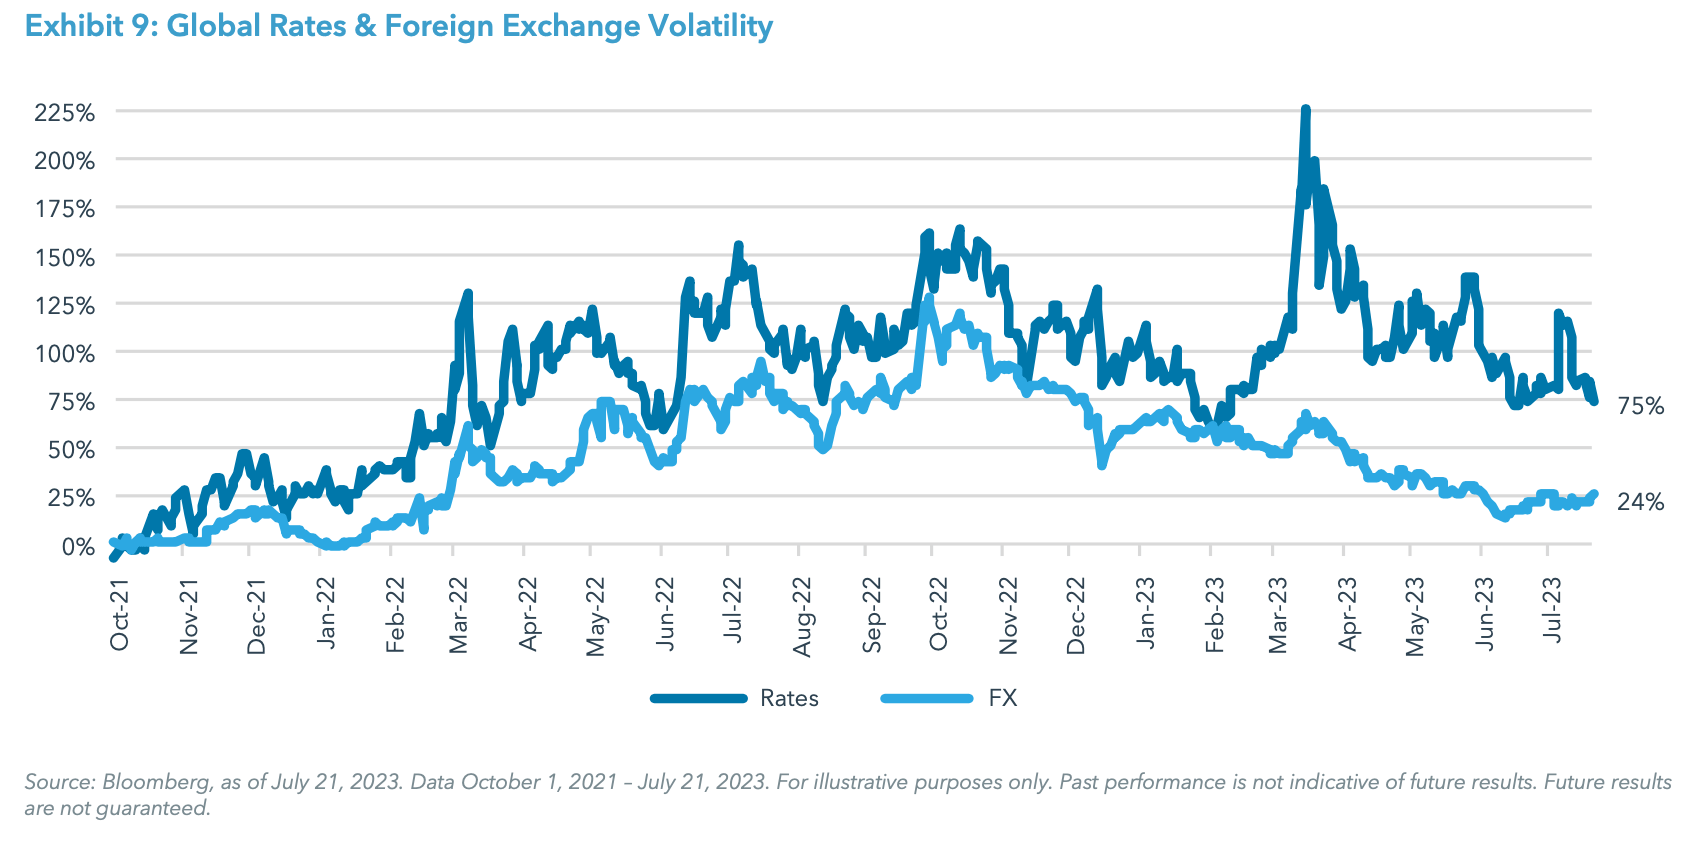
Macro hedge funds invest globally across fixed income, foreign exchange, commodities, and equity markets based on a top down assessment of factors such as economic growth, central banking policies, and geopolitics. These funds have been consistent positive performers in recent years and were the top performing hedge fund category in 2022.25 While most macro managers trade across asset classes, global interest rates and foreign exchange are often key markets for managers to express their views through both relative value and directional trading. As a result, macro hedge funds are often able to take advantage of periods of heightened volatility within the rates and FX markets, as we have witnessed recently (Exhibit 9); and with inflation still stubbornly high in many countries we expect periodic spikes in volatility moving forward, with divergent interest rate policies impacting the relative value of developed and emerging market currencies.
Looking back over 30 years, macro funds have generally produced returns with limited beta and correlation to traditional stocks and bonds, and have tended to perform well during crisis periods, underscoring their diversification benefits in portfolios of traditional assets.26 Although off to a modest start in 2023,27 we continue to have a favorable view for the strategy in an environment characterized by high interest rates, elevated inflation, and uncertainty around economic growth. Should these trends continue as we expect, it will offer an opportunity set for macro practitioners to identify and structure trades with asymmetric risk/return profiles.
STRUCTURED INVESTMENTS
Idea #5: Notes With Downside Protection
As short-term rates remain elevated, we continue to see an opportunity for investors in structured investments. The higher rate for the bond component of a structured investment allows for more funding to be deployed in the underlying options package, offering investors the potential to lock in more attractive enhanced upside and/ or downside protection terms. For example, we are seeing equity-linked income notes offering 40% barrier protection with double digit contingent coupons, providing investors with enhanced income potential while also maintaining downside protection in the event of volatility in the equities market.28
Investors can also gain structured investment exposure through defined outcome funds, which can offer strategic exposure to equities for bullish investors with limited loss exposure. Higher rates have allowed investors to benefit from shorter holding periods and higher upside caps, with certain funds providing for 95% principal protection and a 20-23% upside cap after a two-year maturity.29
The potential to take advantage of attractive structured investment terms in the high rate environment is especially timely as we anticipate nearing the end of the Fed rate hiking cycle. Thus, we think investors would be well positioned to lock in elevated rates now.
ENDNOTES
1. Bloomberg, iCapital Investment Strategy, as of September 1, 2023.
2. Bloomberg, iCapital Investment Strategy, as of September 1, 2023.
3. Bloomberg, iCapital Investment Strategy, as of September 1, 2023.
4. Bloomberg, iCapital Investment Strategy, as of Sept. 1, 2023.
5. Bureau of Economic Analysis, iCapital Investment Strategy, as of Sept. 1, 2023.
6. Bloomberg, iCapital Investment Strategy, as of Sept. 1, 2023.
7. Federal Reserve Bank of New York, “Measuring the Natural Rate of Interest,” as of Aug. 28, 2023.
8. Bloomberg, iCapital Investment Strategy, as of Sept. 1, 2023.
9. Federal Reserve, “Structural Shifts in the Global Economy,” Speech by Fed Chair Powell, Aug. 25, 2023.
10. Bloomberg, iCapital Investment Strategy, as of Sept. 1, 2023.
11. Bloomberg, Goldman Sachs, Federal Reserve, iCapital Investment Strategy, as of Sept. 1, 2023.
12. JPMorgan, as of Aug. 23, 2023.
13. Bloomberg, iCapital Investment Strategy, as of Sept. 1, 2023.
14. Bloomberg, iCapital Investment Strategy, as of Sept. 1, 2023.
15. Bloomberg, iCapital Investment Strategy, as of Sept. 1, 2023.
16. Bloomberg, as of August 31, 2023.
17. Preqin, iCapital Investment Strategy, as of Aug. 28, 2023. Note: Private Equity returns are based on Preqin Private Capital Quarterly Indices which includes over 13,000 fund constituents and captures in an index the return earned by investors on average in their private capital portfolios, based on the actual amount of money invested in private capital partnerships. It is important to note that the private market returns listed are based on an index which is meant to estimate the asset class performance, hypothetically creating a return if one had access to all active funds. Preqin Private Capital Quarterly Indices are not practically investable and are subject to change as datasets are continually updated.
18. Pitchbook, as of June 30, 2023.
19. Fitch Ratings U.S. LevFin Default Forecasts, as of May 2023.
20. “Fed increases rates a quarter point and signals a potential end to hikes.” CNBC. May 30, 2023.
21. Capstone Partners, “Capital Markets Update – Q1 2023,” June 13, 2023.
22. Preqin, as of July 27, 2023.
23. Bloomberg, as of June 30, 2023. S&P 500 up 15.9% and Nasdaq up 31.7%.
24. Morgan Stanley Credit Strategy, “Scaling Maturity Walls,” April 2023.
25. HFR via eVestment, as of March 31, 2023.
26. HFR via eVestment, as of March 31, 2023.
27. HFR via eVestment, as of June 30, 2023.
28. SIMON from iCapital, as of August 31, 2023.
29. SIMON from iCapital, as of August 31, 2023.
DEFINITIONS
HFRI Institutional Macro Index: The HFRI Institutional Macro Index is a global, equal-weighted index of hedge funds with minimum assets under management of USD $500MM which report to the HFR Database and are open to new investments. The Macro funds that comprise the index are a subset of the HFRI Institutional Fund Weighted Composite Index.
Nasdaq Index: The Nasdaq Composite Index is a market capitalization-weighted index of more than 2,500 stocks listed on the Nasdaq stock exchange. It is a broad index that is heavily weighted toward the important technology sector. The index is composed of both domestic and international companies.
S&P 500 Index: The S&P 500 is widely regarded as the best single gauge of large-cap U.S. equities. The index includes 500 of the top companies in leading industries of the U.S. economy and covers approximately 80% of available market capitalization.
IMPORTANT INFORMATION
The material herein has been provided to you for informational purposes only by Institutional Capital Network, Inc. (“iCapital Network”) or one of its affiliates (iCapital Network together with its affiliates, “iCapital”). This material is the property of iCapital and may not be shared without the written permission of iCapital. No part of this material may be reproduced in any form, or referred to in any other publication, without express written permission of iCapital.
This material is provided for informational purposes only and is not intended as, and may not be relied on in any manner as, legal, tax or investment advice, a recommendation, or as an offer or solicitation to buy or sell any security, financial product or instrument, or otherwise to participate in any particular trading strategy. This material does not intend to address the financial objectives, situation, or specific needs of any individual investor. You should consult your personal accounting, tax and legal advisors to understand the implications of any investment specific to your personal financial situation.
ALTERNATIVE INVESTMENTS ARE CONSIDERED COMPLEX PRODUCTS AND MAY NOT BE SUITABLE FOR ALL INVESTORS. Prospective investors should be aware that an investment in an alternative investment is speculative and involves a high degree of risk. Alternative Investments often engage in leveraging and other speculative investment practices that may increase the risk of investment loss; can be highly illiquid; may not be required to provide periodic pricing or valuation information to investors; may involve complex tax structures and delays in distributing important tax information; are not subject to the same regulatory requirements as mutual funds; and often charge high fees. There is no guarantee that an alternative investment will implement its investment strategy and/or achieve its objectives, generate profits, or avoid loss. An investment should only be considered by sophisticated investors who can afford to lose all or a substantial amount of their investment.
STRUCTURED INVESTMENTS ARE CONSIDERED COMPLEX PRODUCTS AND MAY NOT BE SUITABLE FOR ALL INVESTORS. Please note that there is no public secondary market for structured investments. Although the issuer may from time to time make a market in certain structured investments, the issuer does not have any obligation to do so and market making may be discontinued at any time. Accordingly, an investor must be prepared to hold such investments until maturity. Any or all payments are subject to the creditworthiness of the issuer. Before investing in any product, an investor should review the prospectus or other offering documents, which contain important information, including the product“s investment objectives or goals, its strategies for achieving those goals, the principal risks of investing in the product, the product“s fees and expenses, and its past performance.
iCapital Markets LLC operates a platform that makes available financial products to financial professionals. In operating this platform, iCapital Markets LLC generally earns revenue based on the volume of transactions that take place in these products and would benefit by an increase in sales for these products.
The information contained herein is an opinion only, as of the date indicated, and should not be relied upon as the only important information available. Any prediction, projection or forecast on the economy, stock market, bond market or the economic trends of the markets is not necessarily indicative of the future or likely performance. The information contained herein is subject to change, incomplete, and may include information and/or data obtained from third party sources that iCapital believes, but does not guarantee, to be accurate. iCapital considers this third-party data reliable, but does not represent that it is accurate, complete and/or up to date, and it should not be relied on as such. iCapital makes no representation as to the accuracy or completeness of this material and accepts no liability for losses arising from the use of the material presented. No representation or warranty is made by iCapital as to the reasonableness or completeness of such forward-looking statements or to any other financial information contained herein.
Securities products and services are offered by iCapital Markets, an SEC-registered broker-dealer, member FINRA and SIPC, and an affiliate of iCapital, Inc. and Institutional Capital Network, Inc. These registrations and memberships in no way imply that the SEC, FINRA, or SIPC have endorsed any of the entities, products, or services discussed herein. Annuities and insurance services are provided by iCapital Annuities and Insurance Services LLC, an affiliate of iCapital, Inc. “iCapital” and “iCapital Network” are registered trademarks of Institutional Capital Network, Inc. Additional information is available upon request.
©2024 Institutional Capital Network, Inc. All Rights Reserved. | 2024.01


