In our 2025 Outlook, we wrote that we expected this year to be characterized by solid underpinnings with plenty of wild cards. With the first half now behind us, we believe this is largely how the landscape has evolved. Economic growth has remained resilient, despite the risks, and policy uncertainty – namely around trade/tariffs – has fueled bouts of market volatility. Indeed, we experienced a 20+% peak-to-trough decline, and the VIX index has averaged 21.2 so far year-to-date (YTD), compared to 15.5 in 2024.1 Yet, despite this increased volatility, the S&P 500 was up +6% in the first half of the year.2
As we start the second half of the year, investors are faced with many questions about how the outlook for the economy and markets will evolve from here. These include: What are the tail risks to markets? Is this the end of U.S. exceptionalism? When will the Fed cut? How will the Trump Administration’s trade policy evolve in the second half of the year? And how should we think about fixed income given credit spreads are so tight?
However, despite these questions, we believe a favorable macro environment, less policy uncertainty, and the Fed returning to a rate cutting mode should, collectively, be supportive of risk assets for the remainder of the year. This environment should favor an allocation to alternatives, specifically middle market private equity, infrastructure and asset-based lending. Within public markets, cyclical sectors, namely financials and industrials, should benefit.
What are the tail risks for markets in the second half of the year?
With markets near all-time highs as we start the second half of the year, investors are attempting to understand the market’s upside and downside risks.
Right-tail (Upside) Risk: As stated here, we avoided the worst case scenario and sentiment around the markets and the economy has recovered. But, heading into the second half of the year, we could potentially witness more certainty around trade, monetary, and fiscal policy. Even if the Trump Administration does kick the can down the road on the July 9th reciprocal tariff deadline, we still think there is an impetus to get deals done. In addition, as we move into the second half of the year, we will have more certainty around fiscal policy as President Trump signed into law the extension of the Tax Cuts and Jobs Act (TCJA) or the One Big Beautiful Bill Act (OBBBA) by their self-imposed July 4th deadline. Based on initial estimates, this could boost GDP growth by 0.2% this year.3 Finally, markets are pricing in roughly 2.5 cuts in the second half of the year, which should help ease financial conditions.4
If we get a more supportive policy environment, as economic growth remains resilient, and service prices continue to disinflate, this could give way to a “Goldilocks” environment – similar to what we saw in 2017 when the Trump Administration signed into law the TCJA.
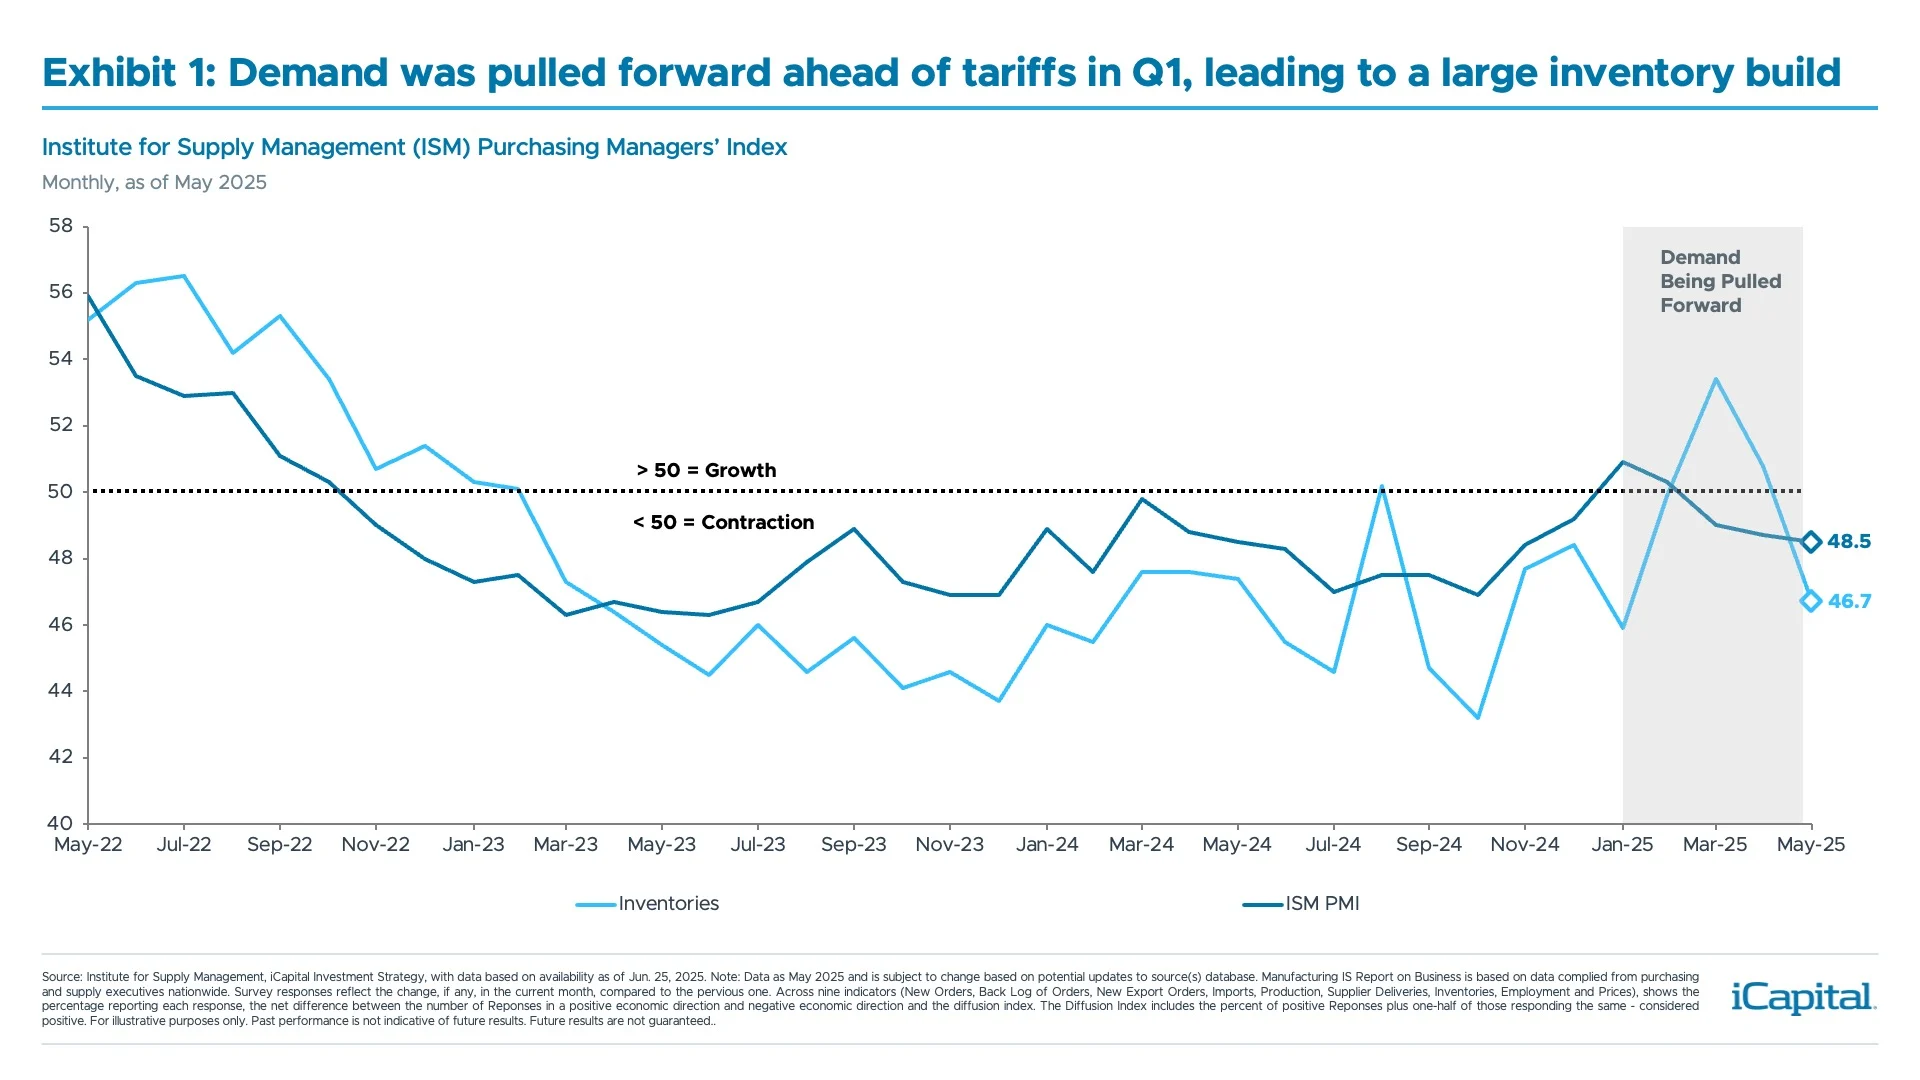
Left tail (Downside) Risk: While growth has held up so far YTD, there is still a chance the resilient hard data we have seen could have been supported by an inventory build in the first quarter. Indeed, if we look at imports into the U.S. in the first quarter, they grew by 37.9% QoQ SAAR.5 We also saw inventories for manufacturing firms rebound quite sharply in the first quarter, only to reverse back into a contraction, as seen in Exhibit 1. Given firms were trying to front run tariffs in the first quarter, demand may have been artificially supported. Therefore, there is the potential for growth to weaken in the second half of the year, as seen with GDP forecasts for Q3 and Q4 that stand at 0.8% and 1.2% QoQ SAAR, respectively.6
The other risk in this scenario is that tariff prices start to make their way through the economy as growth weakens, i.e. stagflation. If prices do remains sticky, the Fed will likely remain in a “wait and see mode” which could weigh on interest rate sensitive parts of the market and the economy, not to mention risk sentiment – low quality sectors and groups have outperformed since rates peaked on 5/22.7
In addition, we are also entering a very weak seasonal period of the calendar. August to October is typically the weakest three-month period for markets, where the average return is -2.4%, which compares to the 2.0% average for the remaining rolling three-month periods during the calendar year.8
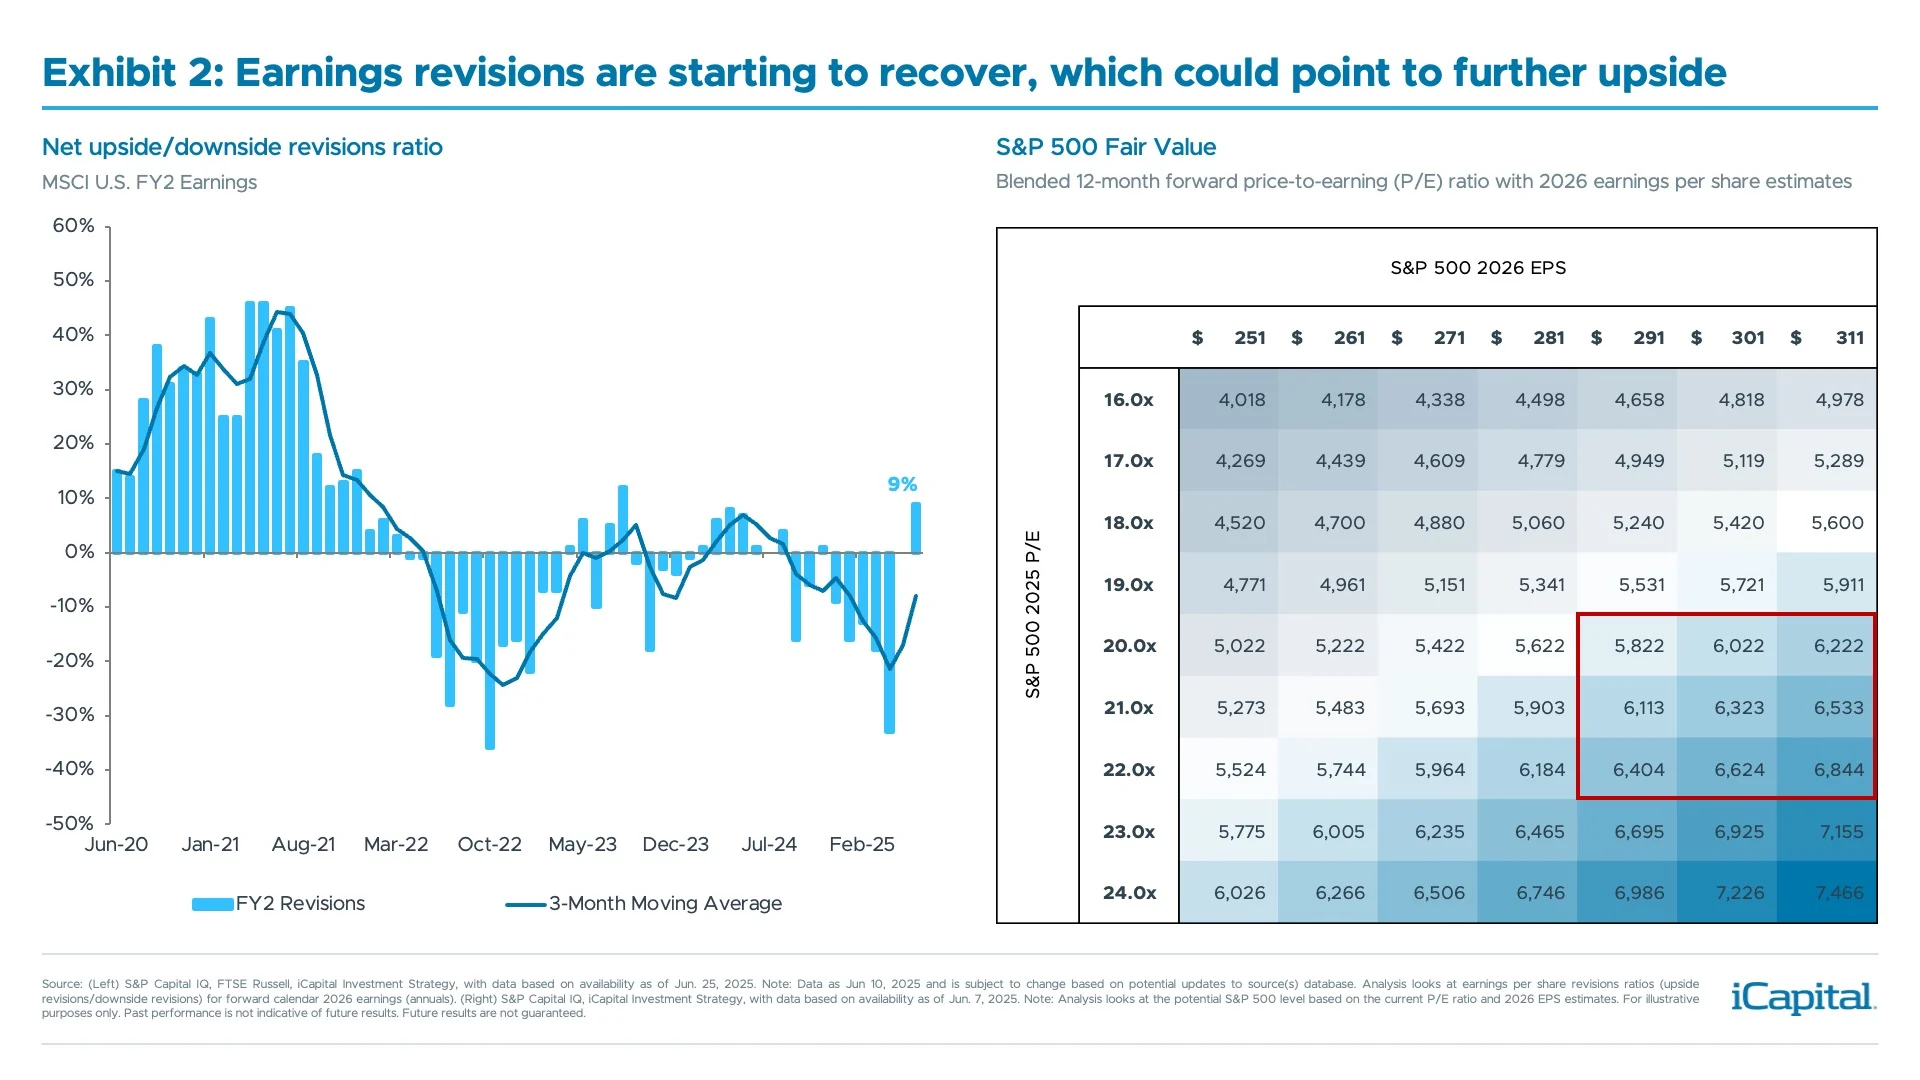
Our Thoughts: While we acknowledge there are risks to our second half market outlook which may lead to bouts of volatility, we think the balance of risks skew to the right-tail or upside. Ultimately, as we gain further policy certainty, economic growth remains resilient, and service price disinflation offsets any boost coming from tariffs, this should be supportive of markets. As we have already seen a recovery in earnings revisions, 2026 earnings per share estimates seem more achievable. Therefore, if we realize $301 earnings in 2026, the fair value of the S&P 500 would be around 6,400 – 6,600, as seen in Exhibit 2, which presents additional upside from the current level of around 6,200.9
When will the Fed cut rates?
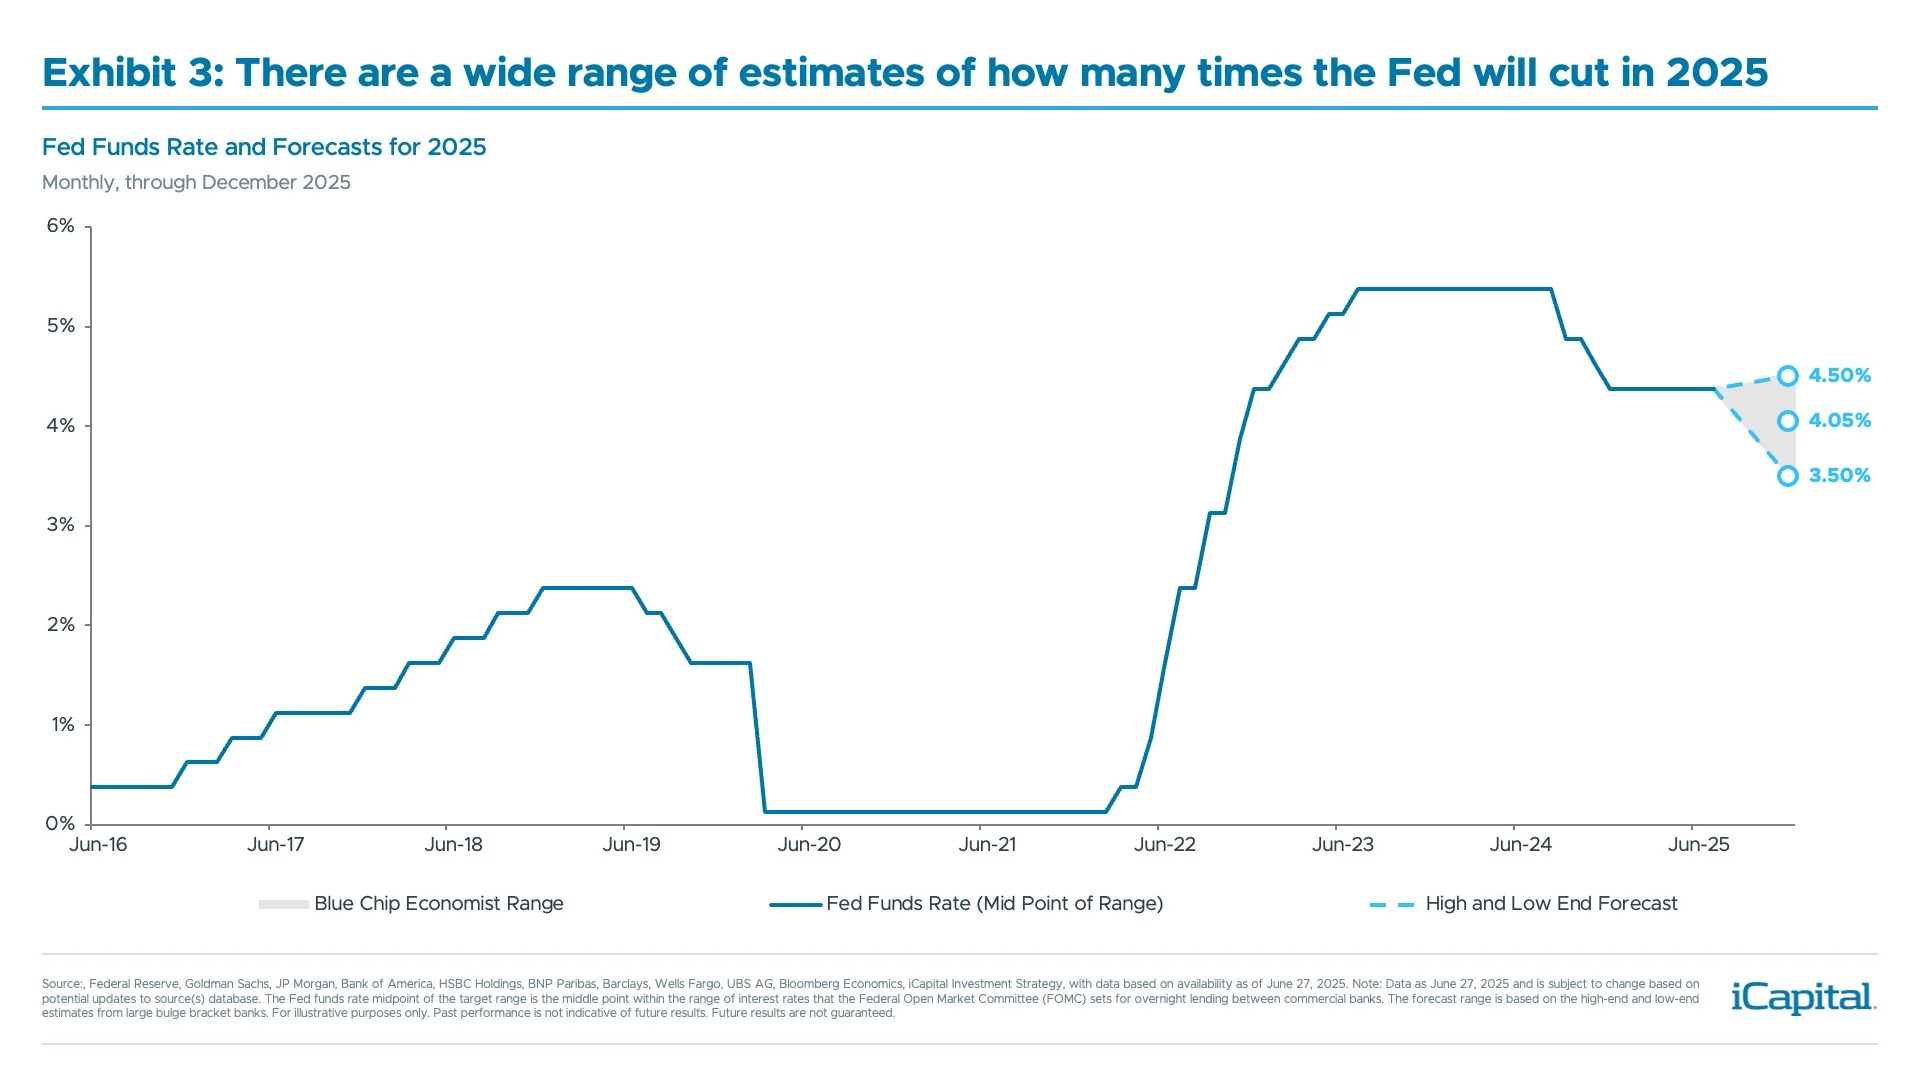
Based on the recent FOMC meeting and comments from various Fed Governors, it seems the Fed may continue to be on hold for some time, which begs the question, when will they restart the easing cycle? Markets are currently pricing in the first full rate cut for September, with a total of about 2.5 cuts for the remainder of the year.10 However, given the current backdrop, various sell-side economists have a slightly more hawkish view as some forecast that the Fed will not cut rates this year.11 But, there are also members of the Fed, who believe they could cut as soon as their July meeting – Governors Waller and Bowman.12 Even Fed Chair Powell alluded to this in his recent testimony to Congress: “If it turns out that inflation pressures do remain contained, then we will get to a place where we cut rates, sooner rather than later.”13 Given the challenging backdrop, this is one of the reasons why we see a wide distribution of the Fed’s rate projections for the remainder of the year – there is a 1% difference between the high-end and low-end year-end forecast from sell-side economists as seen in Exhibit 3.14
However, when thinking about rate cuts, we think it is important to determine the difference between a “good cut” and a “bad cut.”
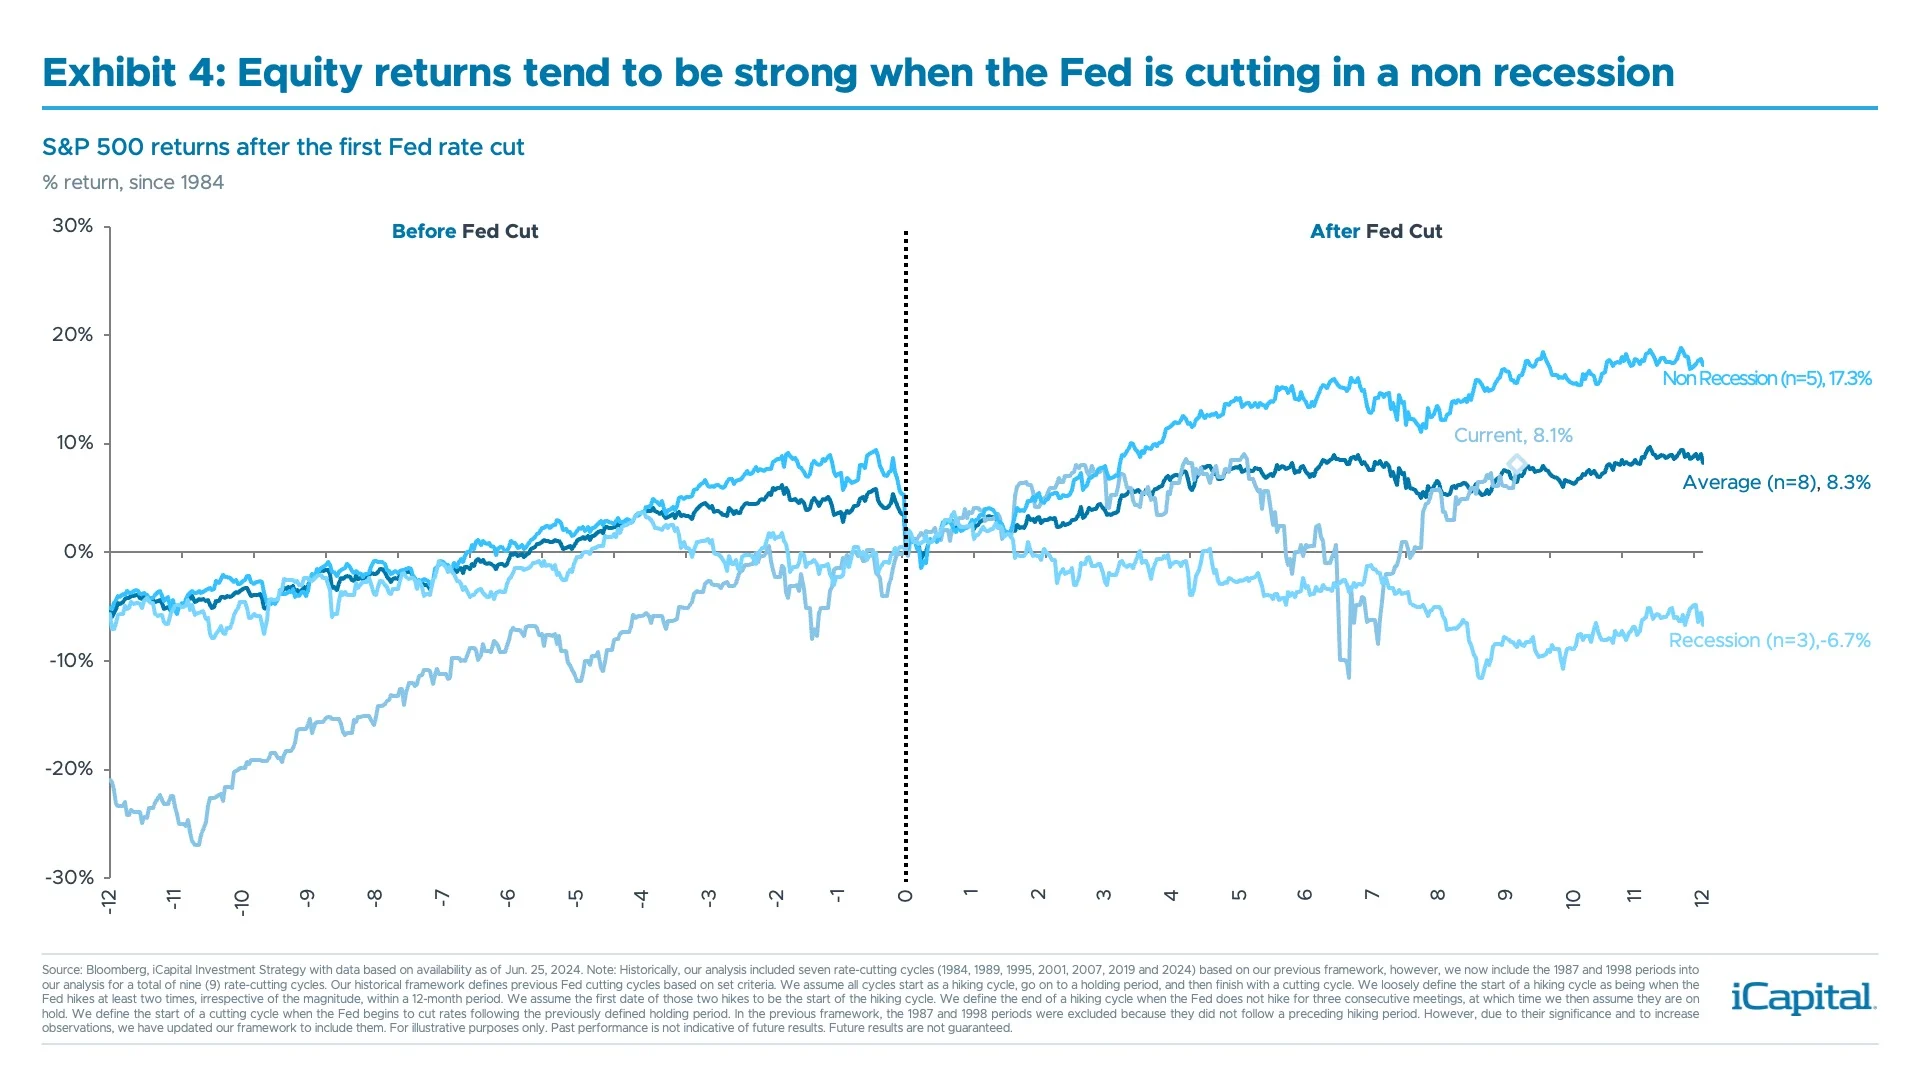
Good Cut: The Fed would be responding to service disinflation outweighing any pass through from tariffs, allowing inflation to return to the Fed’s target more quickly than initially anticipated. At the same time, if the U.S. economy remains around trend growth, the Fed would be able to lower its policy rate to a neutral setting. These rate cuts would be more pro-active and should further support the “soft-landing” environment (non-recession) and thereby financial markets, as seen in Exhibit 4.
Bad Cut: These cuts would be more reactive in nature, as the Fed would be responding to weakness either in the economy or labor markets, i.e., the Fed falls behind the curve. If the Fed is responding to a weakening labor market – employment growth has slowed but has not deteriorated – it will be challenging for the Fed to keep up as the unemployment rate usually continues to trend higher – the Sahm rule. If the labor market or economy continues to weaken, even with the Fed cutting, this would still likely weigh on markets, as again seen in Exhibit 4.
Our Thoughts: We think the Fed will deliver on rate cuts by its September or October meeting. We think these cuts will be more aligned with “good cut(s)” as it appears the inflation pass through from tariffs will not be as large as anticipated earlier in the year. This should allow the Fed to return policy to a neutral setting. Given Exhibit 4, this environment should be supportive of equity market returns.
Is this the end of U.S. exceptionalism?
U.S. assets underperformed in the first half of the year with the U.S. dollar down 11.6% YTD15 and U.S. equities trailing global equities by 13.3%16 is raising the question: is this the end of U.S. exceptionalism?
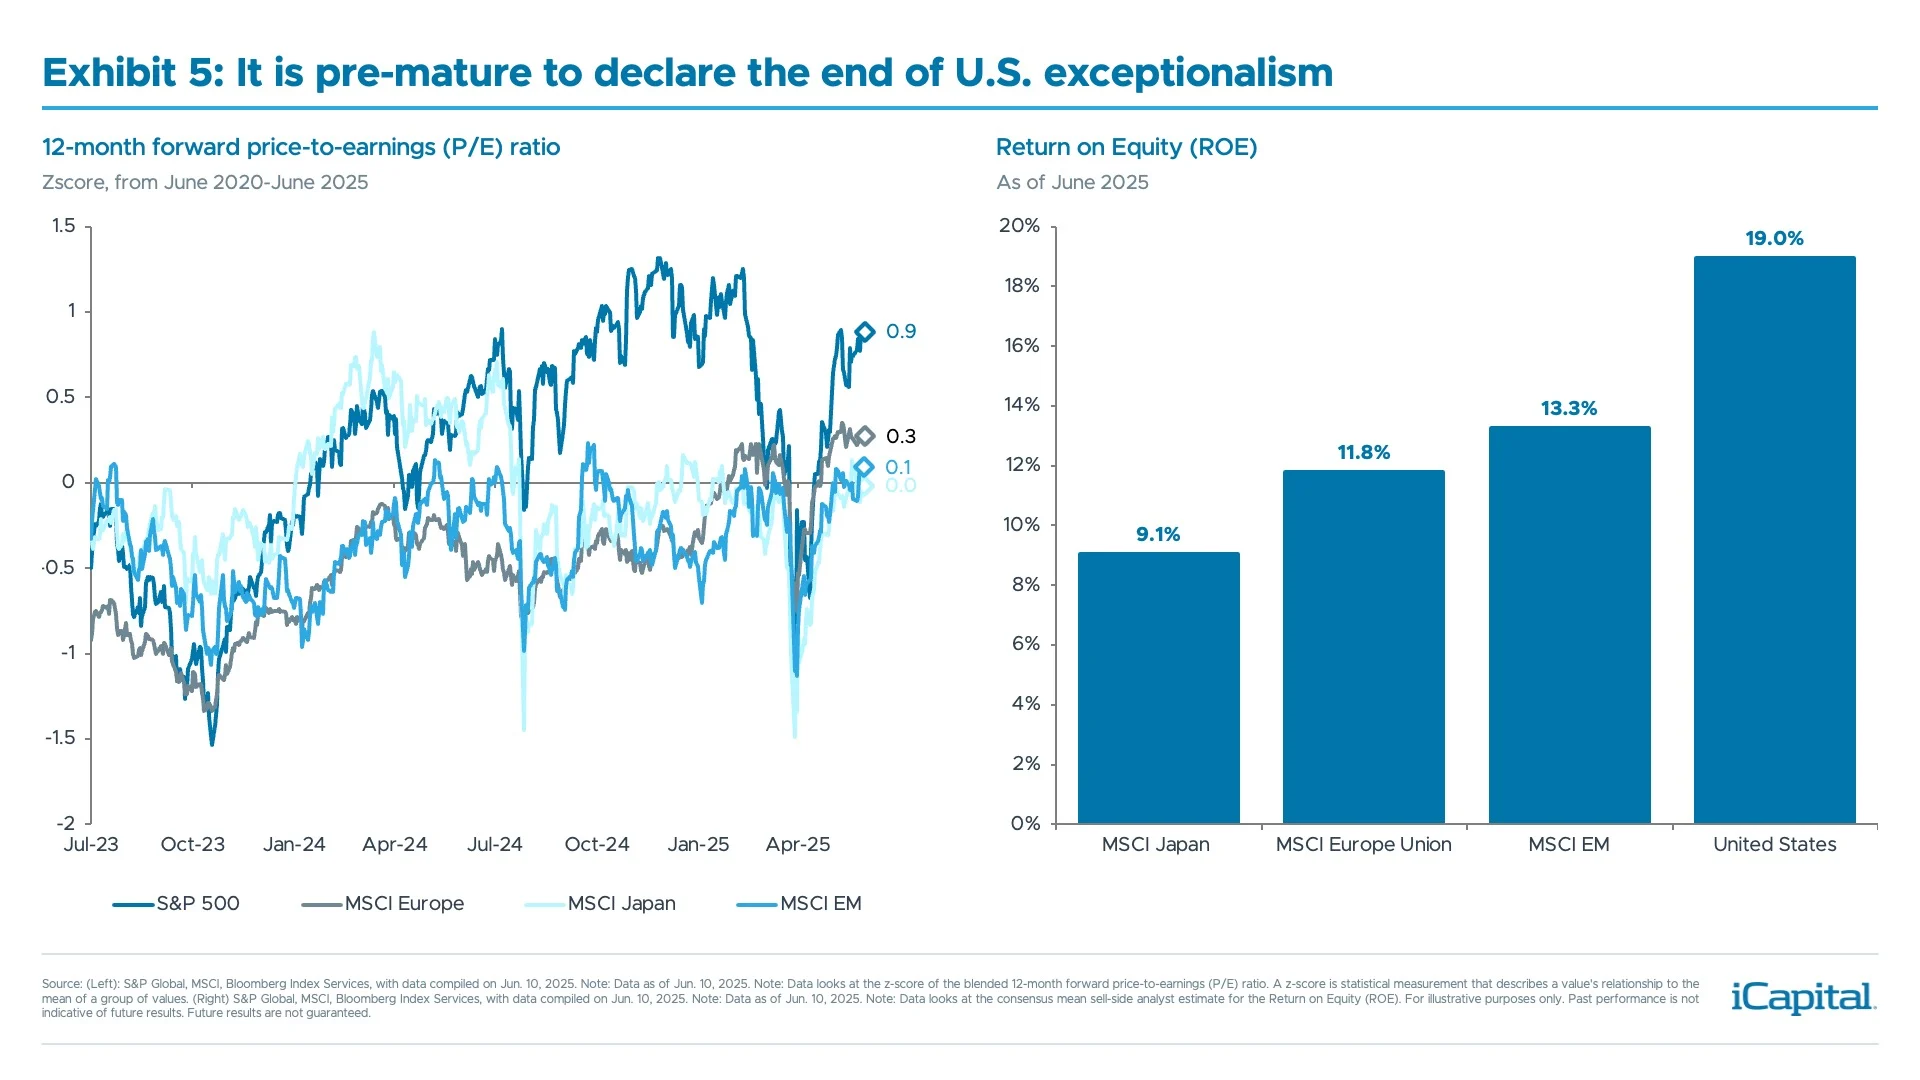
Despite the underperformance of U.S. assets, we believe it is pre-mature to declare the end of U.S. exceptionalism. In fact, we see three reasons why this is not the case.
- The data doesn’t support the narrative: Based on the latest auction data, indirect (foreign) allocations are healthy and remain above prior auction levels. This continues to show that foreign participants still want to allocate to U.S. assets.
- There’s a lack of viable substitutes: U.S. capital markets are some of the deepest and most liquid markets in the world. Given other markets around the globe are not as deep and liquid, we think it will be hard for large allocators (central banks, sovereign wealth funds and insurance firms) to find viable options to replace their USD assets and Treasury allocations.
- Market composition: While U.S. markets have traded at rich valuations, especially compared to non-U.S. markets, this divergence is largely the result of the composition of U.S. equity markets. Indeed, the U.S. has more exposure to large cap tech and growth sectors – 78% of the global publicly traded tech sector market cap is in the U.S.17 Given this, the return-on-equity for U.S. markets is much higher than other non-U.S. markets, as seen in Exhibit 5. So, while the U.S. valuation may be elevated at 22x on a forward price-to-earnings (P/E), we think the U.S. can sustain higher valuations, especially when compared to non-U.S. markets.18 In fact, the average 5-year forward P/E ratio on the S&P 500 is 20.0x.19 In addition, the last reporting season highlighted that demand for AI remains strong. As AI adoption continues to grow, as evidenced by 9.2% of U.S. firms using AI to produce goods and services, this should continue to support the tech sector and Mag 7 names, which would help close some of the underperformance relative to non-U.S. markets.20
Our Thoughts: In the second half of the year, we may see periods of non-U.S. outperformance, similar to what we saw in 2017. Importantly, if the U.S. Dollar continues to weaken as the Fed starts to cut rates, this should remain a tailwind for non-U.S. markets. However, we continue to think the key factor will be how the AI theme and Mag 7 names perform. If these names outperform in the second half of the year, U.S. assets should be able to close some of the YTD underperformance vs. non-U.S. assets.
How will trade policy evolve for the rest of the year?
Liberation Day was quite a shock to the markets, as equities traded 13% lower to their April 7th low and the VIX reached 60.13.21 However, trade policy has since turned more positive given the reciprocal tariffs 90-day pause, the deal with the UK and reduced retaliatory tariffs on China. Nonetheless, as we approach the reciprocal tariffs July 9th deadline, there is still uncertainty surrounding how trade policy will evolve for the remainder of the year.
We believe the Trump Administration is focused on trying to get deals done. Indeed, the administration has negotiated three trade agreements with the UK, China and now Vietnam since the 90-day pause. While coming deals may be more difficult to reach, we think the administration may look to phased deals or “agreements in principle” with engaged countries ahead of the July 9th deadline, especially as the administration has stated that we would see deals after the passage of the tax bill.22
While Barron’s coined the term the TACO trade, “Trump Always Chickens Out”, there is still a risk that if the administration doesn’t believe negotiations are happening in good faith, or quickly enough, they could threaten a higher tariff rate. We saw this in May when President Trump threatened a 50% tariff on the EU.23 Indeed, President Trump has threatened higher tariff rates (either the reciprocal rate announced on April 2nd, or a 70% rate) on 12-15 trading partners ahead of the July 9th deadline.24
Our Thoughts: We believe that we will start to see more trade deals reached in the second half of the year. While it is unclear how long the pause on reciprocal tariff rates will last, we think it is important to focus on the direction of travel, and it currently appears that events are moving in the right direction.
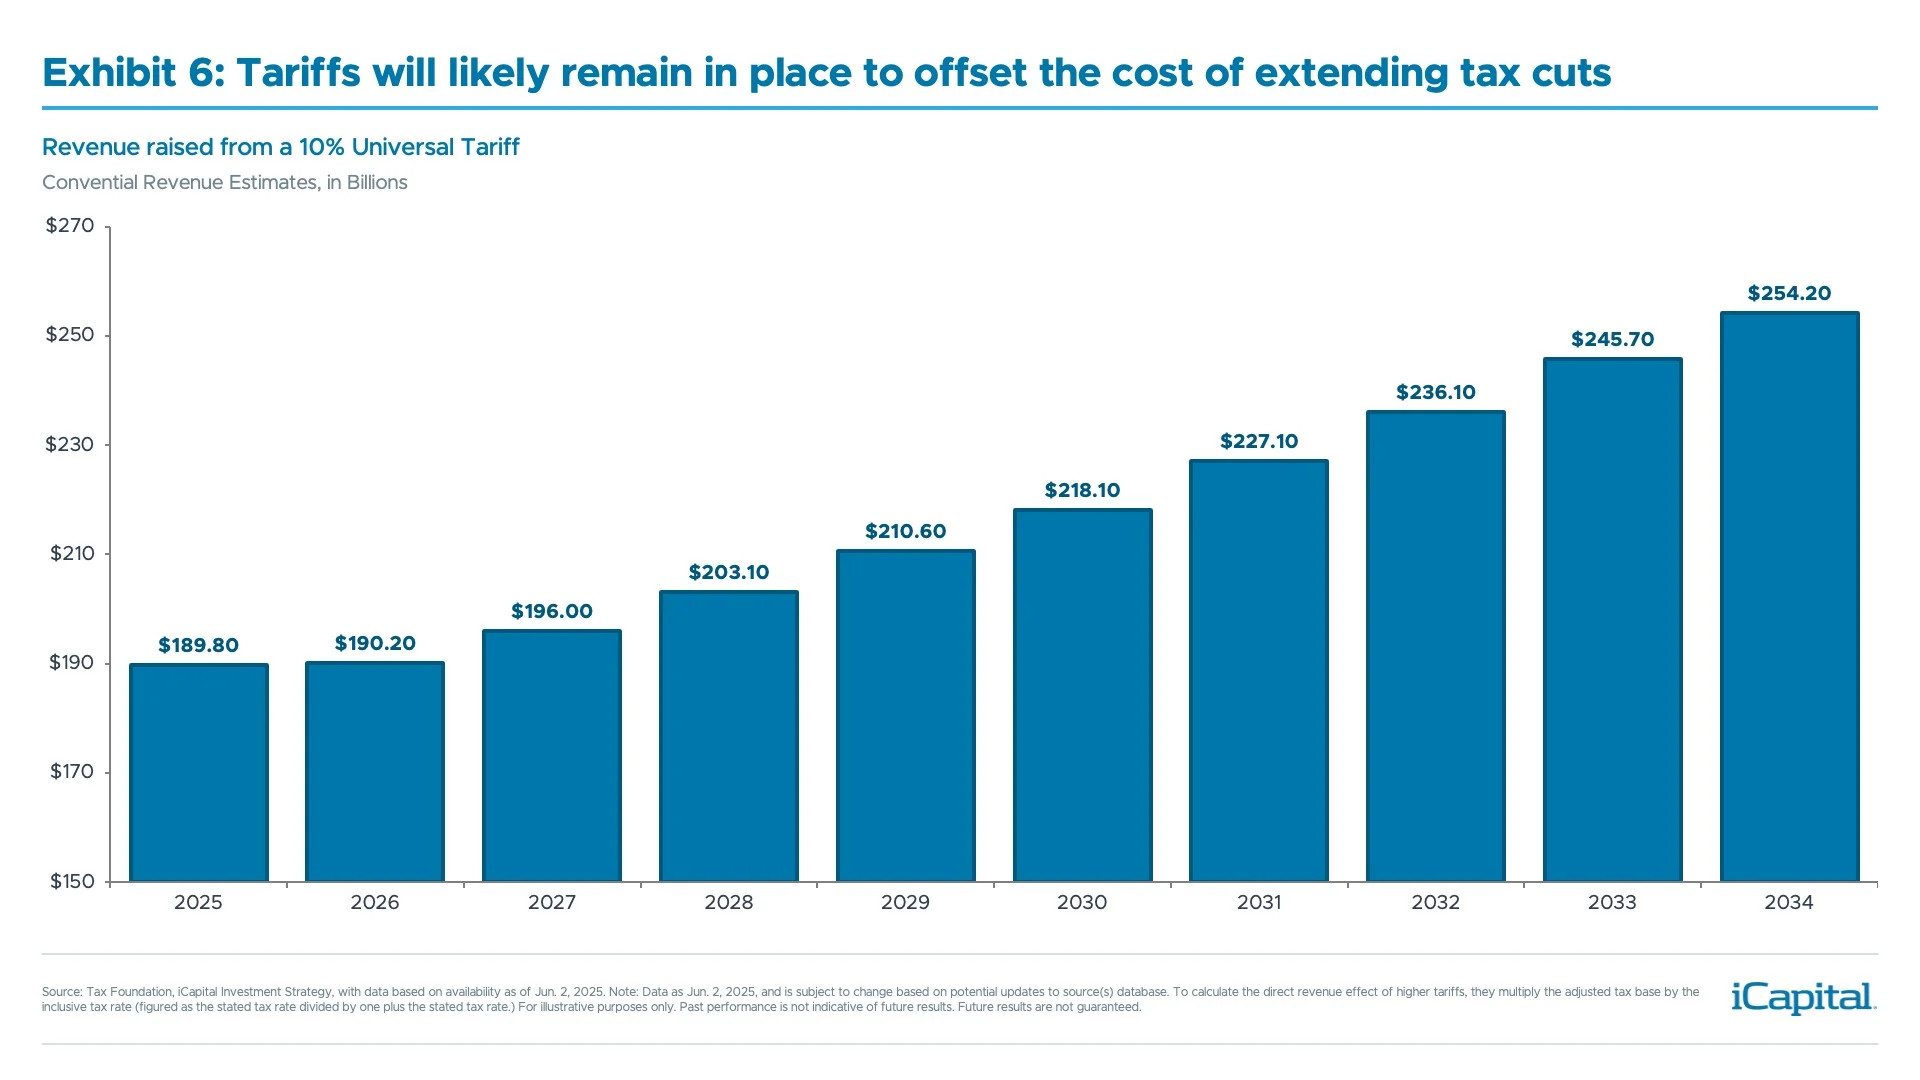
While the effective tariff rate will be lower compared to Liberation Day levels, we also think 10% represents a floor for how low tariffs will go. As seen in Exhibit 6, tariffs are expected to raise a little over $2 Trillion which should help offset some of the cost of the extension of the TCJA (or OBBA).25 Compared to what was forecasted in April, we think a 10% universal tariff will be more manageable, as it would not have as large of an impact on the markets, earnings and the economy.
How to think about public and private credit when spreads and the total yield story aren’t as attractive?
Across the credit space, spreads have been tight. Indeed, both investment grade and high-yield credit spreads are near multi-decade tights. However, this is not just limited to public markets. Given the amount of dry powder chasing a limited number of deals, this has started to weigh on yields in Private Credit – which are down slightly from their highs in 2024, albeit direct lending yields remain more attractive than what we are seeing in publicly traded corporate credit markets. Given the yield picture might not be as attractive for public and private credit, how should investors be thinking about their portfolio exposure?
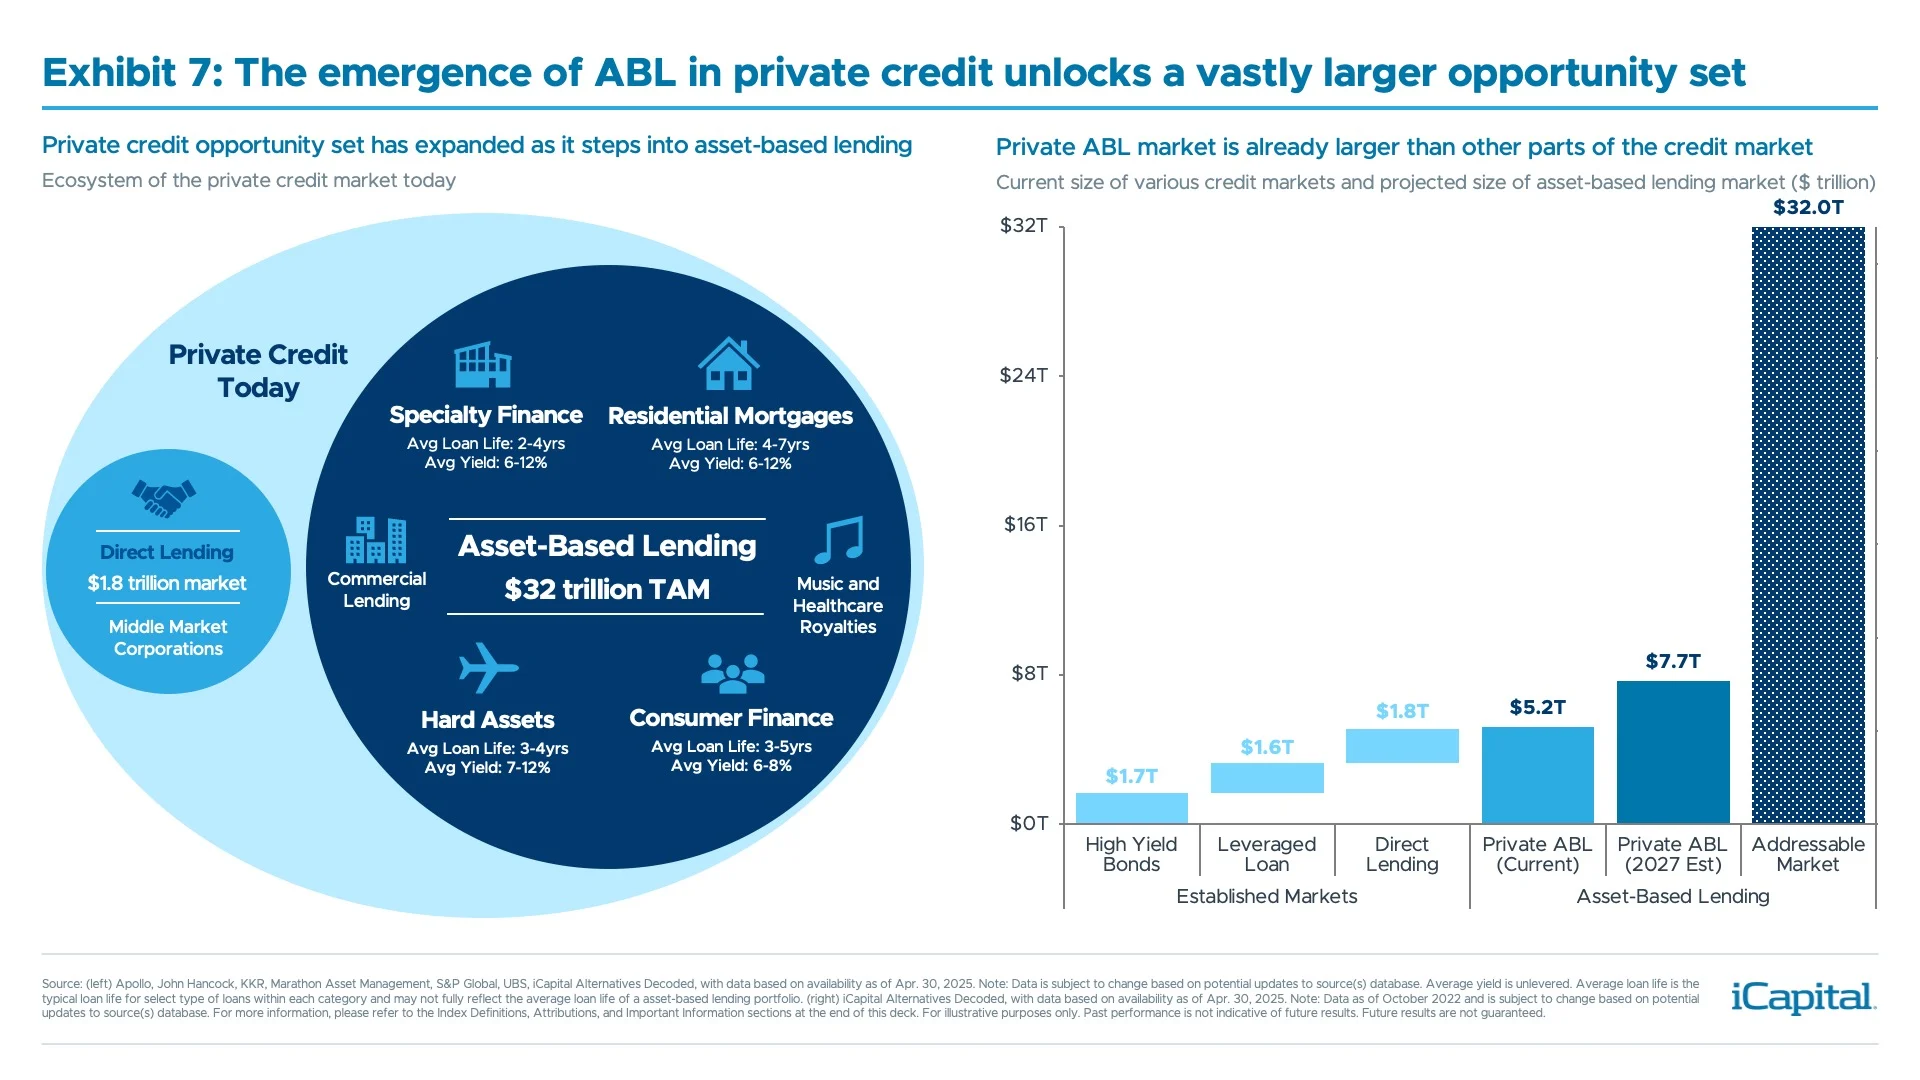
While there might be a limited number of deals coming to market, there is a broader opportunity set in asset-based lending (ABL). Indeed, the total addressable market (TAM) for ABL is $32 trillion, which compares to the $1.8 trillion TAM for direct lending as seen in Exhibit 7.26 Even with the bigger market opportunity for ABL, the penetration rate is still very low, as dedicated offerings only represent 2.5% of the total market, which compares to the ~55% for direct lending.27
In addition, given these loans are backed by hard assets, this also provides a few advantages. First, many of these loans are self-amortizing, meaning that the principle is returned over the life of the investment, versus having to wait for a realization event. Second, the underlying collateral should also provide downside protection, as ABL has an average loss rate of 10 to 20 bps, which compares to 100 bps for direct lending.28
Our Thoughts: With public credit spreads at historically tight levels, and the yields for direct lenders likely capped by the large amount of dry powder chasing limited deal activity, we think investors should be looking into the ABL opportunity. Given the large size of the market, especially compared to direct lending, we believe investment managers should be able to get improved terms and deliver better risk-adjusted returns. In addition, investment managers with flexible mandates should also benefit from the diverse nature of the market, as they can diversify income streams by collateralizing loans with differentiated assets such as real estate, inventory, aircraft leasing, royalties, etc., as seen in Exhibit 7. This compares favorably to direct lending and public fixed income which just provide investors exposure to corporate credit.
How to think about your portfolio allocations in the second half of the year?
Given all of these questions, how should we be thinking about portfolios? First, while there is still a chance that we could see spikes in volatility – given many of the wildcards that remain in place – we continue to see an environment that should be supportive of risk assets across public and private markets. We think the second half of 2025 will be defined by more clarity around trade/fiscal policy, the Fed restarting its rate cutting cycle and economic growth remaining resilient. Given this backdrop, this is how we would be thinking about portfolio allocations in the second half of the year.
Private Markets
Gaining more certainty around policy should be broadly supportive for alternatives as it should lead to a pick-up in exit activity, as we discussed here. Given the recovery in activity in Q2, we would expect further policy certainty to help this momentum continue in Q3 and Q4. This would provide backing to Middle Market Buyout, which should not only benefit from a pick-up in exit activity, but also from valuations that are in line or at a slight discount relative to Large Buyout – which can be meaningful when scaled across large portfolios.
In addition, the current environment should also be supportive of infrastructure and ABL. While the structural opportunity set remains attractive for infrastructure, there are also tactical tailwinds coming from the build out of data centers. Indeed, spending on construction for data centers is expected to reach $49 billion by 203029 and data center demand growth is expected to grow from 3% of total power demand in the US to 8% by the end of the decade.30
Given the tight spreads in public credit markets and direct lending yields just off their highs, this should benefit ABL. The broader opportunity set in ABL should enable investment managers to obtain favorable terms and generate better-risk-adjusted returns for investors. In addition, the asset-backed nature of the loans allows for the principal to be paid over the life of the loan and should help limit the loss rate.
Public Markets
We still see market upside in the second half of the year. In fact, if we do return to more of a “goldilocks” environment, we think this would aid a broadening out of equity markets – only 51 names were responsible for all the S&P 500 gains in the first half of the year – and in select cyclical sectors as we discussed here.31 This would be similar to the end of 2023, when inflation appeared to be returning to target, markets were starting to price in Fed rate cuts, and the 10-year yield also started to decline, all of which contributed to broader equity market participation.
Resilient economic growth and the Trump Administration’s deregulatory policies and push to onshore manufacturing should be advantageous for both Financials and Industrials – helping them build on their outperformance in the first half of the year.
Bottom-line: The second half of the year looks more favorable, and we think this should be broadly positive for both private and public markets. Even though we could still get spikes in volatility in the second half, investors should be able to look through this, especially as we gain more clarity around policy.
- CBOE, S&P Capital IQ, as of Jun. 30, 2025.
- S&P Capital IQ, as of Jun. 30, 2025.
- Piper Sandler, as of May 10, 2025.
- Bloomberg, as of Jun. 25, 2025.
- Bureau of Economic Analysis, as of Jun. 26, 2025.
- Bloomberg, as of Jun. 25, 2025.
- Bloomberg Index Services, as of Jun. 24, 2025.
- Bloomberg Index Services, Bank of America, as of Jun. 25, 2025.
- Bloomberg, as of Jun. 30, 2024.
- Bloomberg Index Providers, as of Jun. 23, 2025.
- Bank of America, Morgan Stanley, as of Jun. 20, 2025.
- Bloomberg News, as of Jun. 23, 2025.
- Bloomberg News, as of Jun. 24, 2025.
- Federal Reserve, as of Jun. 18, 2025.
- Bloomberg Index Services, as of Jun. 30, 2025.
- MSCI, as of Jun. 26, 2025.
- S&P Capital IQ, iCapital Investment Strategy, as of Jun. 30, 2025. Note: This covers 99% of the global information technology sector’s market capitalization across large, mid, and small-cap companies.
- S&P Capital IQ, as of Jun. 25, 2025.
- S&P Capital IQ, as of Jun. 25, 2025.
- Goldman Sachs, as of Jun. 5, 2025.
- Bloomberg Index Services, as of Jun. 26, 2025.
- Financial Times, as of Jul. 1, 2025.
- Associated Press, as of May 24, 2025.
- Bloomberg News, as of Jul. 6, 2025.
- Tax Foundation, as of Jun. 2, 2025.
- Marathon Asset Management, as of Q1 2025.
- Apollo Global Management, as of Apr. 2025.
- Marathon Asset Management, as of Dec. 2024.
- McKinsey & Company, Synergy Research Group, as of Jan 13, 2023.
- Goldman Sachs, as of May 14, 2024.
- Bloomberg Intelligence, as of Jun. 30, 2025.
INDEX DEFINITIONS
S&P 500 Index: The S&P 500 is widely regarded as the best single gauge of large-cap U.S. equities. The index includes 500 of the top companies in leading industries of the U.S. economy and covers approximately 80% of available market capitalization.
IMPORTANT INFORMATION
The material herein has been provided to you for informational purposes only by Institutional Capital Network, Inc. (“iCapital Network”) or one of its affiliates (iCapital Network together with its affiliates, “iCapital”). This material is the property of iCapital and may not be shared without the written permission of iCapital. No part of this material may be reproduced in any form, or referred to in any other publication, without express written permission of iCapital.
This material is provided for informational purposes only and is not intended as, and may not be relied on in any manner as, legal, tax or investment advice, a recommendation, or as an offer or solicitation to buy or sell any security, financial product or instrument, or otherwise to participate in any particular trading strategy. This material does not intend to address the financial objectives, situation, or specific needs of any individual investor. You should consult your personal accounting, tax and legal advisors to understand the implications of any investment specific to your personal financial situation.
ALTERNATIVE INVESTMENTS ARE CONSIDERED COMPLEX PRODUCTS AND MAY NOT BE SUITABLE FOR ALL INVESTORS. Prospective investors should be aware that an investment in an alternative investment is speculative and involves a high degree of risk. Alternative Investments often engage in leveraging and other speculative investment practices that may increase the risk of investment loss; can be highly illiquid; may not be required to provide periodic pricing or valuation information to investors; may involve complex tax structures and delays in distributing important tax information; are not subject to the same regulatory requirements as mutual funds; and often charge high fees. There is no guarantee that an alternative investment will implement its investment strategy and/or achieve its objectives, generate profits, or avoid loss. An investment should only be considered by sophisticated investors who can afford to lose all or a substantial amount of their investment.
iCapital Markets LLC operates a platform that makes available financial products to financial professionals. In operating this platform, iCapital Markets LLC generally earns revenue based on the volume of transactions that take place in these products and would benefit by an increase in sales for these products.
The information contained herein is an opinion only, as of the date indicated, and should not be relied upon as the only important information available. Any prediction, projection or forecast on the economy, stock market, bond market or the economic trends of the markets is not necessarily indicative of the future or likely performance. The information contained herein is subject to change, incomplete, and may include information and/or data obtained from third party sources that iCapital believes, but does not guarantee, to be accurate. iCapital considers this third-party data reliable, but does not represent that it is accurate, complete and/or up to date, and it should not be relied on as such. iCapital makes no representation as to the accuracy or completeness of this material and accepts no liability for losses arising from the use of the material presented. No representation or warranty is made by iCapital as to the reasonableness or completeness of such forward-looking statements or to any other financial information contained herein.
Securities products and services are offered by iCapital Markets, an SEC-registered broker-dealer, member FINRA and SIPC, and an affiliate of iCapital, Inc. and Institutional Capital Network, Inc. These registrations and memberships in no way imply that the SEC, FINRA, or SIPC have endorsed any of the entities, products, or services discussed herein. Annuities and insurance services are provided by iCapital Annuities and Insurance Services LLC, an affiliate of iCapital, Inc. “iCapital” and “iCapital Network” are registered trademarks of Institutional Capital Network, Inc. Additional information is available upon request.
©2025 Institutional Capital Network, Inc. All Rights Reserved.


