


Key takeaways:
- Another big beat ahead: A robust macro backdrop should fuel a second straight quarter of 20%+ earnings growth, with tariff refunds helping drive a 7%+ earnings surprise.
- The last easy beat? Underlying growth is still accelerating once you strip out one-off items, but with macro tailwinds fading in the second half, this may be what peak earnings growth looks like.
- Leadership is broadening: Banks, industrials, and small caps are joining AI leaders in driving growth, while international markets are poised to outgrow the US by the widest margin in several quarters. We like the setup for banks this earnings season and beyond.
The last easy beat
Second quarter earnings season kicks off July 14 with the banks, and the backdrop looks favorable. A resilient economy, surging AI spending, and potential tariff refunds should help drive a second consecutive quarter of 20%+ earnings per share growth, extending a six-year streak of index-level beats. We do not expect a repeat of the first quarter’s 13.5% blowout, but another sizeable surprise looks likely, with our estimates pointing to a beat of more than 7% versus consensus (Exhibit 1).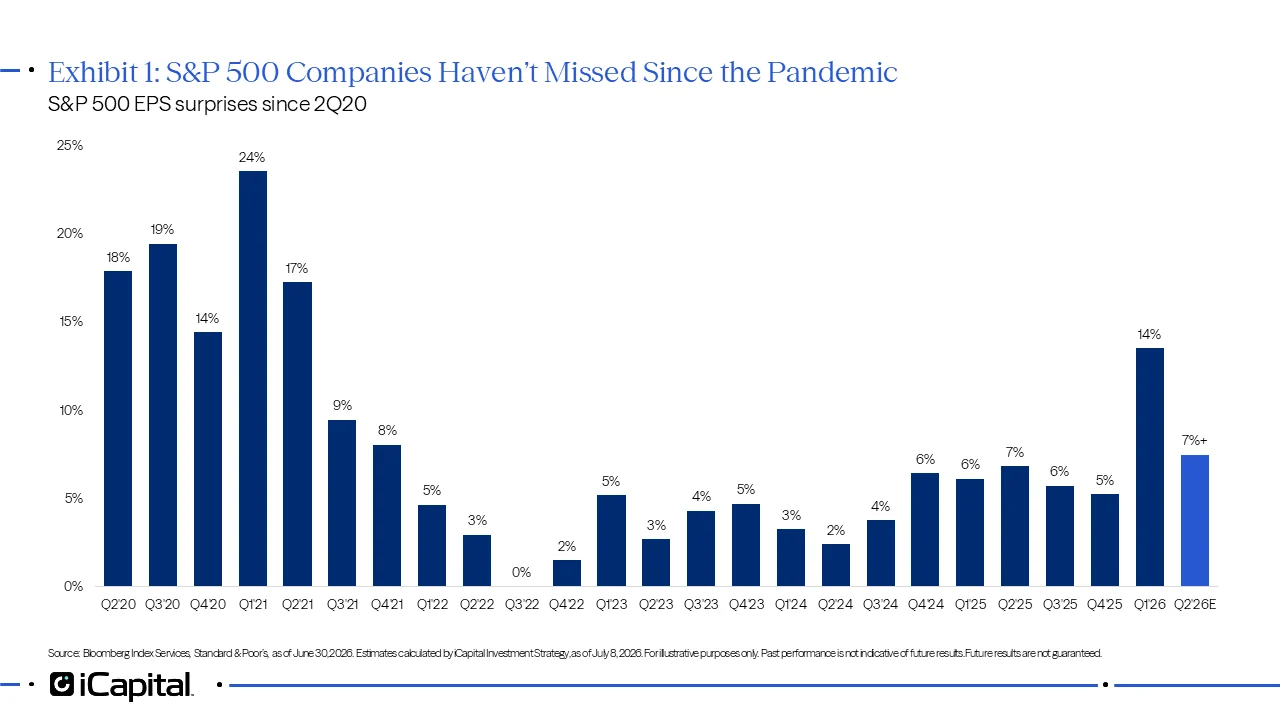 The more important question is what comes next. Investors have taken for granted that some of the biggest earnings drivers in 2026 have been one-off items, or at least gains that are likely to subside in future quarters. These include:
• Equity-investment gains: Alphabet and Amazon significantly marked up the value of their equity stakes in foundation-model AI companies in Q1, but future gains are more uncertain.1
• Tax accounting adjustments: Meta reported a one-time tax gain related to the treatment of research & development expense in Q1.2
• Tariff refunds: With the Supreme Court striking down the IEEPA tariffs, over $15 billion likely to be reported by S&P 500 companies in Q2.3
• Oil-driven energy profits: Energy company profits likely surged in Q2 on the war-driven spike in energy prices, but oil prices have since fallen back toward pre-war levels.4
• A persistently weak dollar: with the U.S. currency having put in a bottom in January, currency is no longer a major contributor to corporate profits beginning in Q2.5
That makes this earnings season less about whether companies can beat again, and more about whether banks, cyclicals, small caps, international markets, and AI monetization can sustain the earnings cycle once those temporary drivers fade later in the year.
A strong macro backdrop, minus one support
As we discussed in our recent Mid-Year Outlook, the first half delivered the strongest synchronized growth acceleration since the post-pandemic rebound, with many economic indicators hitting multi-year highs despite major geopolitical shocks (Exhibit 2). One tailwind that is beginning to fade: the weaker dollar. The U.S. Dollar Index averaged 8% below year-ago levels in the first quarter, flattering the translation of foreign profits and boosting the competitiveness of US exporters (Exhibit 3). But that boost is largely behind us as the U.S. dollar was roughly flat year-over-year (YoY) in the second quarter and is currently tracking up 3-4% YoY as we enter the third quarter (Exhibit 3).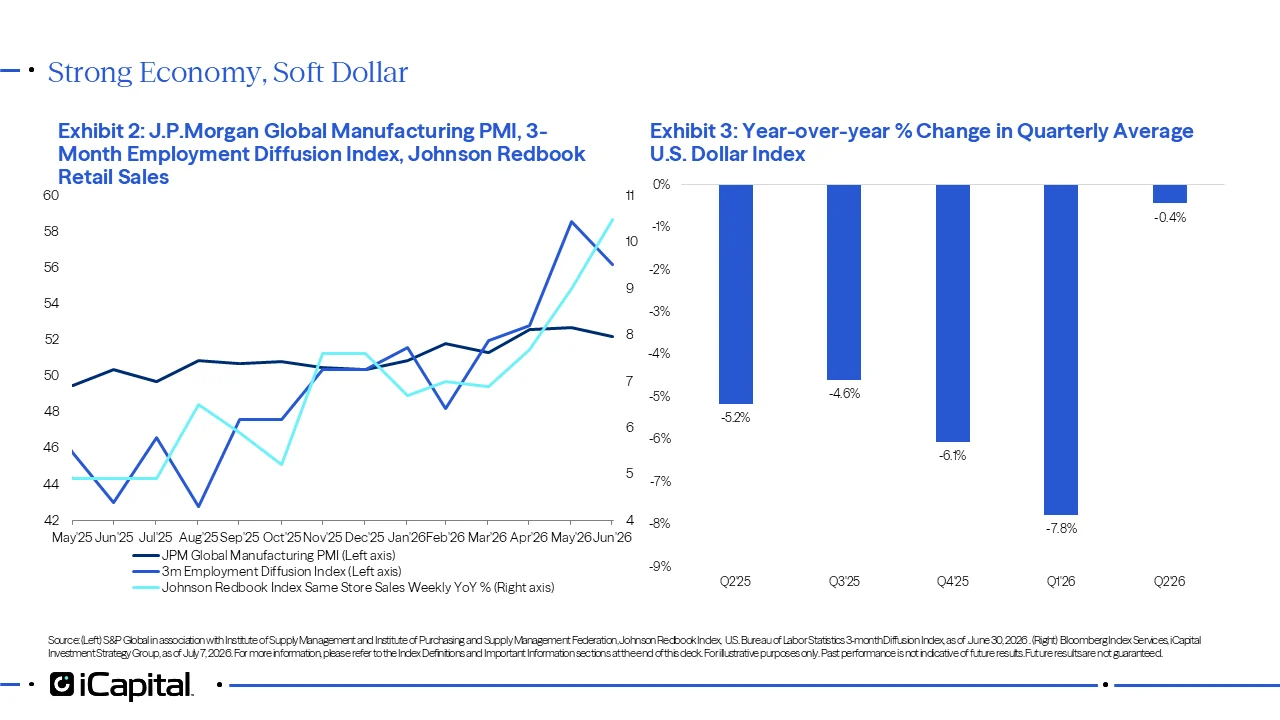 Headline EPS deceleration doesn’t tell the whole story
On the surface, consensus expects S&P 500 EPS growth to slow from 28% in the first quarter to 22% in the second (Exhibit 5). But headline numbers hide the real story. Stripping out 1Q’s outsized equity-investment gains at Alphabet and Amazon, plus Meta’s R&D tax accounting adjustment, underlying growth is poised to accelerate (Exhibit 4).
Layer in a likely tariff-refund tailwind (potentially another 3% to EPS) and the median 4.5% positive surprise of the past four years, and the setup points to roughly 29% EPS growth and a 7%+ beat (Exhibit 5). That would be a meaningful upside surprise versus consensus, even if it falls well short of last quarter’s unusually large 13.5% beat. Second quarter results should be strong, but investors will be focused on whether earnings momentum remains intact as one-time contributors begin to roll off.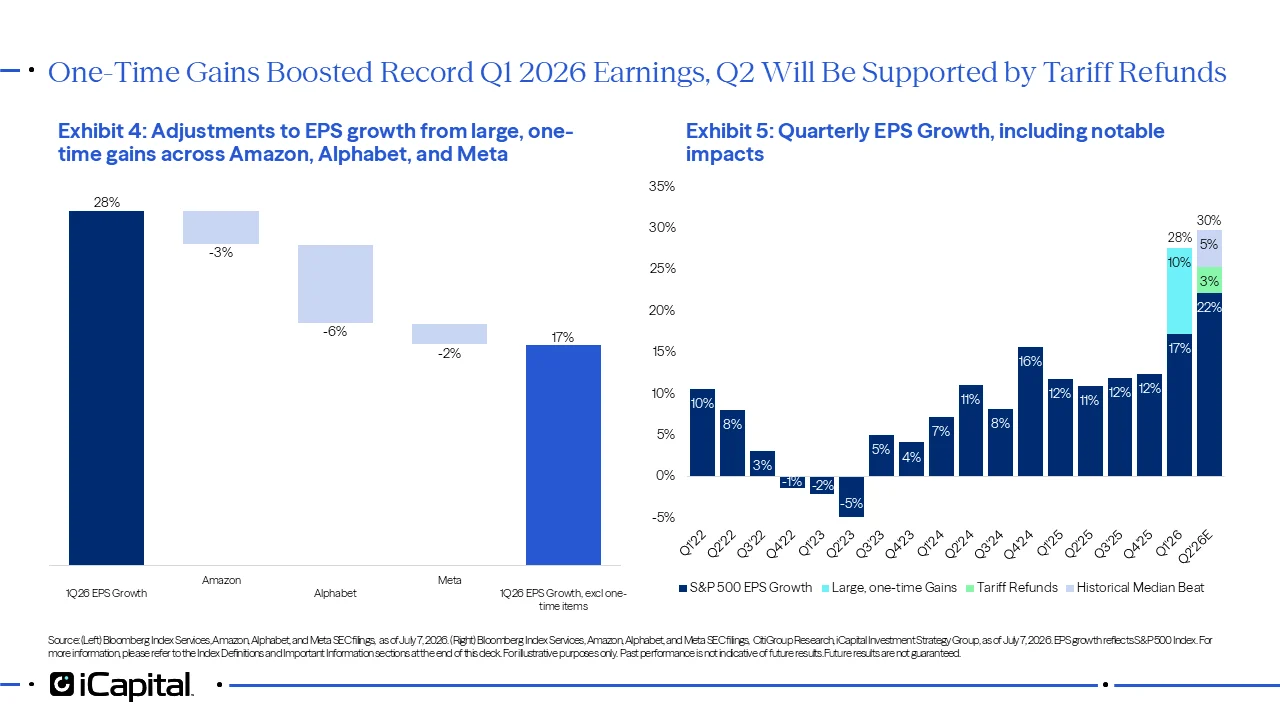 Cyclicals leading the cycle
Cyclicals are leading the charge. Semis, Energy, Materials, and Banks are set to deliver the strongest absolute growth, with Energy, Semis, Materials, Tech, and Industrials all accelerating from last quarter (Exhibit 6). Analyst conviction is building behind the leaders: since the end of May, Q2 EPS estimates have been revised up sharply for Semis (+7%) and IT (+4%), with Industrials, Banks, Financials, and Comm Services all up more than 2% (Exhibit 7). Energy is the notable exception, where estimates have been cut 3% (Exhibit 7). Healthcare remains the sole laggard in negative territory, with estimates continuing to be revised lower, driven by Pharma and Biotech (Exhibit 7). Participation remains broad: 10 of the 11 sectors are on track for positive growth, the third straight quarter of near-universal expansion (Exhibit 6). A strong quarter for Energy, but a bit short-lived as oil begins flowing freely
Energy earnings are set to roughly double in the second quarter, though recent oil-price trends suggest that strength may prove temporary (Exhibit 8). The sector’s earnings track oil prices tightly, and with crude prices back to pre-war levels on hopes of a lasting Iran peace deal and the reopening of the Strait of Hormuz, sector earnings should start to normalize toward pre-conflict levels in the second half, removing another source of earnings support (Exhibit 8). Banks: Strong earnings growth with improving outlook
Banks are firing on multiple cylinders: loan growth is improving and the higher rate environment continues to support healthy net interest margins (Exhibit 10). Credit quality is holding up too, with defaults still low even as consumer loan delinquencies remain elevated.6 Capital markets activity is strong as well—U.S. corporate bond issuance reached $1.6 trillion year-to-date, up nearly 35% from the same period last year.7 IPO proceeds totaled around $251 billion, where SpaceX’s IPO represented over 30% of proceeds. Strong underwriting activity and healthy investor demand are helping support fee income and broader financing activity.8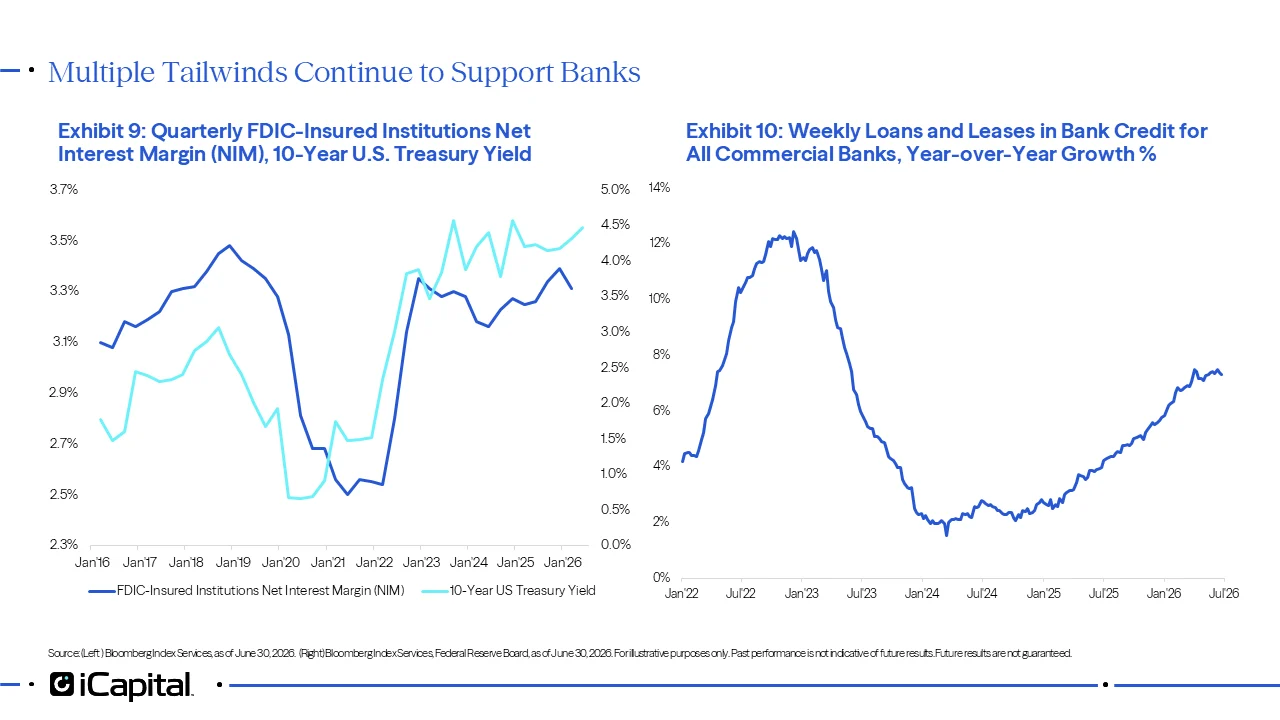 The longer-term outlook may be even more constructive. A steepening yield curve, as markets price out Fed hikes (see our Mid-Year Outlook), would cap deposit costs and support net interest margins (Exhibit 9). And if the Fed’s new Balance Sheet Task Force concludes that the Fed’s balance sheet is too big, the multi-year process of shrinking it could include a variety of policy options that increase lending capacity by more than $1 trillion from balance sheets. In a March 2026 economic research paper, former Fed Reserve Board Governor Miran suggested that the Fed balance sheet could be reduced by $1.6 trillion, which would require the loosening of bank liquidity requirements.9
Tech: it all comes back to AI…and space
The AI story is entering its next phase. For most of the past year, investors favored the companies supplying the AI buildout, particularly semiconductors and infrastructure providers that benefited from surging demand and tight capacity. Meanwhile, investors grew increasingly skeptical of hyperscalers pouring hundreds of billions into AI with limited near-term earnings visibility.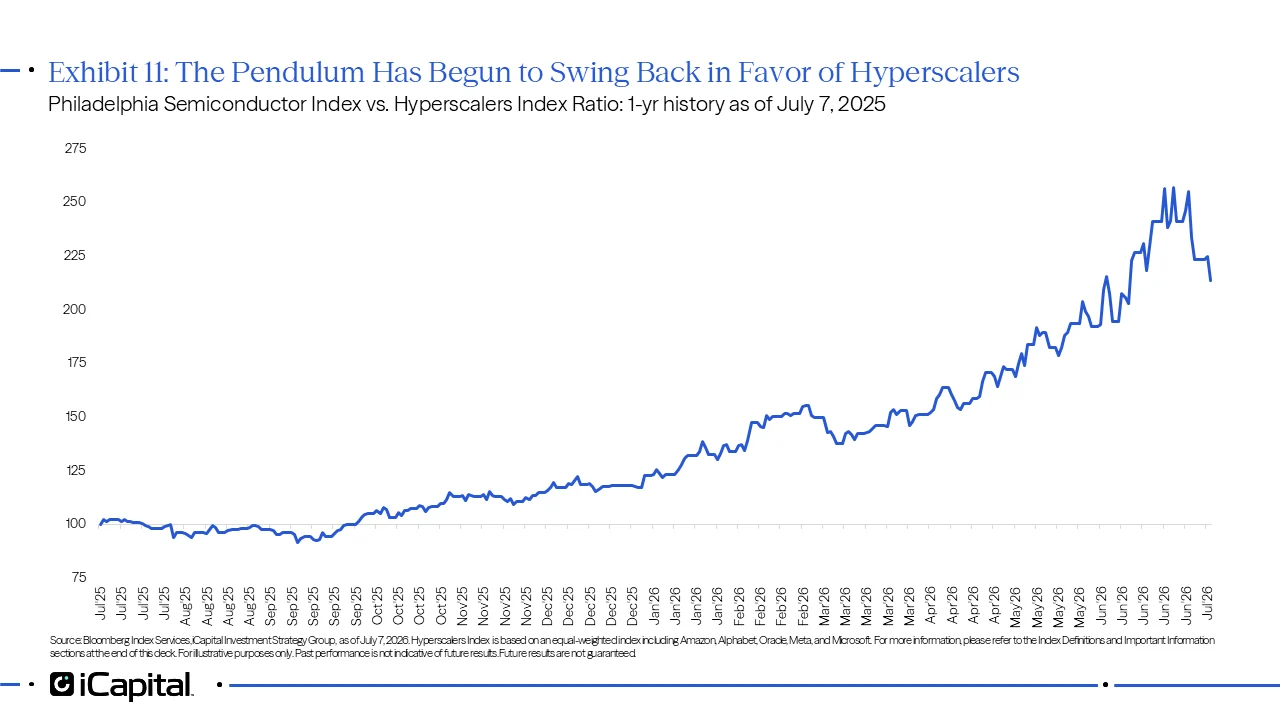 That dynamic may be starting to shift. Recent moves by Meta and SpaceX to commercialize their AI infrastructure through “neocloud” offerings suggest they see a growing opportunity to monetize their massive compute investments more quickly.10 11 If investors gain confidence that AI spending can translate into revenue and cash flow, leadership could broaden beyond the traditional AI beneficiaries and back toward the largest AI spenders.
Earnings season should provide an important reality check. Investors will be watching for changes to AI spending plans, evidence that AI investments are translating into revenue, and management commentary on how the competitive landscape is evolving.
SpaceX’s first earnings report as a public company could be a focal point.
SpaceX may become a test case for how investors value the next generation of AI-adjacent infrastructure companies: part communications platform, part compute story, and part growth-stock bellwether.
Key areas to watch include:
- Starlink subscriber growth and pricing power, the company’s primary cash-flow engine.
- Progress and monetization plans for its AI business following the acquisition of Cursor.
- Capital expenditure plans and demand trends for AI infrastructure.
- Management’s broader outlook for growth, profitability, and AI commercialization.
Strength extends beyond AI leaders
Small caps and the S&P 500 excluding the Magnificent 7 stocks are set to post the strongest earnings growth since Q1 2022 and Q4 2021, respectively, and every major size and style bucket is on track for double-digit growth for the second straight quarter (Exhibit 12). While the Magnificent 7 and Large Growth stocks are still expected to lead the pack, the gap with other areas of the market is likely to tighten. That matters because broader participation would help validate a rally extending beyond mega-cap AI leaders.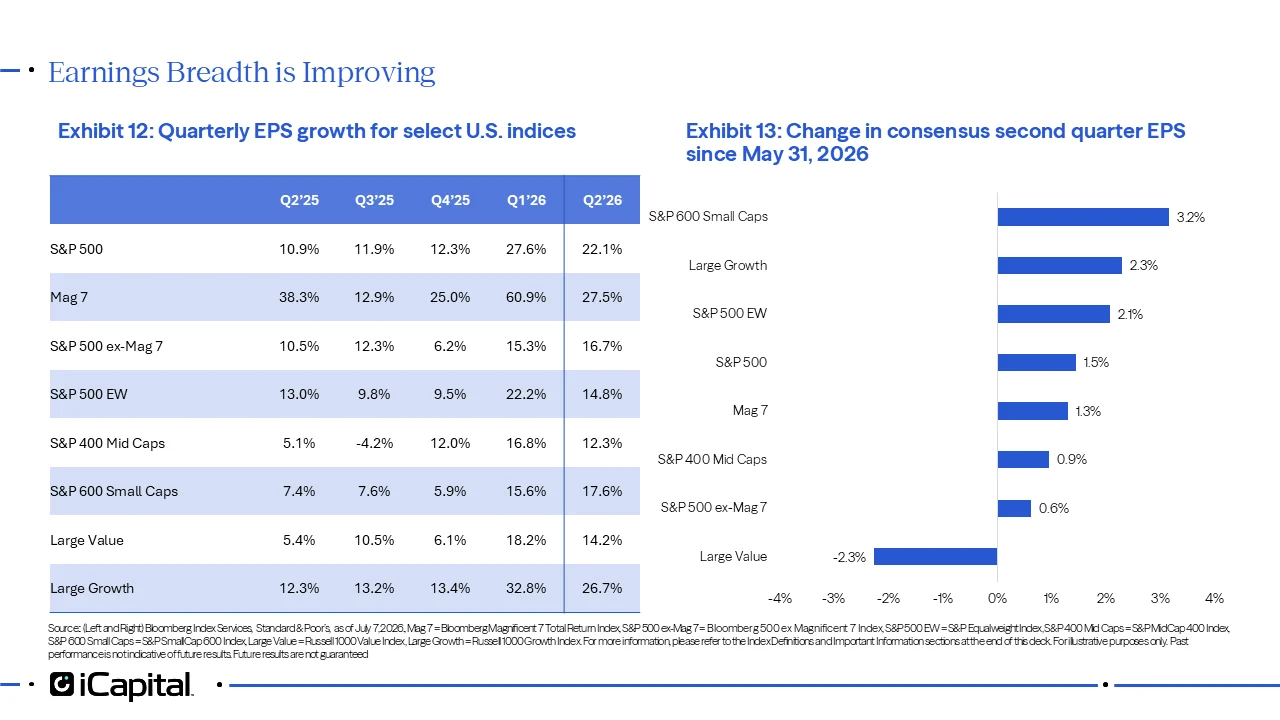 International markets are catching up
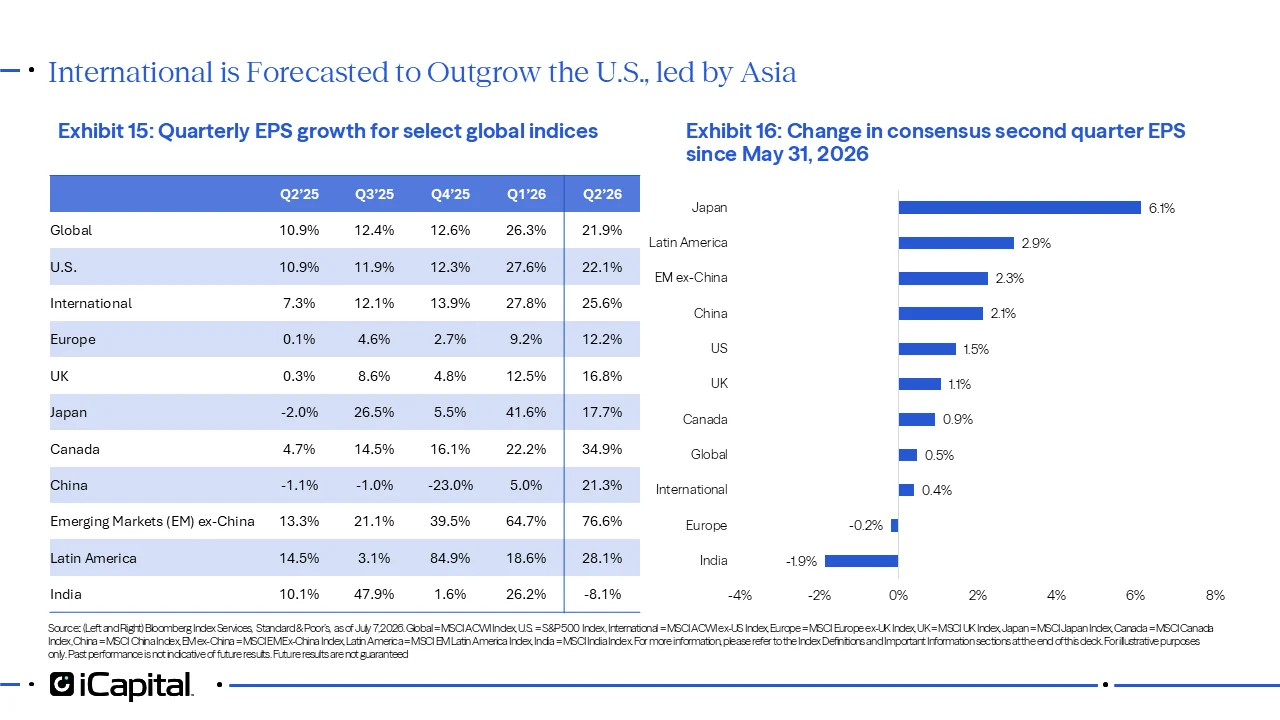
International markets are another area where earnings momentum is improving, with forecasts calling for the widest growth advantage versus the U.S. since 4Q24 (Exhibit 14).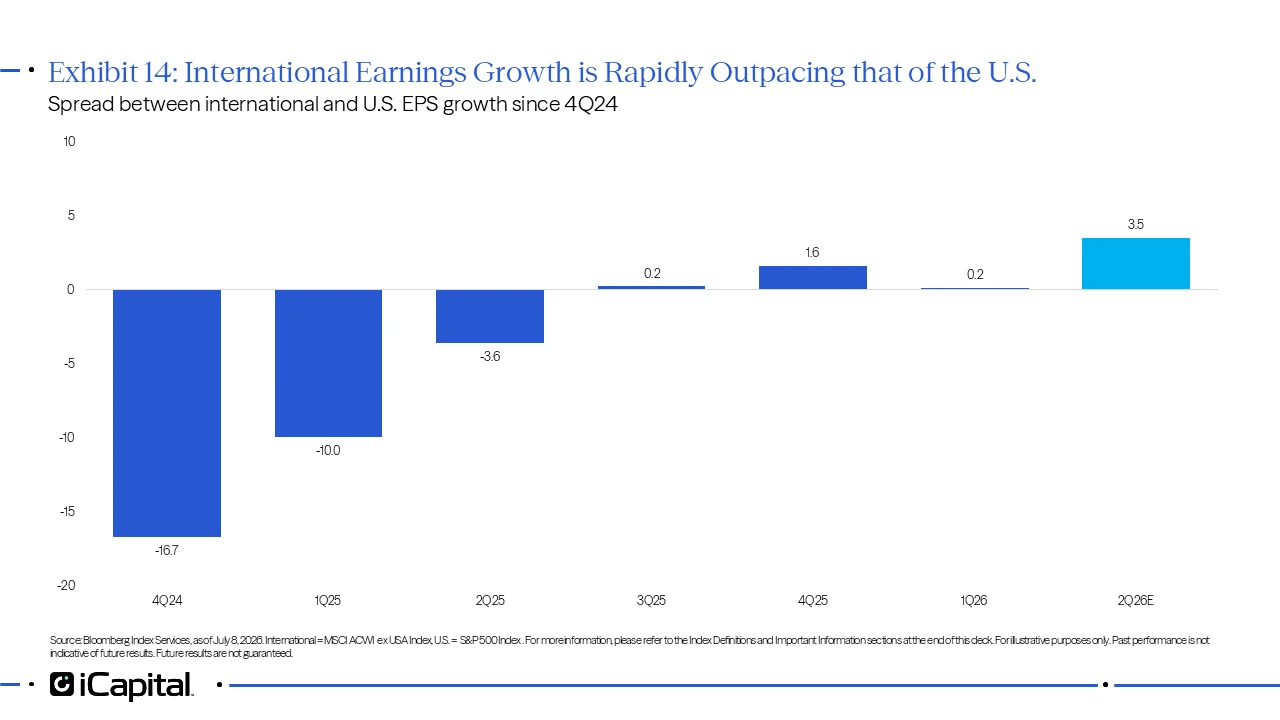 Emerging Markets excluding China lead the pack with a stunning 76% surge expected, driven by Korean and Taiwanese semis (Exhibit 15). Europe is expected to post double-digit growth for the first time since 2023, while the UK notches its second straight double-digit quarter, and Canada leaps 35% on Energy and Materials strength (Exhibit 15). Meanwhile, China is on track for its best showing since 2024 (Exhibit 15). Japan, which we highlighted in our Mid-Year Outlook as our preferred international market, has seen EPS expectations grow by 6% since May 31, well above other markets (Exhibit 16). India is the notable outlier, expected to post negative growth (Exhibit 15).
 A strong quarter, but a bigger test ahead
The second quarter should deliver another strong earnings season, but investors should distinguish between temporary boosts and durable earnings momentum. If banks, cyclicals, small caps, and international markets can carry the earnings cycle once the easy beats fade, the rally may have further room to run.
- Fortune, Google and Amazon’s biggest profit driver last quarter was their Anthropic stakes—which they haven’t sold, April 30, 2026.
- Meta Platforms Q1 2026 Earnings Release, April 29, 2026.
- CNBC, Tariff refunds begin on Monday. These retailers are due big paydays, April 20, 2026.
- Bloomberg Index Services, with data as of July 8, 2026.
- Bloomberg Index Services, with data as of July 8, 2026.
- Federal Reserve Bank of New York, Household Debt Balances Rise Slightly as Delinquency Transition Rates Hold Steady, May 12, 2026.
- Bloomberg Index Services, as of July 8, 2026.
- Bloomberg Index Services, as of July 7, 2026. Data as of June 30, 2026.
- Board of Governors of the Federal Reserve System, A User’s Guide to Reducing the Federal Reserve’s Balance Sheet, March 2026.
- Bloomberg, Meta Is Planning a Cloud Business to Sell AI Computing Power, July 1, 2026.
- CNBC, Google to pay SpaceX $920 million a month for compute capacity at xAI data centers, June 5, 2026.
INDEX DEFINTIONS
U.S. Dollar Index: The ICE U.S. Dollar Index measures the value of the U.S. Dollar against a basket of currencies of the top six trading partners of the United States, as measured in 1973: the Euro zone, Japan, the United Kingdom, Canada, Sweden, and Switzerland.
S&P 500 Index: The S&P 500 is widely regarded as the best single gauge of large-cap U.S. equities. The index includes 500 of the top companies in leading industries of the U.S. economy and covers approximately 80% of available market capitalization.
S&P MidCap 400 Index: The S&P MidCap 400 provides investors with a benchmark for mid-sized companies. The index, which is distinct from the large-cap S&P 500, is designed to measure the performance of 400 mid-sized companies, reflecting the distinctive risk and return characteristics of this market segment.
S&P SmallCap 600 Index: The S&P SmallCap 600 seeks to measure the small-cap segment of the U.S. equity market. The index is designed to track companies that meet specific inclusion criteria to ensure that they are liquid and financially viable.
S&P 500 Consumer Discretionary Index: The S&P 500 Consumer Discretionary Index comprises those companies included in the S&P 500 that are classified as members of the GICS® Consumer Discretionary sector. The sector includes industries such as automobiles, consumer durables, apparel, hotels, restaurants, leisure, and broadline retail.
S&P 500 Consumer Staples Index: The S&P 500 Consumer Staples Index comprises those companies included in the S&P 500 that are classified as members of the GICS® Consumer Staples sector. The sector includes companies involved in food, beverage, household products, personal products, and retailing of staple consumer goods.
S&P 500 Energy Index: The S&P 500 Energy Index comprises those companies included in the S&P 500 that are classified as members of the GICS® Energy sector.
S&P 500 Financials Index: The S&P 500 Financials Index comprises those companies included in the S&P 500 that are classified as members of the GICS® Financials sector. The sector includes banks, insurance companies, capital markets firms, consumer finance companies, and diversified financial services firms.
S&P 500 Health Care Index: The S&P 500 Health Care Index comprises those companies included in the S&P 500 that are classified as members of the GICS® Health Care sector. The sector includes pharmaceuticals, biotechnology, life sciences tools and services, health care equipment, supplies, providers, and services.
S&P 500 Industrials Index: The S&P 500 Industrials Index comprises those companies included in the S&P 500 that are classified as members of the GICS® Industrials sector. The sector includes aerospace and defense, machinery, transportation, professional services, and commercial services companies.
S&P 500 Information Technology Index: The S&P 500 Information Technology Index comprises those companies included in the S&P 500 that are classified as members of the GICS® Information Technology sector. The sector includes software, hardware, semiconductor, semiconductor equipment, IT services, and electronic equipment companies.
S&P 500 Materials Index: The S&P 500 Materials Index comprises those companies included in the S&P 500 that are classified as members of the GICS® Materials sector. The sector includes chemicals, construction materials, containers and packaging, metals and mining, and paper and forest products companies.
S&P 500 Real Estate Index: The S&P 500 Real Estate Index comprises those companies included in the S&P 500 that are classified as members of the GICS® Real Estate sector. The sector includes equity real estate investment trusts (REITs) and real estate management and development companies.
S&P 500 Communication Services Index: The S&P 500 Communication Services Index comprises those companies included in the S&P 500 that are classified as members of the GICS® Communication Services sector. The sector includes telecommunications services, media, entertainment, and interactive media and services companies.
S&P 500 Utilities Index: The S&P 500 Utilities Index comprises those companies included in the S&P 500 that are classified as members of the GICS® Utilities sector. The sector includes electric, gas, water, and multi-utility companies, as well as independent power producers and energy traders.
S&P 500 Equal-Weighted Index: The equal-weight version of the widely-used S&P 500. The index includes the same constituents as the capitalization weighted S&P 500, but each company in the S&P 500 EWI is allocated a fixed weight - or 0.2% of the index total at each quarterly rebalance.
S&P Banks Select Industry Index: The S&P Banks Select Industry Index comprises stocks in the S&P Total Market Index that are classified in the GICS Asset Management & Custody Banks, Diversified Banks, Regional Banks, Diversified Financial Services and Commercial & Residential Mortgage Finance sub-industries.
Hyperscaler Index: The Hyperscaler Index is defined as Meta Platforms, Oracle Corporation, Microsoft Corporation, Amazon.com Inc., and Alphabet Inc. Weightings as of July 7, 2026.
Philadelphia Semiconductor Index: The Philadelphia Stock Exchange Semiconductor IndexSM is a modified market capitalization-weighted index composed of companies primarily involved in the design, distribution, manufacture, and sale of semiconductors.
Bloomberg Magnificent 7 Total Return Index: The Bloomberg Magnificent 7 Total Return Index is an equal-dollar weighted equity benchmark consisting of a fixed basket of 7 widely-traded companies classified in the United States and representing the Communications, Consumer Discretionary and Technology sectors as defined by Bloomberg Industry Classification System (BICS).
Bloomberg 500 ex Magnificent 7 Index: The Bloomberg 500 ex Magnificent 7 Index is a float market-cap weighted benchmark designed to measure the most highly capitalized US companies, while excluding securities whose parent company is an index member of the Bloomberg Magnificent 7 Index. The indices are calculated in Price, Total and Net Return variants.
Russell 1000 Growth Index: The Russell 1000 Growth Index measures the performance of US large cap growth stocks. The index includes US large cap stocks with relatively higher price-to-book ratios, higher 2-year I/B/E/S forecast growth and higher historical 5-year sales growth. The index is reconstituted fully in June to ensure accurate representation of the US large cap growth style, with updates for parent index membership changes in December and quarterly IPO inclusions in March and September. Since March 24, 2025, the index applies quarterly capping if constituent weights exceed target RIC thresholds.IPOs with investable market cap above the Russell Top 500 breakpoint are eligible for fast entry; breakpoints are set semi-annually and market-adjusted quarterly.
Russell 1000 Value Index: The Russell 1000 Value Index measures the performance of US large cap value stocks. The index includes companies with relatively lower price to-book ratios, lower 2-year I/B/E/S forecast growth and lower historical 5 year sales growth. The index is reconstituted fully in June to ensure accurate representation of the US large cap value style, with updates for parent index membership changes in December and quarterly IPO inclusions in March and September. Since March 24, 2025, the index applies quarterly capping if constituent weights exceed target RIC thresholds. IPOs with investable market cap above the Russell Top 500 breakpoint are eligible for fast entry; breakpoints are set semi-annually and market-adjusted quarterly.
MSCI ACWI Index: MSCI’s flagship global equity index is designed to represent performance of the full opportunity set of large- and mid-cap companies from developed and emerging markets around the world.
MSCI USA Index: The MSCI USA Index is designed to measure the performance of the large and mid cap segments of the US market. The index covers approximately 85% of the free float-adjusted market capitalization in the US.
MSCI ACWI ex USA Index: The MSCI ACWI ex USA Index captures large and mid cap representation across 22 of 23 Developed Markets (DM) countries (excluding the US) and 24 Emerging Markets (EM) countries*. With 1,934 constituents, the index covers approximately 85% of the global equity opportunity set outside the US.
MSCI EMU Index: The MSCI EMU Index (European Economic and Monetary Union) captures large and mid cap representation across the 10 Developed Markets countries in the EMU. With 223 constituents, the index covers approximately 85% of the free float-adjusted market capitalization of the EMU.
MSCI Europe ex UK Index: The MSCI Europe ex UK Index captures large and mid cap representation across Developed Markets (DM) countries in Europe. The index covers approximately 85% of the free float-adjusted market capitalization across European Developed Markets excluding the UK.
MSCI United Kingdom Index: The MSCI United Kingdom Index is designed to measure the performance of the large and mid cap segments of the UK market. With 71 constituents, the index covers approximately 85% of the free float-adjusted market capitalization in the UK.
MSCI Japan Index: The MSCI Japan Index is designed to measure the performance of the large and mid cap segments of the Japanese market. With 179 constituents, the index covers approximately 85% of the free float-adjusted market capitalization in Japan.
MSCI China Index: The MSCI China Index captures large and mid cap representation across China A shares, H shares, B shares, Red chips, P chips and foreign listings (e.g. ADRs). The index covers about 85% of this China equity universe. Currently, the index includes Large Cap A and Mid Cap A shares represented at 20% of their free float adjusted market capitalization.
MSCI EM (Emerging Markets) ex China Index: The MSCI Emerging Markets ex China Index captures large and mid cap representation across Emerging Markets (EM) countries excluding China. The index covers approximately 85% of the free float-adjusted market capitalization in each country.
MSCI Canada Index: The MSCI Canada Index is designed to measure the performance of the large- and mid-cap segments of the Canadian equity market and covers approximately 85% of the free float-adjusted market capitalization in Canada.
MSCI EM Latin America Index: The MSCI Emerging Markets (EM) Latin America Index captures large and mid cap representation across Emerging Markets (EM) countries in Latin America. The index covers approximately 85% of the free float-adjusted market capitalization in each country.
MSCI India Index: The MSCI India Index is designed to measure the performance of the large and mid cap segments of the Indian market. The index covers approximately 85% of the Indian equity universe.
J.P. Morgan Global Manufacturing PMI: The J.P. Morgan Global Manufacturing PMI gives an overview of the global manufacturing sector. It is based on monthly surveys of over 10,000 purchasing executives from 32 of the world’s leading economies, including the U.S., Japan, Germany, France and China which together account for an estimated 89 percent of global manufacturing output. It reflects changes in global output, employment, new orders and prices. The Global Manufacturing PMI is seasonally adjusted at the national level to control for varying seasonal patterns in each country and is produced by J.P. Morgan and Markit Economics in association with ISM and the International Federation of Purchasing and supply Management (IFPSM).
US ISM Manufacturing PMI: The ISM Purchasing Managers Index is a monthly business survey indicator produced in the United States by the Institute of Supply Management based on questionnaire responses collected from its members, which are predominantly supply chain or purchasing executives in large corporations.
Johnson Redbook Index: The Johnson Redbook Index is a sales-weighted of year-over-year same-store sales growth in a sample of large US general merchandise retailers representing about 9,000 stores. Same-store sales are sales in stores continuously open for 12 months or longer. By dollar value, the Index represents over 80% of the equivalent ‘official’ retail sales series collected and published by the US Department of Commerce. Redbook compiles the Index by collecting and interpreting performance estimates from retailers. The Index and its sub-groups are sales-weighted aggregates of these estimates. Weeks are retail weeks (Sunday to Saturday), and equally weighted within the month.
Employment Diffusion Index: The Current Employment Statistics (CES) program currently publishes diffusion indexes to measure how widely national employment changes are spread across industries over 1-, 3-, 6-, and 12-month time spans. Diffusion indexes help us understand whether a change in employment may be caused by smaller employment changes in many industries or by large changes in a few industries. We calculate an overall index from 258 employment series (primarily 4-digit NAICS industries) covering all nonfarm payroll employment in the private sector. To derive the index, each industry is assigned a value of 0, 50, or 100, depending on whether its employment showed a decrease, no change, or an increase, respectively, over the time span. We then calculate the average (mean) of these values, and this percent is the diffusion index number. A diffusion index of 50 would show that the same number of component industries had increasing employment and decreasing employment, while an index higher than 50 would suggest more industries were increasing employment than decreasing over the index time span.
IMPORTANT INFORMATION
The material herein has been provided to you for informational purposes only by Institutional Capital Network, Inc. (“iCapital Network”) or one of its affiliates (iCapital Network together with its affiliates, “iCapital”). This material is the property of iCapital and may not be shared without the written permission of iCapital. No part of this material may be reproduced in any form, or referred to in any other publication, without express written permission of iCapital.
This material is provided for informational purposes only and is not intended as, and may not be relied on in any manner as, legal, tax or investment advice, a recommendation, or as an offer or solicitation to buy or sell any security, financial product or instrument, or otherwise to participate in any particular trading strategy. This material does not intend to address the financial objectives, situation, or specific needs of any individual investor. You should consult your personal accounting, tax, and legal advisors to understand the implications of any investment specific to your personal financial situation.
ALTERNATIVE INVESTMENTS ARE CONSIDERED COMPLEX PRODUCTS AND MAY NOT BE SUITABLE FOR ALL INVESTORS. Prospective investors should be aware that an investment in an alternative investment is speculative and involves a high degree of risk. Alternative investments often engage in leveraging and other speculative investment practices that may increase the risk of investment loss; can be highly illiquid; may not be required to provide periodic pricing or valuation information to investors; may involve complex tax structures and delays in distributing important tax information; are not subject to the same regulatory requirements as mutual funds; and often charge high fees. There is no guarantee that an alternative investment will implement its investment strategy and/or achieve its objectives, generate profits, or avoid loss. An investment should only be considered by sophisticated investors who can afford to lose all or a substantial amount of their investment.
iCapital Markets LLC operates a platform that makes available financial products to financial professionals. In operating this platform, iCapital Markets LLC generally earns revenue based on the volume of transactions that take place in these products and would benefit from an increase in sales for these products.
The information contained herein is an opinion only, as of the date indicated, and should not be relied upon as the only important information available. Any prediction, projection, or forecast on the economy, stock market, bond market, or the economic trends of the markets is not necessarily indicative of the future or likely performance. The information contained herein is subject to change, incomplete, and may include information and/or data obtained from third-party sources that iCapital believes, but does not guarantee, to be accurate. iCapital considers this third-party data reliable, but does not represent that it is accurate, complete and/or up to date, and it should not be relied on as such. iCapital makes no representation as to the accuracy or completeness of this material and accepts no liability for losses arising from the use of the material presented. No representation or warranty is made by iCapital as to the reasonableness or completeness of such forward-looking statements or to any other financial information contained herein.
Securities products and services are offered by iCapital Markets LLC, an SEC-registered broker-dealer, member FINRA and SIPC, and an affiliate of iCapital, Inc. and Institutional Capital Network, Inc. These registrations and memberships in no way imply that the SEC, FINRA, or SIPC have endorsed any of the entities, products, or services discussed herein. Annuities and insurance services are provided by iCapital Annuities and Insurance Services LLC, an affiliate of iCapital, Inc. “iCapital” and “iCapital Network” are registered trademarks of Institutional Capital Network, Inc. Additional information is available upon request.
©2026 Institutional Capital Network, Inc. All Rights Reserved.