Key Takeaways:
- What happened: First Brands and Tricolor recently filed for bankruptcy amid allegations of fraud and double-pledging, sparking concerns across private credit markets.
- Why it’s not systemic: Exposure is limited and fundamentals remain stable—these are isolated cases, not signs of broader market contagion.
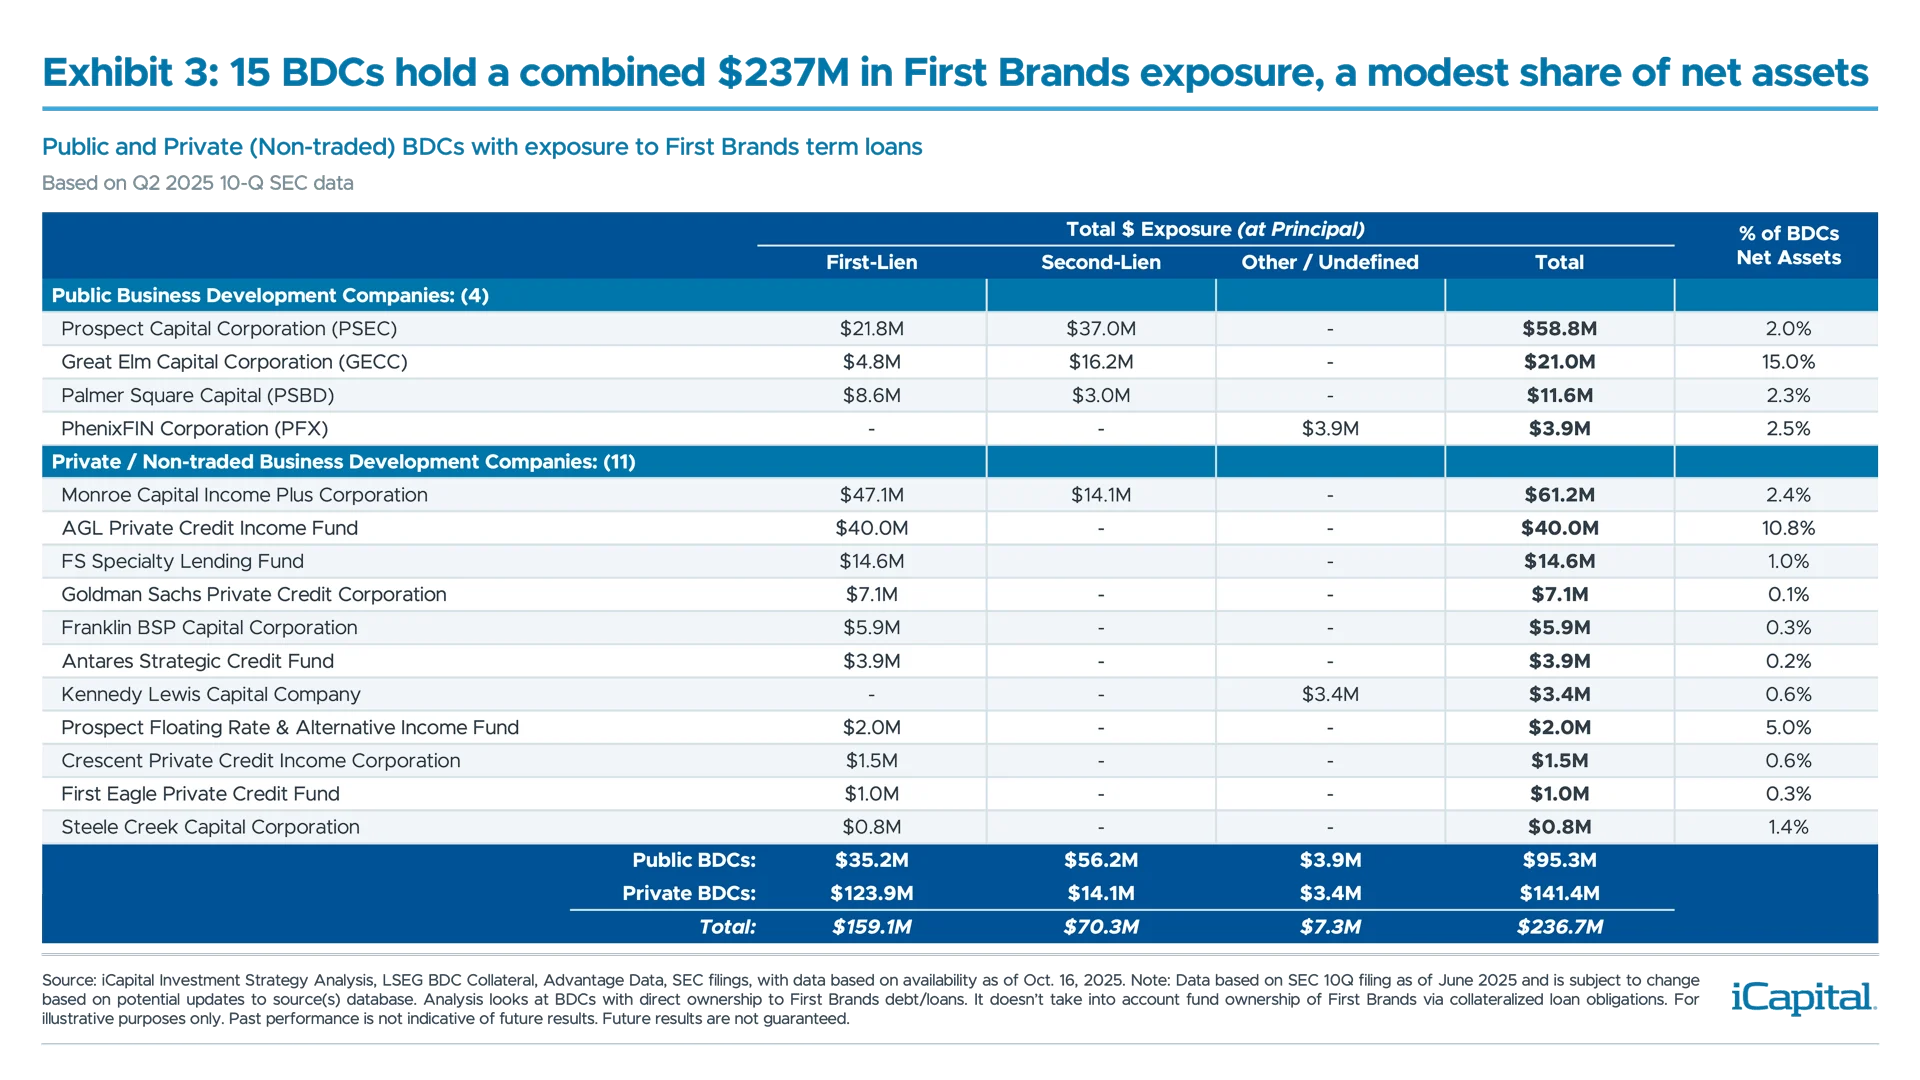
- What’s the exposure: Based on our analysis of 166 BDCs, just 15 BDCs – 11 private and four public – have a combined $237 million in First Brands exposure.1 That’s only 0.05% of the $503 billion in total BDC AUM.2
- What we’re watching: BDC and asset manager earnings, credit spread movements, and resolution of First Brands’ off-balance-sheet financing.
- Investment implications: The selloff appears overdone; we see selective opportunities in well-managed public BDCs trading below NAV with strong fundamentals.
Recent high-profile bankruptcies – notably First Brands and Tricolor – have raised fresh questions around the health of credit markets. That’s particularly true for private credit, with investor concerns rising around whether cracks may be forming within one of the most favored asset classes of the past few years. While initial headlines began surfacing in early August, losses have been revealed across a range of funds by mid-September.
Since then, public Business Development Companies (BDCs) have declined by roughly 10-15%, a two-standard-deviation move, and are significantly underperforming the S&P 500 year-to-date (Exhibit 1).3 This selloff has extended beyond BDCs, into publicly-traded alternative asset managers and, more recently, regional banks, reflecting broader investor unease.4
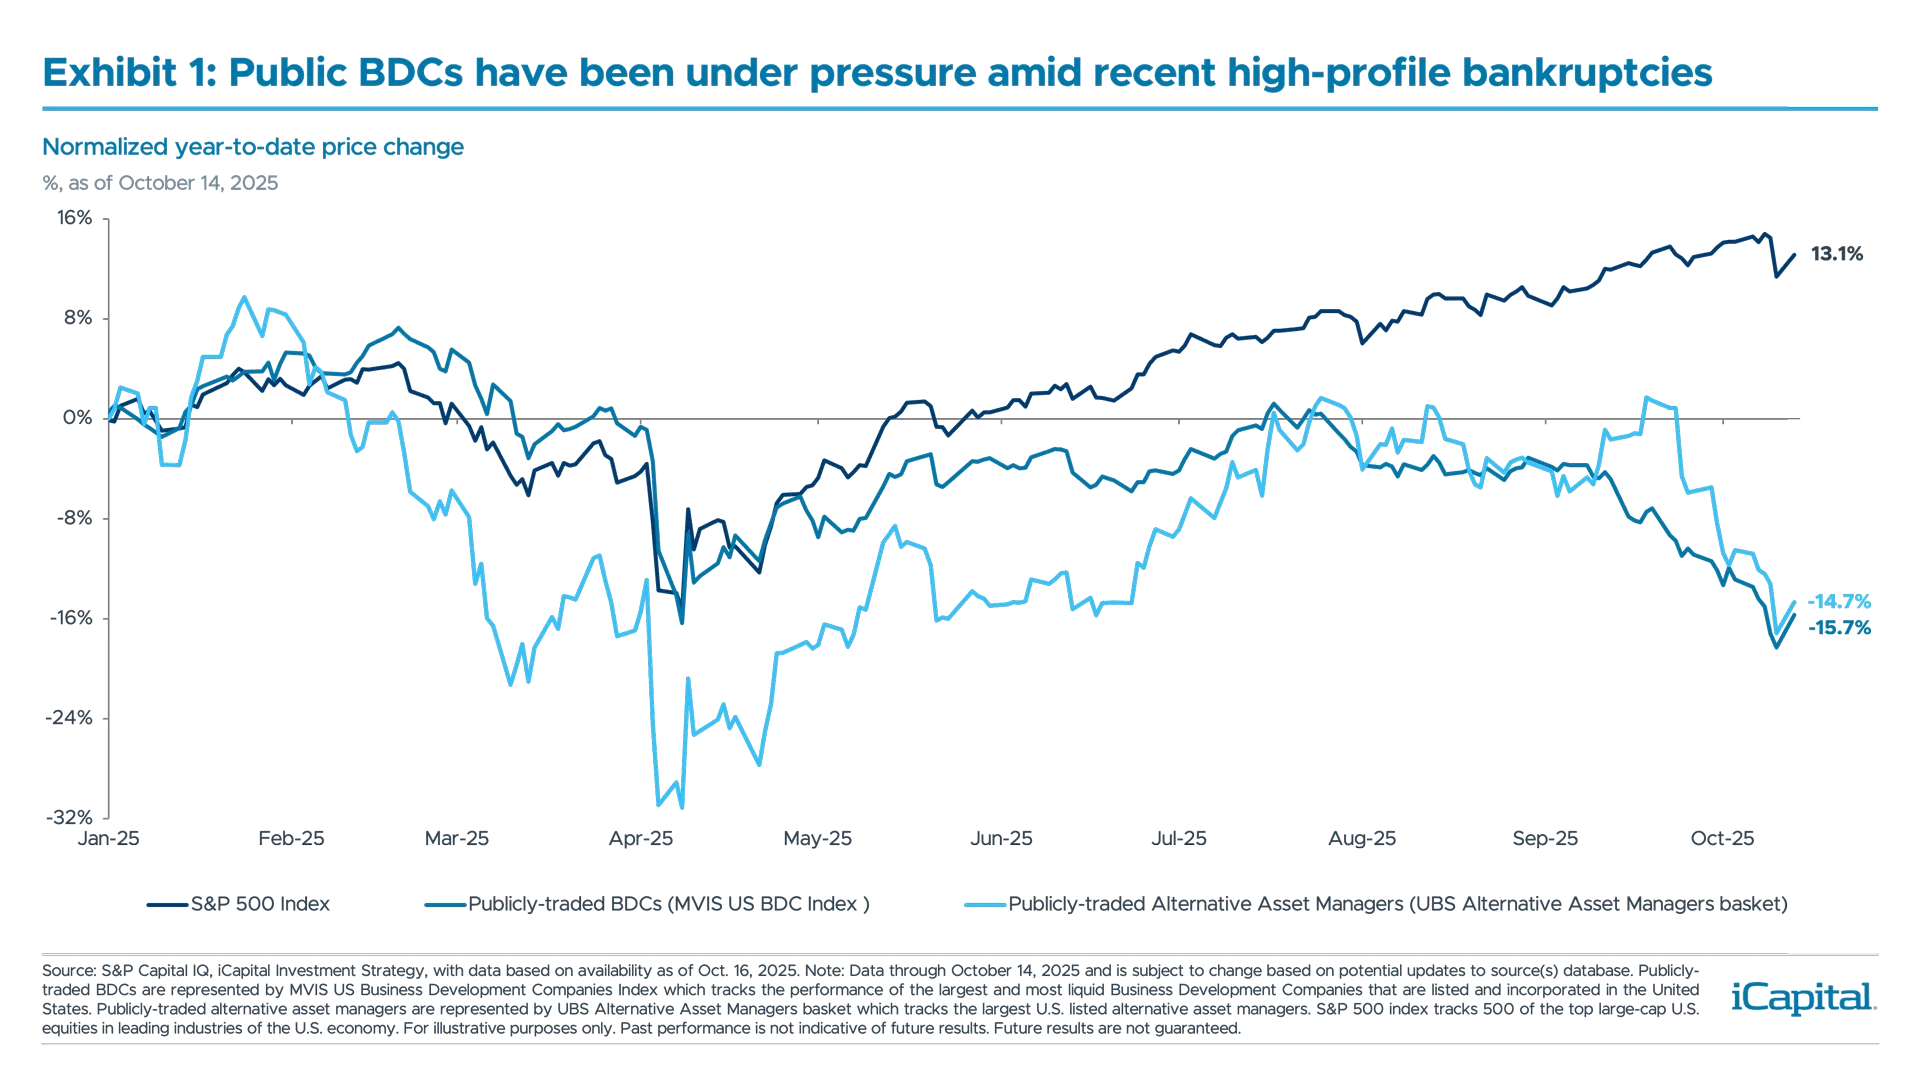 While this correction signals investor concern, we believe the move is overdone. Some volatility is justified given shifting rate cut expectations and a moderating earnings outlook for BDCs. However, the magnitude of the broader decline is disproportionate relative to underlying credit fundamentals.
In the cases of First Brands and Tricolor, losses stem largely from isolated incidents involving alleged fraud and opaque business practices – not from a breakdown in underlying demand, which would be far more concerning. Importantly, exposure to these names is limited. While we expect tighter underwriting scrutiny, we view these bankruptcies as idiosyncratic rather than systemic.
For now, we do not see evidence of broader contagion or spillover into core private credit markets. That said, we continue to monitor developments closely. Investors are right to ask tough questions of managers and GPs in light of recent headlines though we believe the fundamentals of private credit remain intact.
What Happened to First Brands and Tricolor?
First Brands, a major aftermarket auto parts supplier, filed for Chapter 11 bankruptcy in late September following multiple credit downgrades and concerns over the lack of transparency around its opaque off-balance-sheet (OBS) financing. About 70% of its revenue was tied to inventory and invoice factoring—financing methods where receivables and inventory are sold or pledged to lenders for upfront cash.5 The major turning point came in August when the company paused efforts to refinance its 2027 loans after failing to deliver a “quality of earnings” report – a detailed audit of earnings sustainability – requested by lenders.6 Soon after, Apollo reportedly shorted its debt, and several First Brands’ related OBS entities filed for bankruptcy amid allegations of double-pledging receivables to multiple lenders.7 The company has over $8 billion8 in OBS financing, and hold $5.8 billion9 in secured term loans, which is now trading below 15 cents on the dollar compared to ~90 cents in mid-September (Exhibit 2).10
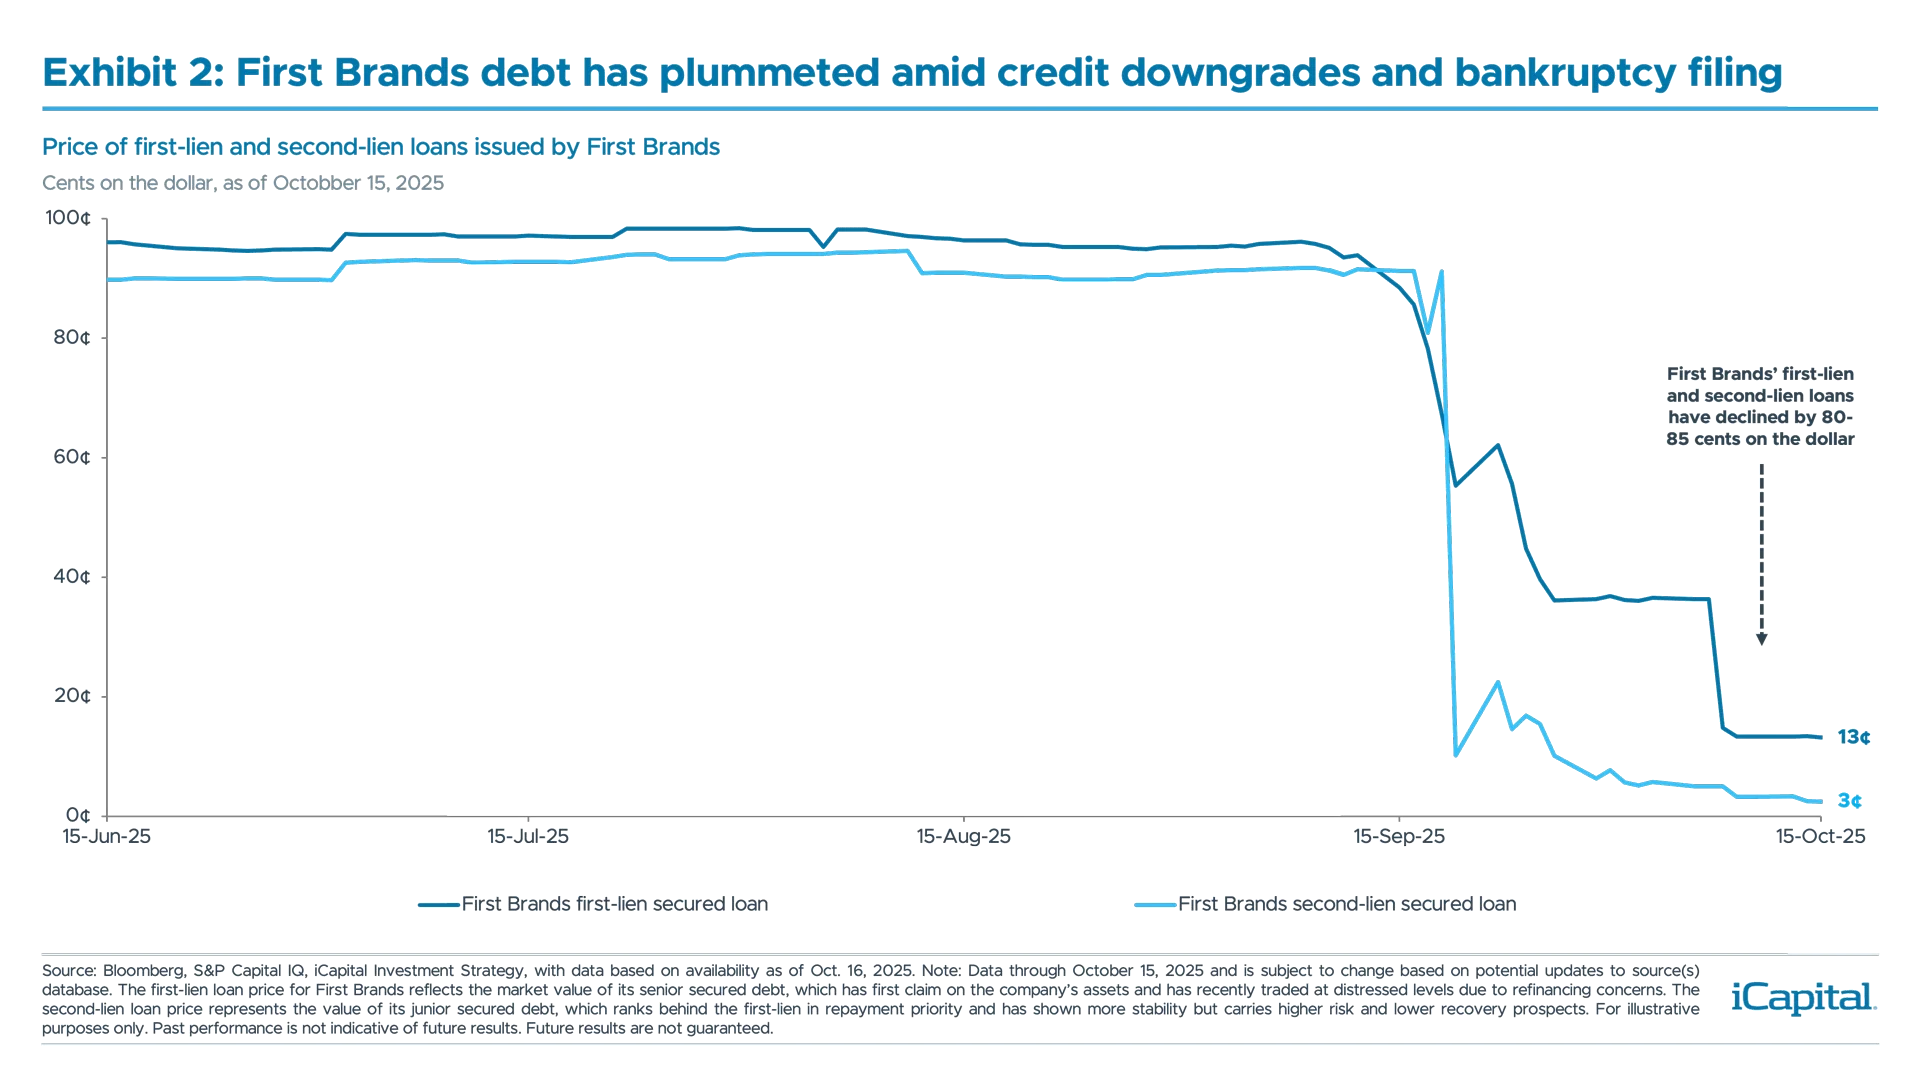 Tricolor, a subprime auto lender serving primarily lower-income households, filed for Chapter 7 liquidation in early September. It allegedly double-pledged loans using the same collateral to secure financing from multiple lenders. Around 40% of its portfolio showed identical attributes to at least one other loan, meaning Tricolor received multiple financings for the same assets.11 This inflated asset performance and masked rising delinquencies. Tricolor’s troubles highlight vulnerabilities that can be found in the growing asset-based lending (ABL) market particularly where consumer loans are involved.
Despite differing circumstances, both First Brands and Tricolor underscore the growing complexity of credit markets – specifically private credit which now spans beyond traditional direct lending and into specialty finance and asset-based lending.
Mapping The Exposure
Direct exposure to these bankruptcies is limited. Tricolor poses minimal risk, as its subprime consumer ABS and warehouse lines were largely bank-financed12 , with little to no known exposure across BDCs or private markets as of Q2 2025.13
First Brands, however, has broader touchpoints given its $5.8 billion in term loans14, though still modest in aggregate. Based on our analysis of Q2 2025 data, 15 BDCs – 11 private and four public – held a combined $237 million (at principal) in primary exposure to First Brands (Exhibit 3).15 This represents just 0.05% of the $503 billion in AUM held across the 166 funds in the public and private BDC universe.16 For most of these funds, First Brands account for less than 2% of net assets.17 And while this is indeed modest, it is important to note that prior to First Brands turmoil, many of these exposed BDCs marked the debt to ~90-95 cents on the dollar, meaning net asset values have (or will) adjust to reflect current fair value market pricing.18
 There is also some secondary exposure through collateralized loan obligation (CLOs), as several BDCs hold CLOs that include First Brands loans. Roughly $2.7 billion of First Brands loans are spread across 517 CLO vehicles managed by 69 firms – amounting to just 0.2% of total U.S. and European CLO collateral.19 Even at the manager level, exposure is minimal, ranging between 0.1 and 180 basis points (bps).20
The more uncertain piece involves the indirect exposure to First Brands’ $8 billion in off-balance-sheet financing.21 Reported exposures include Jefferies’ Point Bonita Capital, UBS’s O’Connor hedge-fund unit, Millenium, and Japan’s Norinchukin Bank.22 Importantly though, many of these OBS financing claims are still being adjudicated – determining which receivables are valid and which lenders hold priority – and will take time to full play out. While this may create some temporary noise, the potential losses appear concentrated in a handful of names and does not signal broader contagion across private credit.
Traditional direct lenders and BDCs have limited exposure to OBS financing, however, private credit managers active in factoring and trade finance (a form of ABL – see our ABL primer here) may have a bit more exposure. Still, given the relative nascency of private ABL, we do not view this as a broad-based concern for private credit.
Credit Fundamentals Remain Sound and Don’t Point to Systemic Risk
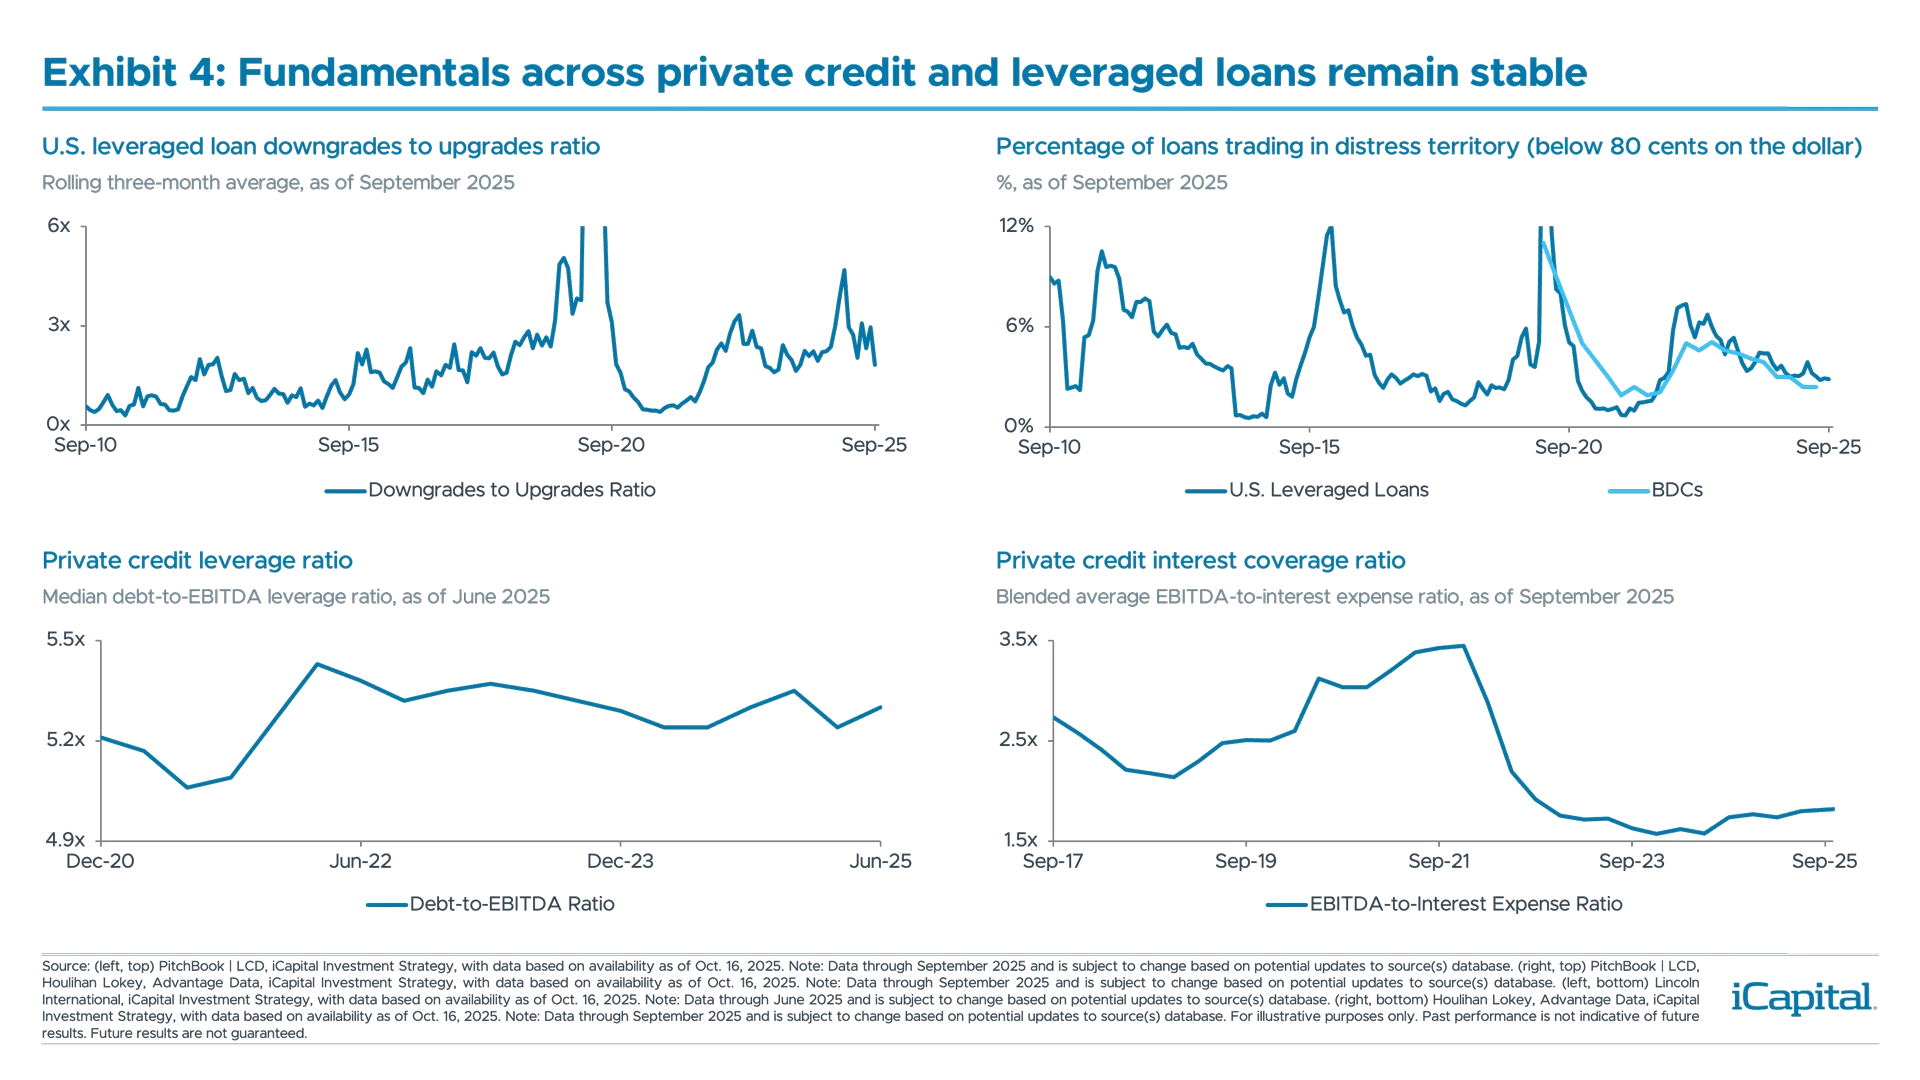
Both First Brands and Tricolor issues stem from alleged fraud, not operational failures. While we expect tighter underwriting and more idiosyncratic credit developments ahead, aggregate fundamentals across private credit and leveraged loans remain stable (Exhibit 4) and may improve as rate cuts ease interest burdens.
- Upgrades outpacing downgrades: The downgrade-to-upgrade ratio in leveraged loans for September just hit its best level since April 2024 – signaling stabilization in credit quality.23
- Distress levels at relative lows: Only 2.4% of BDC loans24 and 0.9% of private credit CLOs25 trade below 80 cents on the dollar (a common indicator of stress). Leveraged loans overall sit near 2.9% vs. greater than 8% during broader credit stress events.26
- Leverage stable: Median gross leverage ratios across private credit portfolios has remained stable around 5.3x over the past few quarters27 – signaling companies have managed to preserve margin and remained conservative in balance sheet management.
- Coverage ratios improving: EBITDA coverage has risen to 1.8x from 1.5x in late 2023, with expectations for further gradual improvements as rates decline.28
 Drawing on other recent private credit events – Peraton (May 2025) and Pluralsight (2024) – BDC exposure to those names was ~$600 million and ~$800 million, respectively, far larger than First Brands’ $237 million.29 Both Peraton and Pluralsight were contained credit events, with no broader market contagion, reinforcing the view that First Brands is similarly idiosyncratic, and not systemic events.
Private Credit Is Not Without Headwinds
Forward base rates (3-month SOFR) have declined, with markets pricing in ~125 bps cuts through 2026.30 Lower rates could reduce net interest income (NII), pressuring BDC earnings and dividend sustainability. During the 2019 rate cuts, public BDC NII fell ~5-10% QoQ initially, leading to dividend cuts in some cases.31 While we expect dividend coverage to remain relatively steady as managers have different levers to pull on, early Q3 earnings previews suggest similar pressures are in place.
Spread compression is also a concern, driven by increased bank competition. New issue spreads are running at 2017 levels32 – lower yields on new deals mean weaker future income, but current net asset values (NAV) look stronger.
Most current distress is tied to cyclical pressures in consumer-facing sectors like retail and auto (~11% of direct lending exposure33 ), not fraud. While the broader consumer remains resilient, we’re monitoring signs of strain in lower-income cohorts as the labor market softens which could lead to a further cooling in consumption.
What We’re Watching
As the situation continues to evolve, we’re closely monitoring several key developments:
- Public BDC Earnings: Over 65% of public BDCs report earnings the week of November 7, which should provide a clearer window into portfolio health and manager sentiment.34
- Publicly-traded Alternative Asset Managers: Earnings calls will offer insight into how GPs view stress in illiquid private credit and ABL.
- Credit Spread Movements: A widening could signal rising risk aversion or deteriorating fundamentals.
- First Brands OBS Financing Resolution: Adjudication outcomes will shape recovery values and potential ripple effects.
Investment Implications: Selectively Looking At Opportunities Within Public BDCs
Investor sentiment has turned cautious. Bank of America’s October Fund Manager Survey flagged private credit as the most likely source of systemic stress.35 Our own iCapital Flow-of-Funds data shows a slight pullback in investor interest in private credit in the first week of October.36 And the median public BDC now trades at a 19% discount to NAV, which is in the 32%-tile over a ten-year lookback (Exhibit 5).37
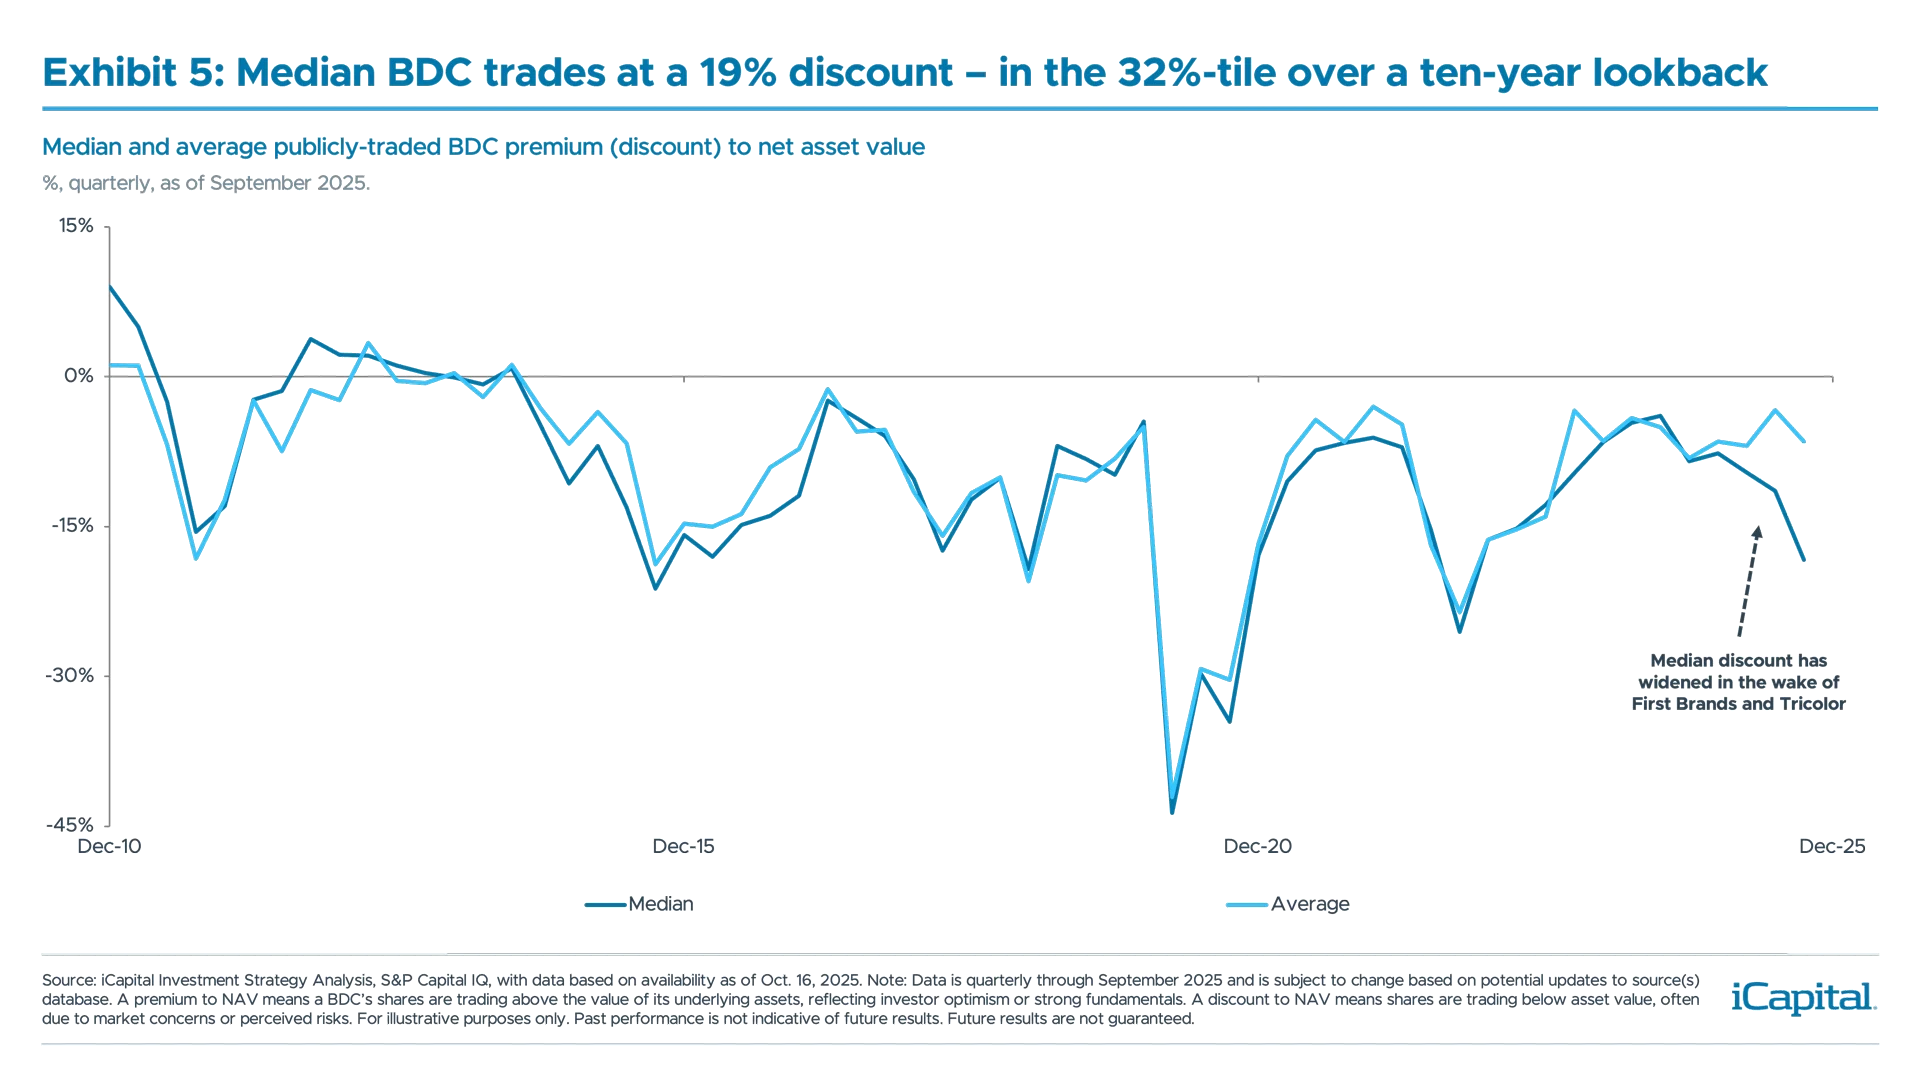 However, given these bankruptcies are idiosyncratic, the selloff is overdone relative to fundamentals, in our view. Many public BDCs with no First Brands exposure now trade >20% below NAV – well below pre-turmoil levels and their longer-run averages.38 While we would still be cautious stepping back in, we see opportunities in well-managed public BDCs with strong dividend coverage (>100%), high first-lien secured debt exposure (>75%), disciplined capital management, and a long track record.
Bottom Line
The headlines around First Brands and Tricolor have sparked concern, but the foundation of private credit remains intact. We believe these bankruptcies are isolated single-name events, not systemic. While tighter underwriting and more scrutiny are ahead, credit fundamentals are stable, and exposure is contained. We remain constructive on private credit’s resilience – even as the market evolves.
INDEX DEFINITIONS
S&P 500 Index: The S&P 500 is widely regarded as the best single gauge of large-cap U.S. equities. The index includes 500 of the top companies in leading industries of the U.S. economy and covers approximately 80% of available market capitalization.
MVIS US Business Development Companies Index: tracks the performance of the largest and most liquid Business Development Companies that are listed and incorporated in the United States.
UBS Alternative Asset Managers Basket: tracks the largest U.S. listed alternative asset managers.
END NOTES
- iCapital Investment Strategy Analysis, LSEG BDC Collateral, Advantage Data, SEC filings of Company data as of Oct. 15, 2025. Note: Primary exposure includes BDCs with direct ownership to First Brands debt/loans. It doesn’t take into account fund ownership of First Brands via collateralized loan obligations.
- iCapital Investment Strategy Analysis, LSEG BDC Collateral, Advantage Data, SEC filings of Company data as of Oct. 15, 2025.
- S&P Capital IQ, as of Oct. 15, 2025. Note: Publicly-traded BDCs are represented by MVIS US Business Development Companies Index.
- S&P Capital IQ, as of Oct. 16, 2025. Note: Publicly-traded alternative asset managers are represented by UBS Alternative Asset Managers basket.
- Bloomberg News, as of Sept. 30, 2025.
- 9fin, as of Sept. 25, 2025
- The Wall Street Journal, as of Oct. 9, 2025.
- Financial Times (FT Alphaville), as of Sept. 29, 2025.
- Morgan Stanley, as of Sept. 26, 2025.
- Bloomberg, S&P Capital IQ, as of Oct. 15, 2025.
- Bloomberg News, as of Oct. 3, 2025.
- Barron’s, as of Oct. 6, 2025.
- BDC Credit Reporter, Advantage Data, as of Sept. 29, 2025.
- Morgan Stanley, as of Sept. 26, 2025.
- iCapital Investment Strategy Analysis, LSEG BDC Collateral, Advantage Data, SEC filings of Company data as of Oct. 15, 2025. Note: Primary exposure includes BDCs with direct ownership to First Brands debt/loans. It doesn’t take into account fund ownership of First Brands via collateralized loan obligations.
- iCapital Investment Strategy Analysis, LSEG BDC Collateral, Advantage Data, SEC filings of Company data as of Oct. 15, 2025.
- iCapital Investment Strategy Analysis, LSEG BDC Collateral, Advantage Data, SEC filings of Company data as of Oct. 15, 2025.
- iCapital Investment Strategy Analysis, LSEG BDC Collateral, Advantage Data, SEC filings of Company data as of Oct. 15, 2025.
- Morgan Stanley, as of Sept. 26, 2025.
- Morgan Stanley, as of Sept. 26, 2025. Note: A basis points is 1/100th of a percentage point
- Financial Times (FT Alphaville), as of Sept. 29, 2025.
- iCapital Investment Strategy Analysis, Bloomberg News, CNBC, Reuters, as of Oct. 15, 2025.
- PitchBook | LCD, as of Sept. 30, 2025
- Houlihan Lokey, Advantage Data, as of Mar. 31, 2025.
- Morgan Stanley, as of Sep. 4, 2025.
- iCapital Investment Strategy Analysis, PitchBook | LCD, as of Sept. 30, 2025
- Lincoln International, as of Jun. 30, 2025.
- Houlihan Lokey, Advantage Data, as of Mar. 31, 2025.
- BDC Credit Reporter, Advantage Data, as of Sept. 29, 2025.
- S&P Capital IQ, as of Oct. 15, 2025.
- iCapital Investment Strategy Analysis, S&P Capital IQ, as of Oct. 15, 2025.
- JPMorgan, as of Oct. 1, 2025.
- Cliffwater, as of Jun. 30, 2025.
- S&P Capital IQ, as of Oct. 15, 2025.
- Bank of America, as of Oct. 13, 2025.
- iCapital, as of Oct. 15, 2025. Note: iCapital Flow-of-Funds data is based upon the notional flow on the iCapital Alternatives platform, which does not necessarily reflect the entire universe of alternative investments that are available in the market. The statement does not necessarily reflect any individual fund.
- iCapital Investment Strategy Analysis, S&P Capital IQ, as of Oct. 15, 2025.
- iCapital Investment Strategy Analysis, S&P Capital IQ, as of Oct. 15, 2025.
IMPORTANT INFORMATION
The material herein has been provided to you for informational purposes only by Institutional Capital Network, Inc. (“iCapital Network”) or one of its affiliates (iCapital Network together with its affiliates, “iCapital”). This material is the property of iCapital and may not be shared without the written permission of iCapital. No part of this material may be reproduced in any form, or referred to in any other publication, without express written permission of iCapital.
This material is provided for informational purposes only and is not intended as, and may not be relied on in any manner as, legal, tax or investment advice, a recommendation, or as an offer or solicitation to buy or sell any security, financial product or instrument, or otherwise to participate in any particular trading strategy. This material does not intend to address the financial objectives, situation, or specific needs of any individual investor. You should consult your personal accounting, tax and legal advisors to understand the implications of any investment specific to your personal financial situation.
ALTERNATIVE INVESTMENTS ARE CONSIDERED COMPLEX PRODUCTS AND MAY NOT BE SUITABLE FOR ALL INVESTORS. Prospective investors should be aware that an investment in an alternative investment is speculative and involves a high degree of risk. Alternative Investments often engage in leveraging and other speculative investment practices that may increase the risk of investment loss; can be highly illiquid; may not be required to provide periodic pricing or valuation information to investors; may involve complex tax structures and delays in distributing important tax information; are not subject to the same regulatory requirements as mutual funds; and often charge high fees. There is no guarantee that an alternative investment will implement its investment strategy and/or achieve its objectives, generate profits, or avoid loss. An investment should only be considered by sophisticated investors who can afford to lose all or a substantial amount of their investment.
iCapital Markets LLC operates a platform that makes available financial products to financial professionals. In operating this platform, iCapital Markets LLC generally earns revenue based on the volume of transactions that take place in these products and would benefit by an increase in sales for these products.
The information contained herein is an opinion only, as of the date indicated, and should not be relied upon as the only important information available. Any prediction, projection or forecast on the economy, stock market, bond market or the economic trends of the markets is not necessarily indicative of the future or likely performance. The information contained herein is subject to change, incomplete, and may include information and/or data obtained from third party sources that iCapital believes, but does not guarantee, to be accurate. iCapital considers this third-party data reliable, but does not represent that it is accurate, complete and/or up to date, and it should not be relied on as such. iCapital makes no representation as to the accuracy or completeness of this material and accepts no liability for losses arising from the use of the material presented. No representation or warranty is made by iCapital as to the reasonableness or completeness of such forward-looking statements or to any other financial information contained herein.
Securities products and services are offered by iCapital Markets LLC, an SEC-registered broker-dealer, member FINRA and SIPC, and an affiliate of iCapital, Inc. and Institutional Capital Network, Inc. These registrations and memberships in no way imply that the SEC, FINRA, or SIPC have endorsed any of the entities, products, or services discussed herein. Annuities and insurance services are provided by iCapital Annuities and Insurance Services LLC, an affiliate of iCapital, Inc. “iCapital” and “iCapital Network” are registered trademarks of Institutional Capital Network, Inc. Additional information is available upon request.
©2025 Institutional Capital Network, Inc. All Rights Reserved.


