The shock of a rapid rise in interest rates in 2022, following a record-shattering year for deal value in 2021, all but stalled private equity (PE) exit deal activity through much of 2023.1 The good news is that if the global macro-backdrop turns more supportive throughout 2024, it should lead to an improving exit environment. Encouragingly, green shoots have begun to emerge. Disinflationary trends remain intact with core personal consumption expenditures (PCE) inflation set to fall to 2.3% by the second quarter of 2024, while the growth outlook remains stable with GDP growth still above the 2.0% potential.2 And over the coming months, central banks across the globe are expected to enter one of the largest easing cycles outside of the pandemic or global financial crisis.3
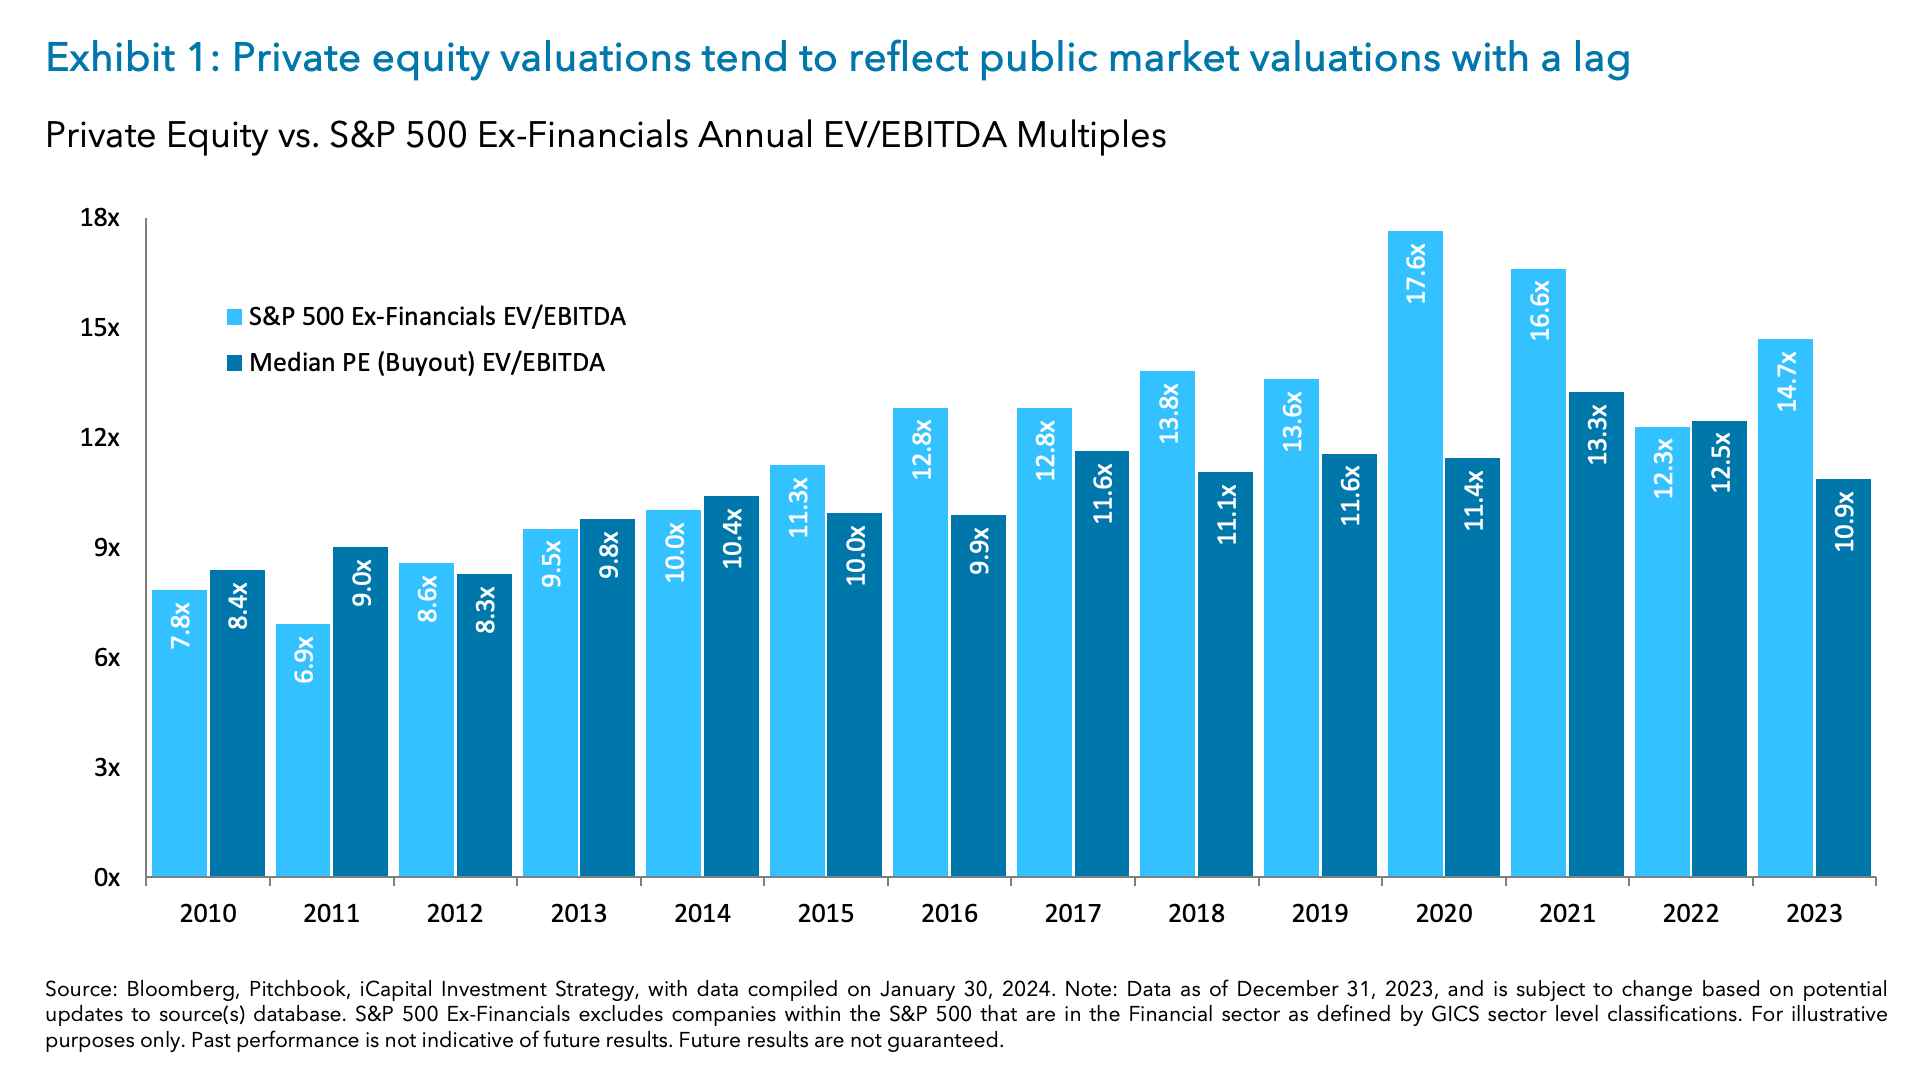
Together, this should give general partners (GPs) more confidence in valuations and improve the overall risk appetite for investors. Indeed, public markets have already repriced significantly with the S&P 500 now up +39% from its October 2022 low.4 And public market valuations are also pushing meaningfully higher, which is often a leading indicator for private market multiples (Exhibit 1).5 This should lead to some convergence between what buyers and sellers think assets are worth and begin to revive private equity exit activity.
Longer hold times are pushing up against exit timelines
Of course, there also has to be an incentive to do a deal. The slowdown in deal activity has mainly been driven by GPs not willing to accept lower valuations. Many GPs have been holding on to their assets longer rather than selling or taking them to market at adverse valuation terms.
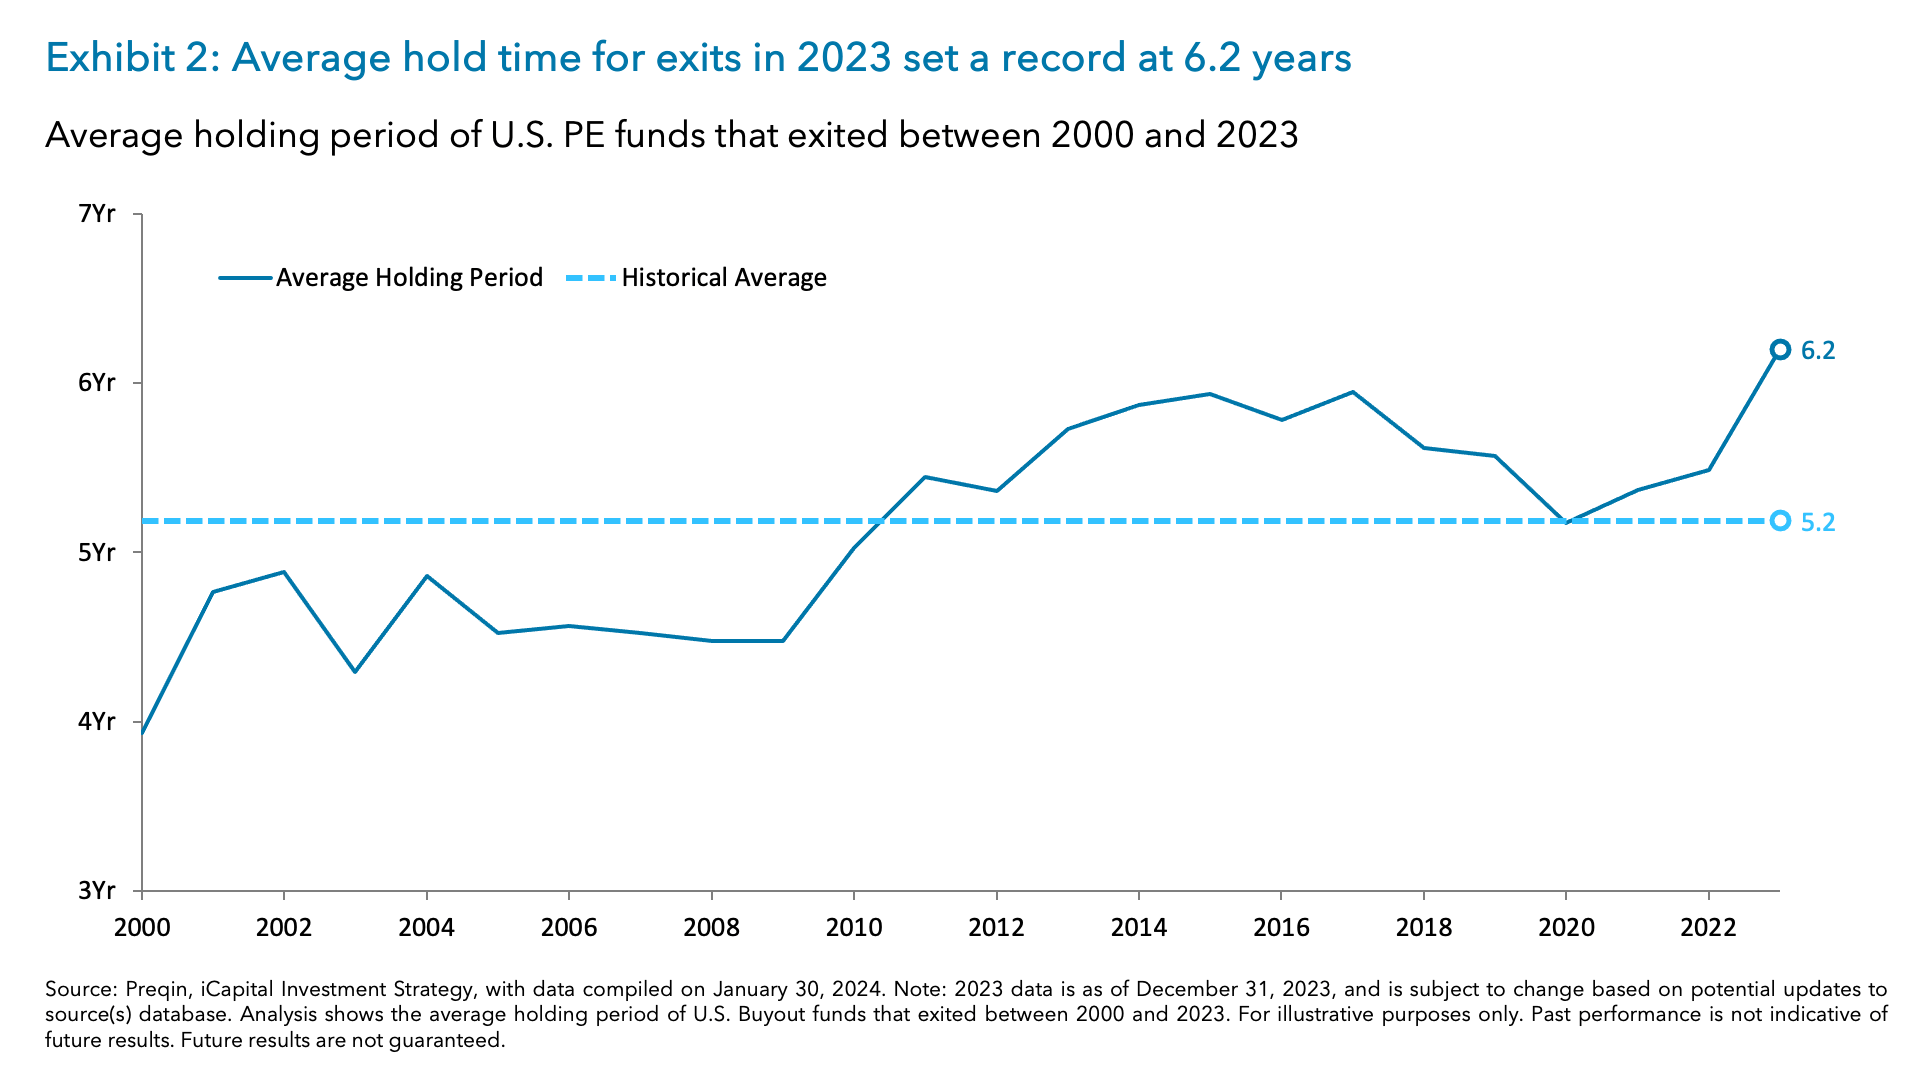
This is resulting in an increase in hold times across the board. For the companies that exited in 2023, the average hold time was 6.2 years – the highest level on record (Exhibit 2).6 And of the nearly 11,000 companies in the U.S. that are currently PE-backed, the median hold time was extended to 4.2 years, surpassing the prior five-year average of 3.8 years.7
In other words, a substantial number of PE deals are now nearing their natural exit timeline. Many GPs need to sell portfolio companies by the end of the fund’s lifespan. And many funds tend to finance their investments through term loans with maturities that typically range six to seven years.8
The delay in exits not only impacts fund managers but also impacts Limited Partners (LPs), restricting the amount of proceeds from exits that could have otherwise been committed to new funds. This suggests that GPs will be increasingly motivated to exit as the year progresses, as long as the right conditions exist.
Signs of revival for leveraged finance activity
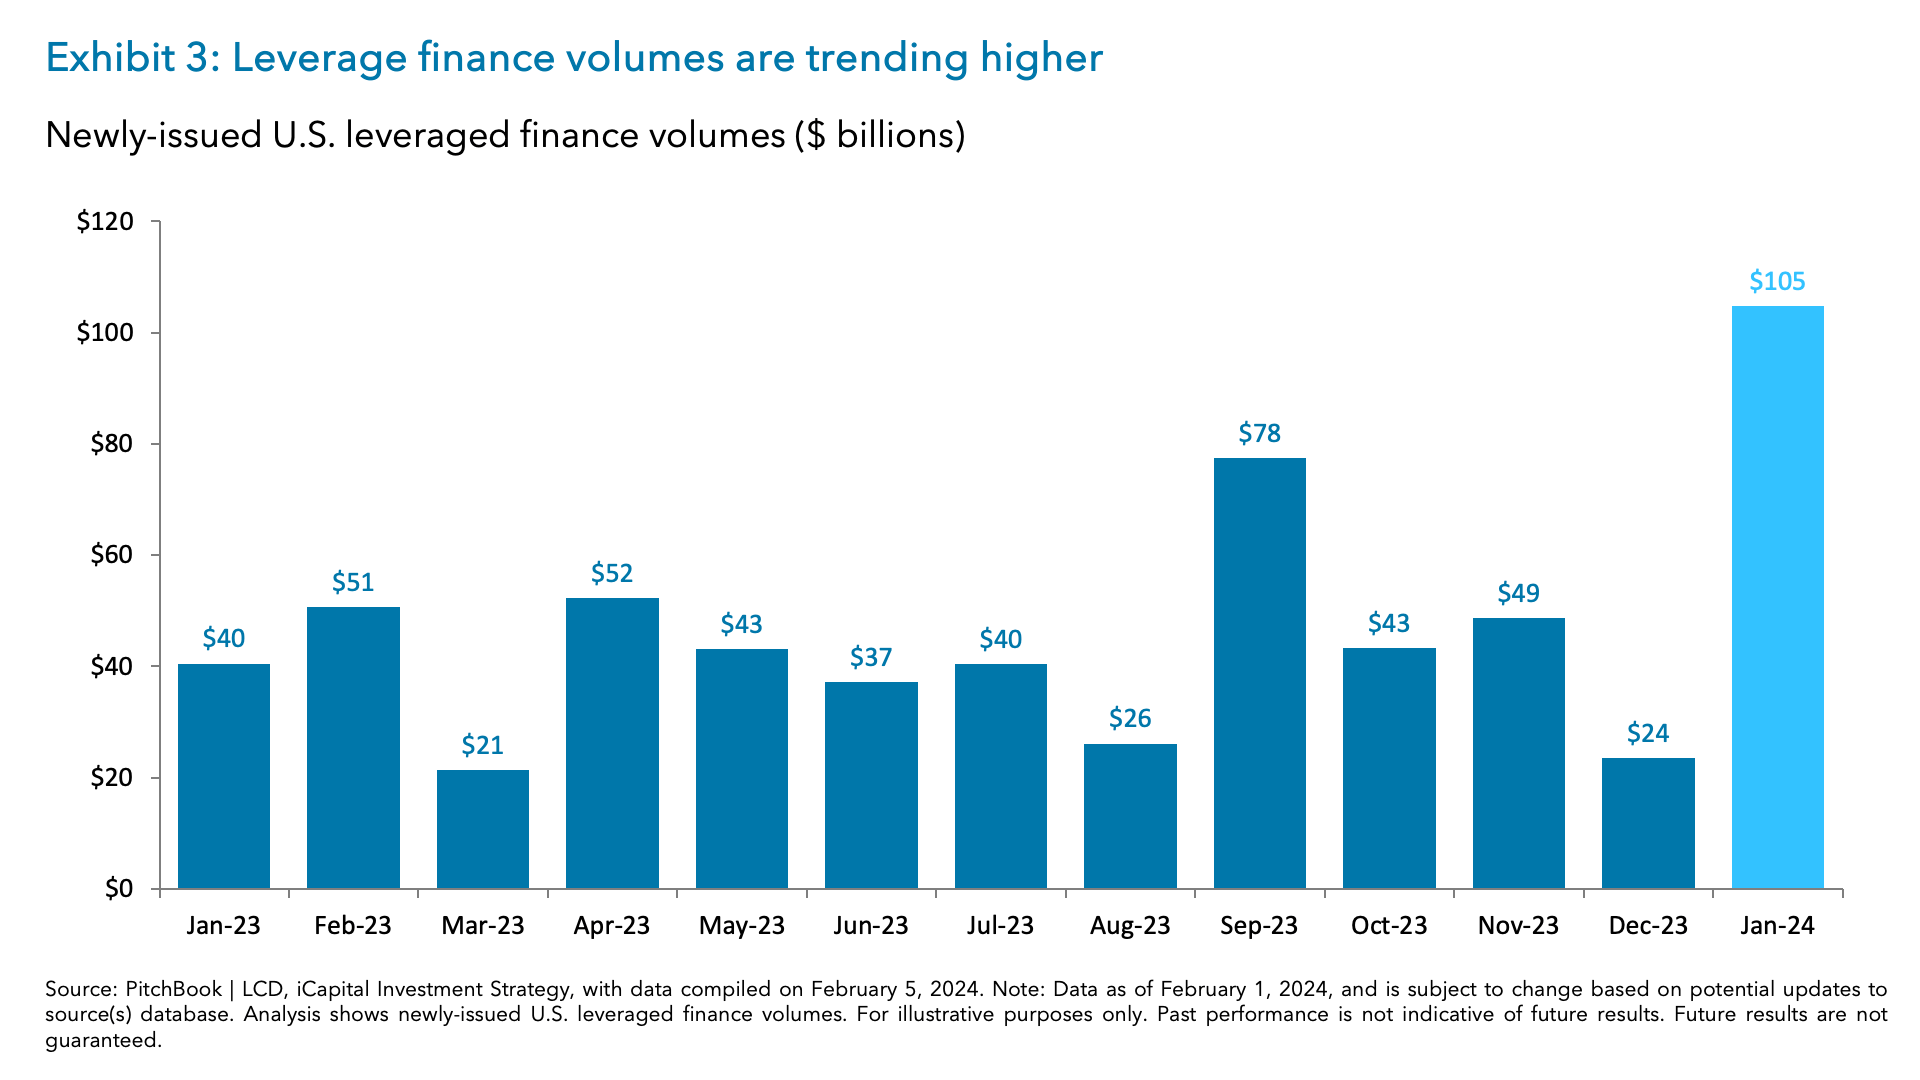
As a recovery in private company valuations helps bring buyers and sellers together, the leveraged loan market is also showing signs of a resurgence. January 2024 leveraged finance volume of $105 billion was 2.5x the level from last January (Exhibit 3). The January 2024 loan volumes includes record high refinancing activities, suggesting companies are taking advantage of lower borrowing costs while the strong new issuance indicates an improving pipeline for additional deal financing.9
The leveraged loan market has been a common source of financing for private equity firms, but higher rates over the last two years have slowed the use of the debt to fund transactions. The increase in refinancing signals borrowing costs are falling. Indeed, new issue yields have declined 166 basis points from their 2023 highs10, which is an optimistic indicator for dealmaking activity.
Exit deal activity may be turning the corner
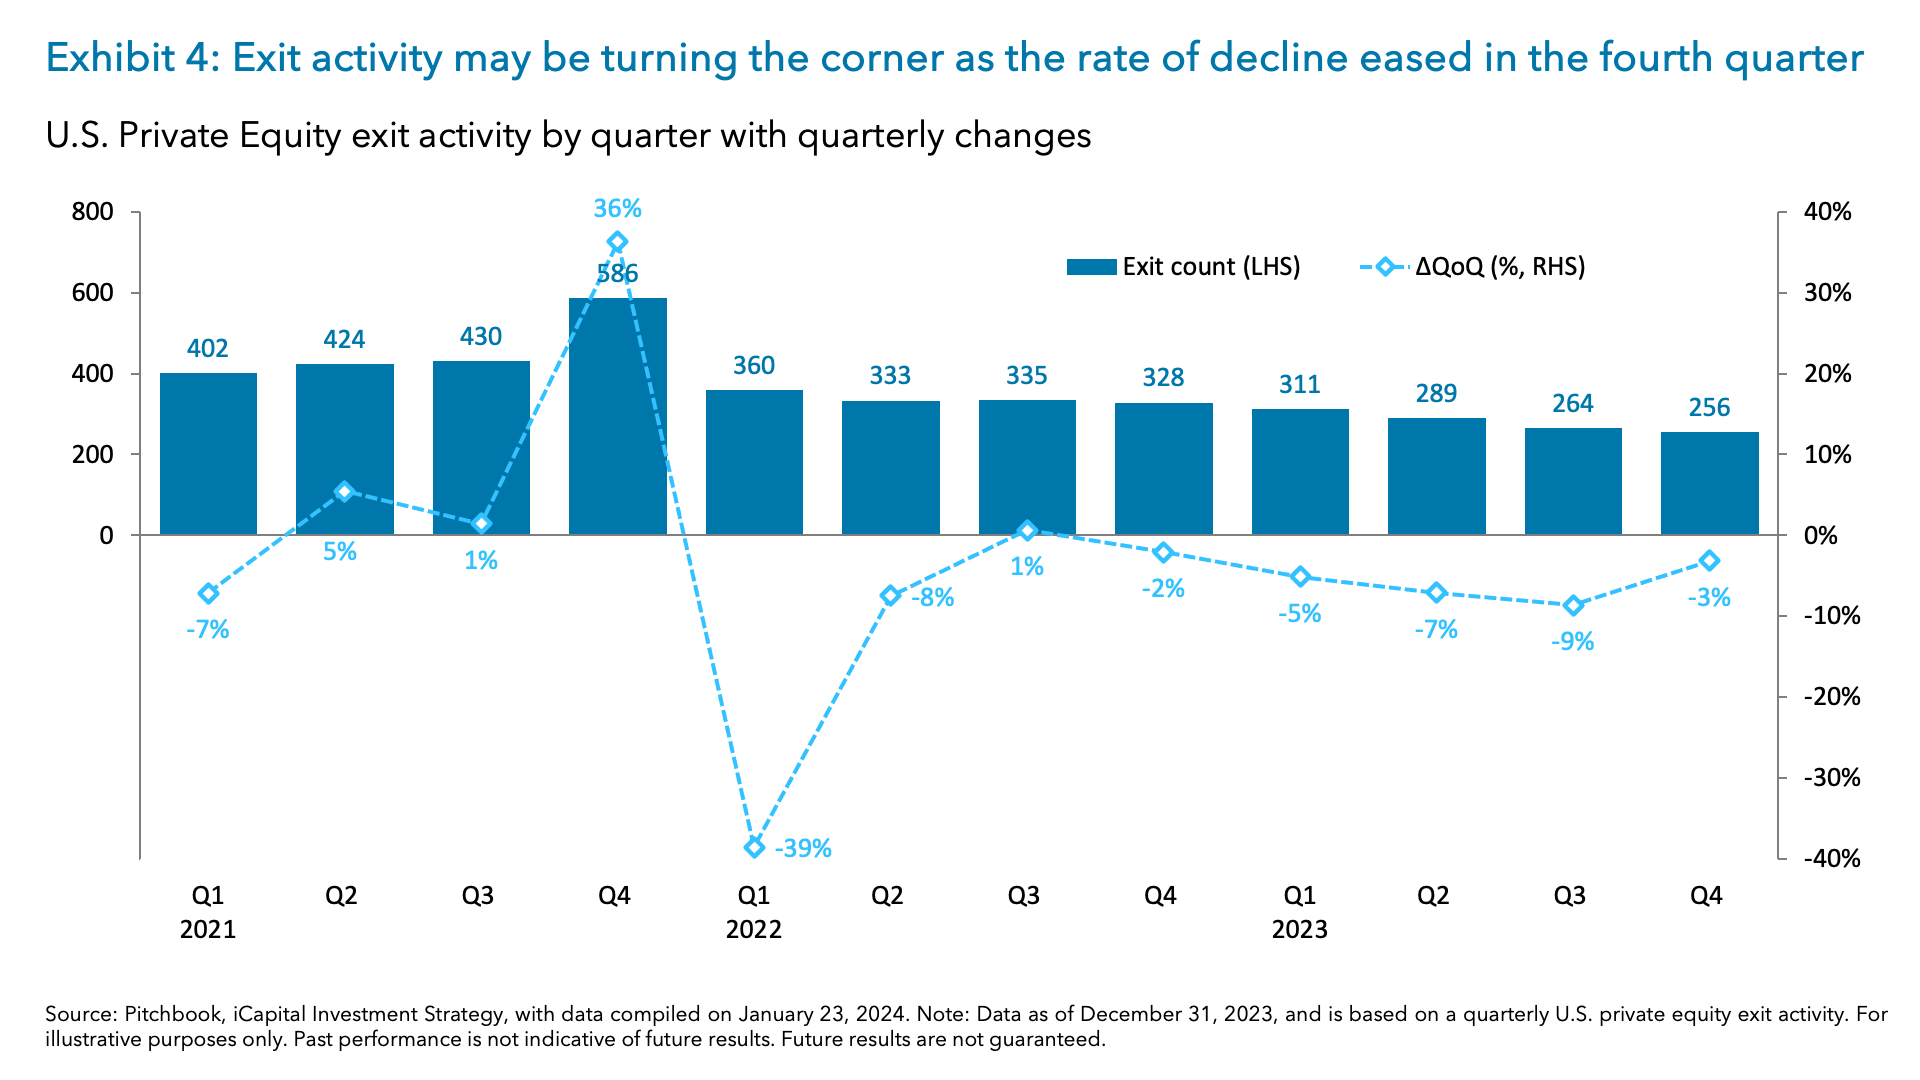
U.S. PE exit activity in 2023 continued its decline from 2022 levels, albeit at a slower pace than the year prior, which perhaps signals a change in trajectory.11 An estimated 1,121 PE-backed companies, worth a combined value of $234 billion, either exited or were announced to be exited in 2023.12 This marks a 17.4% decline from 2022, but represents an improvement from the 26.4% decrease seen in 2022.13 The quarterly exit activity also points to a potential turning point, as the rate of decline eased in the fourth quarter, indicating that the slowdown in activity may have reached its lowest point in the third quarter (Exhibit 4).14
Pressure has been building on GPs to return capital to investors. In fact, the slump in exit activity has led the industry to seek alternative liquidity approaches such as secondaries, continuation funds and NAV financing, all of which were more widely used in 2023.15 But now with PE-backed exit activity showing signs of modest improvements – and with firmer comfort in the macro environment – the momentum could carry into 2024.
More conducive capital markets backdrop supports exit activity
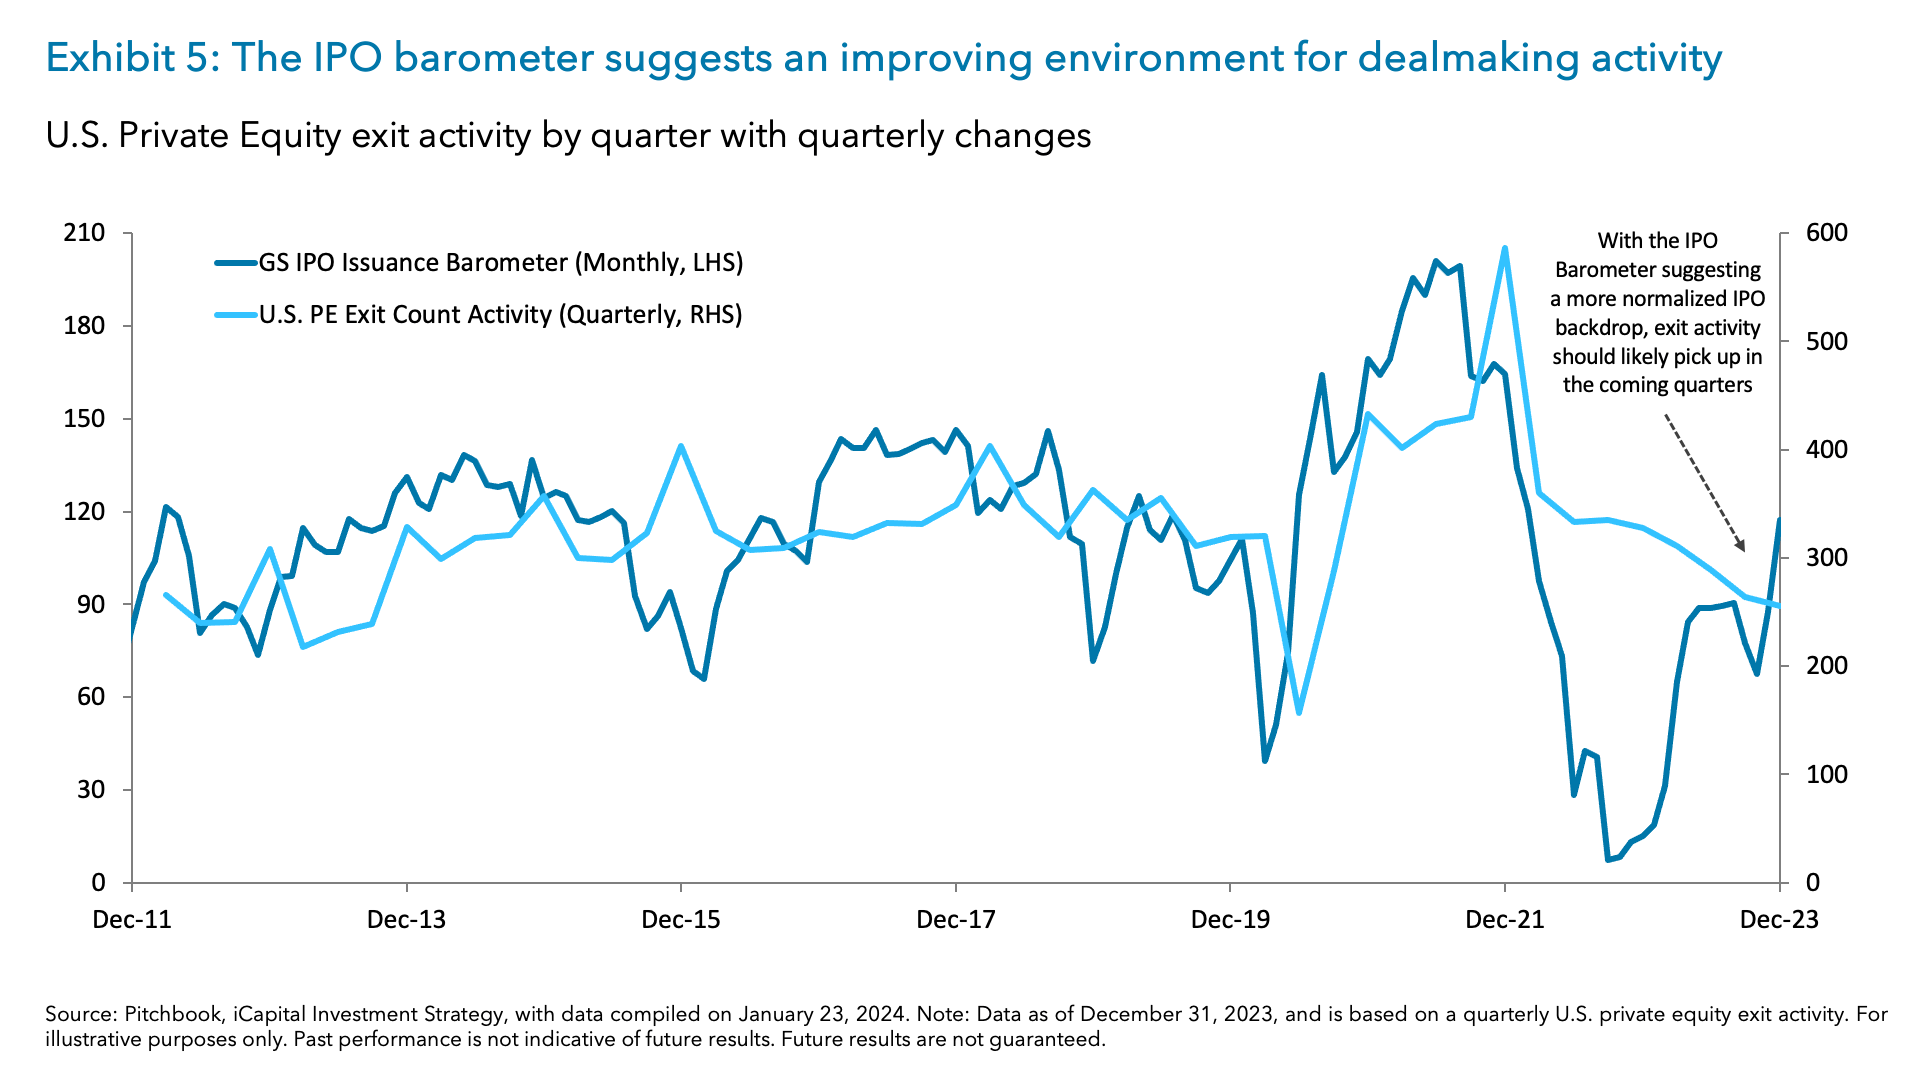
Traditional exits, especially initial public offerings (IPOs), are the preferred and most lucrative liquidity event for GPs. And while certainly not an “all clear” signal, the macro environment continues to become more conducive to IPOs, providing hope for the exit environment. Indeed, the Goldman Sachs IPO Issuance Barometer – a gauge at how conducive the macro backdrop is for IPOs – continues to improve and suggests a more normalized IPO pipeline going forward.16 This suggests that as the barometer improves so too should exit activity over the following quarters (Exhibit 5).17
Where does this leave us for 2024?
With green shoots emerging, 2024 should be a promising year for PE exit activity. An improving global macro-backdrop with disinflationary trends and stable GDP growth is boosting confidence in valuations and investor risk appetite. Longer hold times for PE are nearing their natural exit timeline, motivating GPs to sell portfolio companies. And signs of revival in leveraged finance activity and a more conducive capital markets backdrop, particularly for IPOs, further support the outlook for increased exit deal activity in the coming year.
For more on the Private Equity exits and the broader Private Equity landscape, please check out our most recent episode of Beyond 60/40 where we sit down with Ashmi Mehrotra, Global Co-Head of the Private Equity Group at J.P. Morgan Asset Management.
1. PitchBook, iCapital Investment Strategy, as of Jan. 9, 2024
2. Bloomberg, iCapital Investment Strategy, as of Feb. 2, 2024.
3. Bloomberg, iCapital Investment Strategy, as of Feb. 2, 2024.
4. Bloomberg, iCapital Investment Strategy, as of Feb. 2, 2024.
5. Bloomberg, PitchBook, iCapital Investment Strategy, as of Feb. 2, 2024.
6. S&P Global, Preqin, iCapital Investment Strategy, as of Nov. 15, 2023. Analysis is based on average holding period of US and Canada Buyout funds that exited between 2000 and 2023.
7. PitchBook, iCapital Investment Strategy, as of Jan. 9, 2024
8. S&PGlobal, PitchBook | LCD, iCapital Investment Strategy, as of Jan. 29, 2024.
9. PitchBook | LCD, US Credit Markets Weekly Wrap, iCapital Investment Strategy, as of Feb. 1, 2024.
10. PitchBook | LCD, US Credit Markets Weekly Wrap as of Jan. 25, 2024. Average New-Issue Yields for B-rated debt.
11. PitchBook, iCapital Investment Strategy, as of Jan. 9, 2024.
12. PitchBook, iCapital Investment Strategy, as of Jan. 9, 2024.
13. PitchBook, iCapital Investment Strategy, as of Jan. 9, 2024.
14. PitchBook, iCapital Investment Strategy, as of Jan. 9, 2024.
15. PitchBook, S&P Global, Preqin, iCapital Investment Strategy, as of Feb. 5, 2024.
16. Goldman Sachs, iCapital Investment Strategy, as Feb. 5, 2024. Note: A reading above 100 on the Goldman Sachs IPO Issuance Barometer is equal to the median number of realized IPOs historically.
17. Goldman Sachs, PitchBook, iCapital Investment Strategy, as Feb. 5, 2024.
IMPORTANT INFORMATION
The material herein has been provided to you for informational purposes only by Institutional Capital Network, Inc. (“iCapital Network”) or one of its affiliates (iCapital Network together with its affiliates, “iCapital”). This material is the property of iCapital and may not be shared without the written permission of iCapital. No part of this material may be reproduced in any form, or referred to in any other publication, without express written permission of iCapital.
This material is provided for informational purposes only and is not intended as, and may not be relied on in any manner as, legal, tax or investment advice, a recommendation, or as an offer or solicitation to buy or sell any security, financial product or instrument, or otherwise to participate in any particular trading strategy. This material does not intend to address the financial objectives, situation, or specific needs of any individual investor. You should consult your personal accounting, tax and legal advisors to understand the implications of any investment specific to your personal financial situation.
iCapital Markets LLC operates a platform that makes available financial products to financial professionals. In operating this platform, iCapital Markets LLC generally earns revenue based on the volume of transactions that take place in these products and would benefit by an increase in sales for these products.
The information contained herein is an opinion only, as of the date indicated, and should not be relied upon as the only important information available. Any prediction, projection or forecast on the economy, stock market, bond market or the economic trends of the markets is not necessarily indicative of the future or likely performance. The information contained herein is subject to change, incomplete, and may include information and/or data obtained from third party sources that iCapital believes, but does not guarantee, to be accurate. iCapital considers this third-party data reliable, but does not represent that it is accurate, complete and/or up to date, and it should not be relied on as such. iCapital makes no representation as to the accuracy or completeness of this material and accepts no liability for losses arising from the use of the material presented. No representation or warranty is made by iCapital as to the reasonableness or completeness of such forward-looking statements or to any other financial information contained herein.
Securities products and services are offered by iCapital Markets, an SEC-registered broker-dealer, member FINRA and SIPC, and an affiliate of iCapital, Inc. and Institutional Capital Network, Inc. These registrations and memberships in no way imply that the SEC, FINRA, or SIPC have endorsed any of the entities, products, or services discussed herein. Annuities and insurance services are provided by iCapital Annuities and Insurance Services LLC, an affiliate of iCapital, Inc. “iCapital” and “iCapital Network” are registered trademarks of Institutional Capital Network, Inc. Additional information is available upon request.
© 2024 Institutional Capital Network, Inc. All Rights Reserved.


