

Thursday’s selloff was historic. The Nasdaq 100 fell -6%, the S&P 500 Information Technology sector dropped -7%, and the Philadelphia Semiconductor Index plunged -12%, their steepest declines since March 2020 (Exhibit 1). The midterm election results may have been one catalyst, but the magnitude of the move suggests something broader: weeks of rotation and weakening AI sentiment had left the market vulnerable to a sharp positioning unwind.
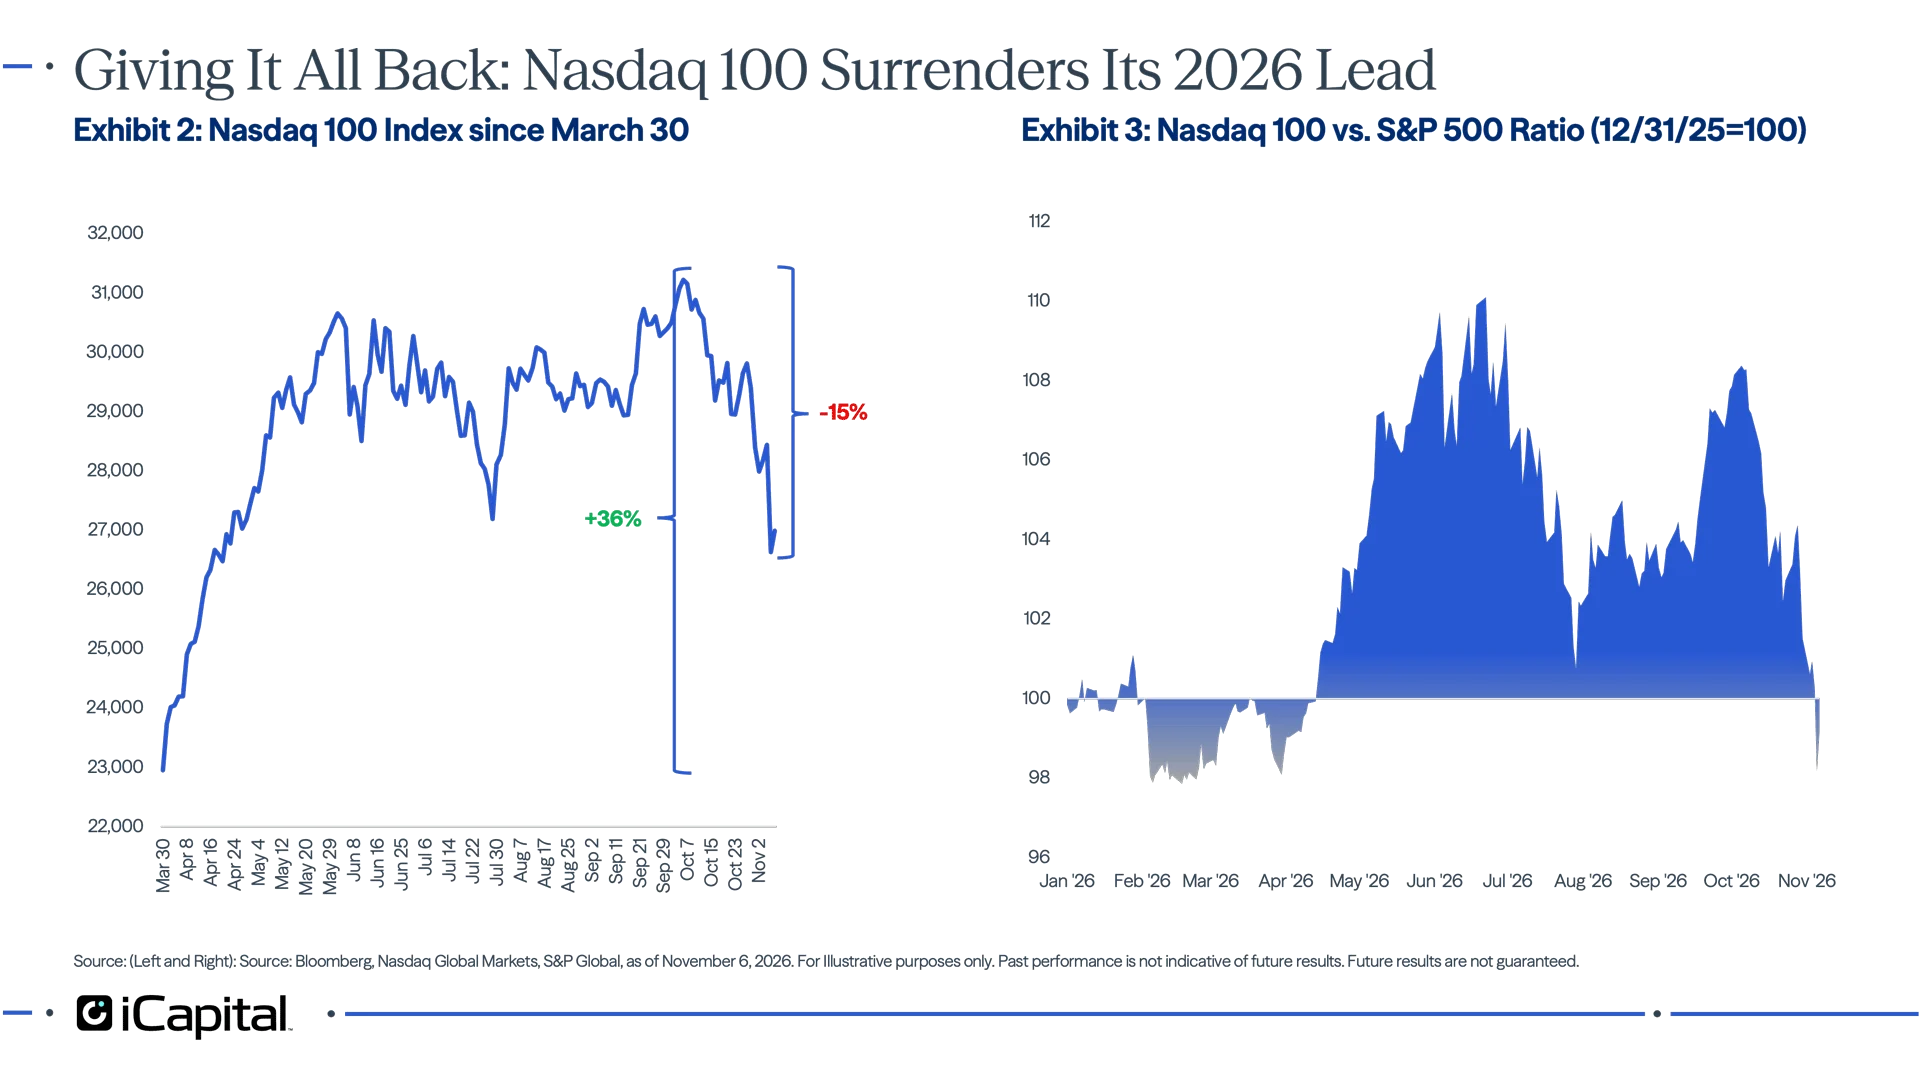
 However, Thursday’s Nasdaq 100 underperformance is not a significant departure from the trend in place since earnings season began in early October (Exhibit 2), or from the broader relative weakness since June. Relative to the S&P 500, the Nasdaq 100 has now given back nearly all of its outperformance since February (Exhibit 3). In this context, Thursday merely accelerated a rotation that was already underway.
 AI vs. everything else
Since mid-September, the AI trade has decoupled from the rest of the market, complicating hedging strategies. At first, the S&P 500 Equal Weight Index fell even as the Nasdaq 100 surged to new highs. Then the pattern reversed as the Nasdaq 100 swiftly plunged into a correction while the Equal Weight Index held onto its gains (Exhibit 4).
This trend also shows up in sector-level returns. Since the S&P 500’s October 6 peak, and even including last week’s decline, seven of 11 sectors are higher. Defensive sectors like Consumer Staples and Health Care were up double digits, but gains also extended to cyclicals such as Financials, Consumer Discretionary and Materials. Losses have been concentrated in Information Technology, Communication Services and Industrials, all driven by weakening sentiment toward the AI trade (Exhibit 5). Thursday was different: the selling spread beyond AI, with all 11 sectors declining as risk appetite deteriorated across the market (Exhibit 6).
 That stress had been building for some time. The typical stock in every sector sits at least 11% below its 52-week high, while the average stock in Information Technology, Communication Services, Industrials and Energy is already in a bear market, down more than 20%.1
Stress, but not capitulation
Despite the severity of Thursday’s move, markets are not showing the classic signs of a full washout. True capitulation is typically accompanied by high correlations, with everything selling off together for more than just one day. However, average stock correlations remain well below levels reached at prior market lows (Exhibit 7), while volatility and high-yield credit spreads have risen without approaching true panic levels (Exhibit 8).
History urges caution
History also argues against declaring an all-clear. Nasdaq selloffs of this magnitude have occurred primarily during major periods of market stress (Exhibit 9). While large down days have often been followed by near-term rebounds, one-year returns were negative 70% of the time following comparable declines (Exhibit 10). In addition, the macro backdrop of slowing earnings growth and tighter liquidity suggest ongoing market fragility.
The silver lining
There are reasons to remain constructive despite near-term volatility:
- Fundamentals remain intact. Economic and earnings growth are still strong, and the labor market remains healthy.
- Valuations and rates have become more supportive. The selloff has reset multiples (Exhibit 11), while lower Treasury yields could ease some of the liquidity pressure that contributed to the weakness (Exhibit 12).
- Policy fears may be overdone. To the extent the selloff reflected a blue-wave read-through on data centers, the weakness may be overdone. Future projects may face more scrutiny, but it’s unlikely to be as drastic or draconian as initially feared. Tighter permitting, pressure on tax incentives and concerns about power sources could slow the arrival of new data center supply and shift where it’s being built, but is unlikely to prevent them from being built. If greater scrutiny of AI spending and data center projects slows the pace of investment without derailing the buildout, that could create a more sustainable runway.
- Private capital is waiting. If the weakness persists, buying could even come from private equity firms looking to put dry powder to work.
 Two catalysts to watch
- Nvidia earnings (November 17). Results and management commentary from what has increasingly been the central bank of AI could reset expectations around AI spending and financing. The chip maker is also facing scrutiny over possible succession issues after its board announced an independent investigation into allegations that the company’s CEO was romantically involved with a woman suspected by U.S. intelligence of being a Chinese spy.
- Anthropic IPO. If the company’s public listing is delayed or priced at a lower valuation than expected, it would be perceived as negative for the ability of other privately-held AI companies to raise capital.
Bottom line
This has been a violent repricing of the AI trade that has now spilled into the broader market. Until correlations, volatility, and credit confirm a true washout, the path may remain bumpy. But with fundamentals intact and valuations lower, the setup for longer-term investors is improving. Nvidia’s results on November 17 may be the next important test.
- Bloomberg, S&P Global, as of November 6, 2026.
INDEX DEFINITIONS
Bloomberg U.S. Corporate High Yield Bond Index: The Bloomberg U.S. Corporate High Yield Bond Index measures the USD-denominated, high yield, fixed-rate corporate bond market. Securities are classified as high yield if the middle rating of Moody's, Fitch and S&P is Ba1/BB+/BB+ or below. Bonds from issuers with an emerging markets country of risk, based on Bloomberg EM country definition, are excluded.
Cboe Volatility Index: The Cboe Volatility Index® (VIX Index) is a leading measure of market expectations of near-term volatility conveyed by S&P 500 Index (SPX) option prices. Since its introduction in 1993, the VIX Index has considered by many to be the world’s premier barometer of investor sentiment and market volatility.
NASDAQ 100 Index: An index comprised of equity securities issued by 100 of the largest non-financial companies listed on the Nasdaq stock exchange. It is a modified capitalization-weighted index.
Philadelphia Semiconductor Index: The Philadelphia Stock Exchange Semiconductor IndexSM is a modified market capitalization-weighted index composed of companies primarily involved in the design, distribution, manufacture, and sale of semiconductors.
S&P 500 Index: The S&P 500 is widely regarded as the best single gauge of large-cap U.S. equities. The index includes 500 of the top companies in leading industries of the U.S. economy and covers approximately 80% of available market capitalization.
S&P 500 Consumer Discretionary Index: The S&P 500 Consumer Discretionary Index comprises those companies included in the S&P 500 that are classified as members of the GICS® Consumer Discretionary sector. The sector includes industries such as automobiles, consumer durables, apparel, hotels, restaurants, leisure, and broadline retail.
S&P 500 Consumer Staples Index: The S&P 500 Consumer Staples Index comprises those companies included in the S&P 500 that are classified as members of the GICS® Consumer Staples sector. The sector includes companies involved in food, beverage, household products, personal products, and retailing of staple consumer goods.
S&P 500 Energy Index: The S&P 500 Energy Index comprises those companies included in the S&P 500 that are classified as members of the GICS® Energy sector.
S&P 500 Financials Index: The S&P 500 Financials Index comprises those companies included in the S&P 500 that are classified as members of the GICS® Financials sector. The sector includes banks, insurance companies, capital markets firms, consumer finance companies, and diversified financial services firms.
S&P 500 Health Care Index: The S&P 500 Health Care Index comprises those companies included in the S&P 500 that are classified as members of the GICS® Health Care sector. The sector includes pharmaceuticals, biotechnology, life sciences tools and services, health care equipment, supplies, providers, and services.
S&P 500 Industrials Index: The S&P 500 Industrials Index comprises those companies included in the S&P 500 that are classified as members of the GICS® Industrials sector. The sector includes aerospace and defense, machinery, transportation, professional services, and commercial services companies.
S&P 500 Information Technology Index: The S&P 500 Information Technology Index comprises those companies included in the S&P 500 that are classified as members of the GICS® Information Technology sector. The sector includes software, hardware, semiconductor, semiconductor equipment, IT services, and electronic equipment companies.
S&P 500 Materials Index: The S&P 500 Materials Index comprises those companies included in the S&P 500 that are classified as members of the GICS® Materials sector. The sector includes chemicals, construction materials, containers and packaging, metals and mining, and paper and forest products companies.
S&P 500 Real Estate Index: The S&P 500 Real Estate Index comprises those companies included in the S&P 500 that are classified as members of the GICS® Real Estate sector. The sector includes equity real estate investment trusts (REITs) and real estate management and development companies.
S&P 500 Communication Services Index: The S&P 500 Communication Services Index comprises those companies included in the S&P 500 that are classified as members of the GICS® Communication Services sector. The sector includes telecommunications services, media, entertainment, and interactive media and services companies.
S&P 500 Utilities Index: The S&P 500 Utilities Index comprises those companies included in the S&P 500 that are classified as members of the GICS® Utilities sector. The sector includes electric, gas, water, and multi-utility companies, as well as independent power producers and energy traders.
S&P 500 Equal Weight Index: The equal-weight version of the widely-used S&P 500. The index includes the same constituents as the capitalization weighted S&P 500, but each company in the S&P 500 EWI is allocated a fixed weight - or 0.2% of the index total at each quarterly rebalance.
IMPORTANT INFORMATION
The material herein has been provided to you for informational purposes only by Institutional Capital Network, Inc. ("iCapital Network") or one of its affiliates (iCapital Network together with its affiliates, "iCapital"). This material is the property of iCapital and may not be shared without the written permission of iCapital. No part of this material may be reproduced in any form, or referred to in any other publication, without express written permission of iCapital.
This material is provided for informational purposes only and is not intended as, and may not be relied on in any manner as, legal, tax or investment advice, a recommendation, or as an offer or solicitation to buy or sell any security, financial product or instrument, or otherwise to participate in any particular trading strategy. This material does not intend to address the financial objectives, situation, or specific needs of any individual investor. You should consult your personal accounting, tax and legal advisors to understand the implications of any investment specific to your personal financial situation.
iCapital Markets LLC operates a platform that makes available financial products to financial professionals. In operating this platform, iCapital Markets LLC generally earns revenue based on the volume of transactions that take place in these products and would benefit by an increase in sales for these products.
The information contained herein is an opinion only, as of the date indicated, and should not be relied upon as the only important information available. Any prediction, projection or forecast on the economy, stock market, bond market or the economic trends of the markets is not necessarily indicative of the future or likely performance. The information contained herein is subject to change, incomplete, and may include information and/or data obtained from third party sources that iCapital believes, but does not guarantee, to be accurate. iCapital considers this third-party data reliable, but does not represent that it is accurate, complete and/or up to date. iCapital makes no representation as to the accuracy or completeness of this material and accepts no liability for losses arising from the use of the material presented. No representation or warranty is made by iCapital as to the reasonableness or completeness of such forward-looking statements or to any other financial information contained herein.
Securities products and services are offered by iCapital Markets LLC, an SEC-registered broker-dealer, member FINRA and SIPC, and an affiliate of iCapital, Inc. and Institutional Capital Network, Inc. These registrations and memberships in no way imply that the SEC, FINRA, or SIPC have endorsed any of the entities, products, or services discussed herein. Annuities and insurance services are provided by iCapital Annuities and Insurance Services LLC, an affiliate of iCapital, Inc. "iCapital" and "iCapital Network" are registered trademarks of Institutional Capital Network, Inc. Additional information is available upon request.
© 2026 Institutional Capital Network, Inc. All Rights Reserved.