
Investment Outlook
Direct lending yields have been trending lower because of declining reference rates and intense competition for new loan originations, which is resulting in pricing compression. There are a few reasons behind this. First, when growth in direct lending assets began to scale in the 2015 timeframe, the target market was smaller, mid-market borrowers.1 Today, direct lending funds are larger and more capital needs to be deployed. One result is larger loans made to larger companies which generally see lower pricing. Larger companies are also seeing the benefits of direct lending and a diversification in their funding mix. Second, over the past two years bank lending has shown signs of improvement for both refinancing and new issuance. U.S. leveraged loan activity has averaged about $300 billion per quarter in 2024 through the third quarter of 2025 relative to average activity of $120 billion over the prior three years.2 This sharp recovery has been led by refinancing at tighter spreads, leading to some of the spread compression for new direct loan originations.  The outlook should be put into context: direct lending still offers a premium to comparable credit opportunities even if it’s not as strong as it once was. Over the past year, direct lending has provided about 260 basis points (bps) of excess yield to leveraged loans compared to 400 to 500 over the last ten years (Exhibit 1). While yields will fluctuate, excess relative yields should remain—which is what is happening in the direct lending market.3 Should direct lending managers be able to maintain this excess relative yield, capital flows and investor share shift to the market should remain.
Lastly, direct lending managers have historically been focused on financing private equity buyouts. Buyout activity has been a source of origination for direct lenders, and smaller or closely-held companies that make up a big part of buyout activity haven’t had full access to traditional capital markets. As the buyout deal environment improves, more deals should flow to direct loan originators and could be a catalyst for spread expansion.
Recent Market Trends
The debate over the next few years will likely revolve around inflows and deployment. Capital has poured into direct lending funds—assets of $900 billion amount to double the level seen just five years ago (Exhibit 2). But finding attractive opportunities to put this capital to work is the challenge. As mentioned, buyout and M&A activity, which are often a source of new direct loan originations, have been less than robust over the last few years. And competition from both new direct lending funds and bank lending makes sourcing more difficult. Offsetting some of this impact is that the average size of a direct loan has increased in recent years to $80 million in 2023 from $60 to $65 million over the prior five years.4 This change is likely due to the growth in market cap of underlying companies.
All this amounts to a decent amount of capital available for deployment. Direct lending dry powder increased by 4% YoY in 2024 to $230 billion, or 26% of AUM, suggesting capital is being deployed at a moderate pace (Exhibit 2). But there are signs that lenders are struggling to keep up their investments with the capital inflows. For example, some non-traded BDCs (business development companies), which are common vehicles for direct lending allocations, have been unable to deploy their targeted amount of fund leverage.
 As the deployment topic progresses, credit quality and market expansion are two other forces at work. Manager selection is always important but more so if lenders try to achieve return consistency by compromising on the quality of new originations. To this point, yield compression is perhaps a signal that the market is functioning correctly in that direct lenders are not chasing low quality, higher yielding originations.
More broadly, the market is eying opportunities beyond direct lending. As a measure of scale, private direct loans now account for 62% of all commercial and industrial loans, up from 25% in 2014.5 Managers who conclude the traditional middle-market sponsor-backed opportunities are limited are starting to expand to asset-based lending, infrastructure debt, private credit secondaries and other areas. We expect this market expansion theme to continue over the next several years.
Industry Focus: Software
The software industry accounts for about 20% of outstanding loans for private direct lenders.6 Software is also the largest sector in the leveraged finance market, double the size of the next largest industry (Exhibit 3). Leveraged loan issuance as a whole is concentrated with three sectors accounting for about 45% of all loans (Exhibit 3).
 Software is an attractive sector for lenders (and buyout sponsors) due to the high margin, high cash flow-yield nature of a software business model. The industry is also higher growth and generally has recurring revenue contracts to a diversified customer base. In other words, while direct lending has high concentration in the software industry, software itself is embedded in many other end-industries.
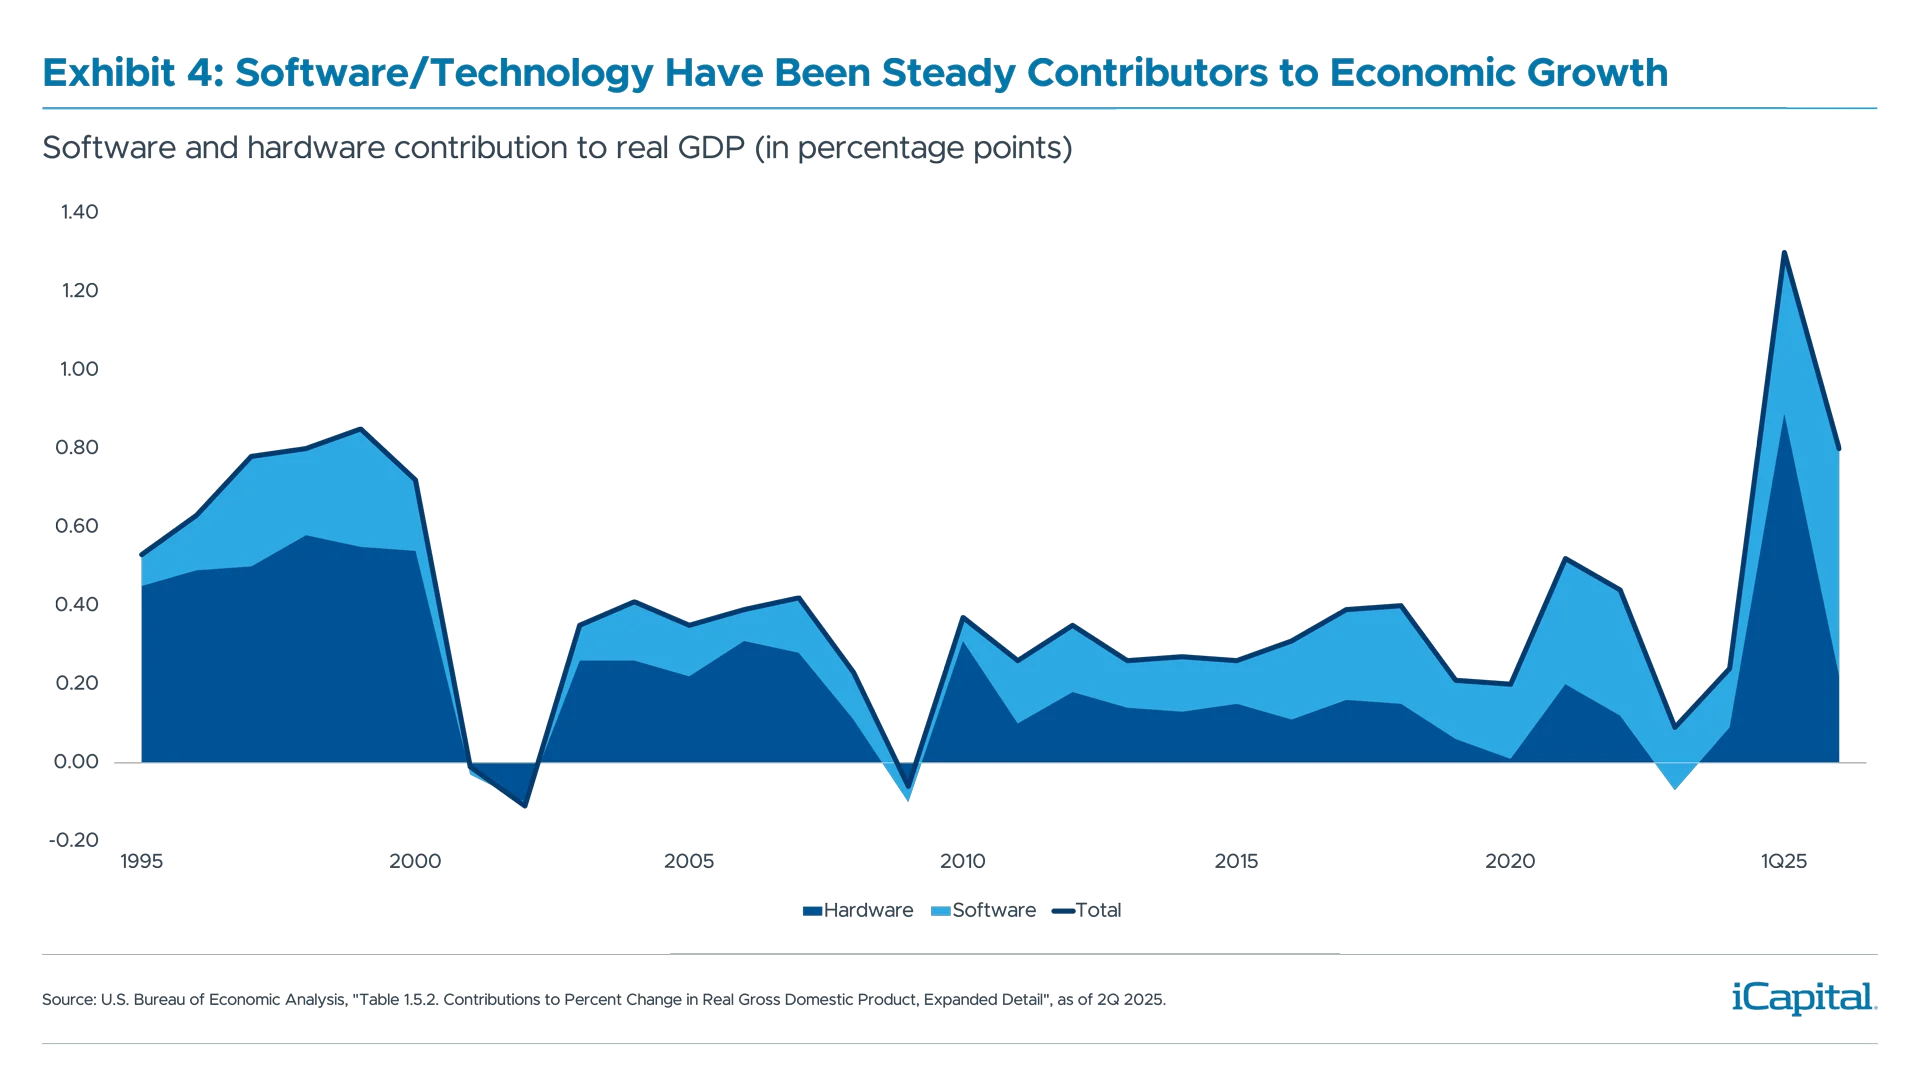
It’s also worth noting the relatively steady contribution that software (tech in general) has made to the broader economy. Over the last thirty years, technology (software and hardware) has contributed about one-third of a point to annual GDP in the U.S (Exhibit 4). For private equity sponsors and lenders alike, this amounts to a steady growth industry with high cash flow yield which is comforting in the context of credit quality.
 Performance Snapshot

Direct lending, proxied by the Cliffwater Direct Lending Index, returned 4.5% through the first half of 2025 with some softening seen.7 Overall, we expect some moderation of new issue yield and payouts which could weigh on performance compared to the asset class’s longer term historic performance.
Relative to other fixed income alternatives, quality direct lending managers should be able to generate excess yield relative to public fixed income due to an illiquidity premium and originations to smaller companies. This should position the asset class as a compelling complement to a portfolio.

INDEX DEFINITIONS
Bloomberg U.S. Corporate High Yield Index: Measures the U.S. Dollar-denominated, high yield, fixed-rate corporate bond market. Securities are classified as high yield if the middle rating of Moody's, Fitch and S&P is Ba1/BB+/BB+ or below.
Cliffwater Direct Lending Index (CDLI): An asset-weighted index of over 11,000 directly originated middle market loans totaling $264B. It seeks to measure the unlevered, gross of fee performance of U.S. middle market corporate loans, as represented by the asset-weighted performance of the underlying assets of Business Development Companies (BDCs), including both exchange-traded and unlisted BDCs, subject to certain eligibility requirements.
Cliffwater Public BDC Index (CWBDC): Measures the performance of lending-oriented, exchange-traded Business Development Companies, subject to certain eligibility criteria regarding portfolio composition, market capitalization, and dividend history. The CWBDC is a capitalization-weighted index that is calculated on a daily basis using publicly available closing share prices and reported dividend payouts. The CWBDC Total Return Index includes two components: 1) Income Return and 2) Price Return.
Morningstar LSTA U.S. Leveraged Loan Index: An Index designed to deliver comprehensive, precise coverage of the US leveraged loan market. Underpinned by PitchBook and LCD data, the index serves as the market standard for the US leveraged loan asset class and tracks the performance of more than 1,400 USD denominated loans.
Secured Overnight Financing Rate (SOFR) Three-Month: The SOFR is a broad measure of the cost of borrowing cash overnight collateralized by Treasury securities. SOFR futures offer the leading source of price discovery and liquidity on SOFR. Three-Month SOFR futures are cash settled and based on a business-day compounded SOFR per annum during contract Reference Quarter.
END NOTES
- Preqin and iCapital Alternatives Decoded, Private credit total assets under management, August 2025.
- PitchBook, Credit Markets Quarterly Wrap, October 1, 2025.
- Yields refer to direct lending yields based on the Cliffwater Direct Lending Index, relative yields refer to direct lending yield relative to leveraged loan yield based on the Morningstar LSTA U.S. Leveraged Loan 100 Index.
- PitchBook, Board of Governors of the Federal Reserve System. Private Credit: Characteristics and Risks. February 23, 2024.
- Preqin and iCapital Alternatives Decoded for direct lending Assets Under Management data as of August 2025, Board of Governors of the Federal Reserve System (US) retrieved from FRED for Commercial and Industrial Loan data with data through December 2024.
- Based on loan exposure for the 10 largest non-traded BDCs, data from SEC filings and company reports, as of June 2025.
- Cliffwater Direct Lending Index, with data based on availability as of August 2025.
IMPORTANT INFORMATION
The material herein has been provided to you for informational purposes only by Institutional Capital Network, Inc. (“iCapital Network”) or one of its affiliates (iCapital Network together with its affiliates, “iCapital”). This material is the property of iCapital and may not be shared without the written permission of iCapital. No part of this material may be reproduced in any form, or referred to in any other publication, without express written permission of iCapital.
This material is provided for informational purposes only and is not intended as, and may not be relied on in any manner as, legal, tax or investment advice, a recommendation, or as an offer or solicitation to buy or sell any security, financial product or instrument, or otherwise to participate in any particular trading strategy. This material does not intend to address the financial objectives, situation, or specific needs of any individual investor. You should consult your personal accounting, tax and legal advisors to understand the implications of any investment specific to your personal financial situation.
ALTERNATIVE INVESTMENTS ARE CONSIDERED COMPLEX PRODUCTS AND MAY NOT BE SUITABLE FOR ALL INVESTORS. Prospective investors should be aware that an investment in an alternative investment is speculative and involves a high degree of risk. Alternative Investments often engage in leveraging and other speculative investment practices that may increase the risk of investment loss; can be highly illiquid; may not be required to provide periodic pricing or valuation information to investors; may involve complex tax structures and delays in distributing important tax information; are not subject to the same regulatory requirements as mutual funds; and often charge high fees. There is no guarantee that an alternative investment will implement its investment strategy and/or achieve its objectives, generate profits, or avoid loss. An investment should only be considered by sophisticated investors who can afford to lose all or a substantial amount of their investment
iCapital Markets LLC operates a platform that makes available financial products to financial professionals. In operating this platform, iCapital Markets LLC generally earns revenue based on the volume of transactions that take place in these products and would benefit by an increase in sales for these products.
The information contained herein is an opinion only, as of the date indicated, and should not be relied upon as the only important information available. Any prediction, projection or forecast on the economy, stock market, bond market or the economic trends of the markets is not necessarily indicative of the future or likely performance. The information contained herein is subject to change, incomplete, and may include information and/or data obtained from third party sources that iCapital believes, but does not guarantee, to be accurate. iCapital considers this third-party data reliable, but does not represent that it is accurate, complete and/or up to date. iCapital makes no representation as to the accuracy or completeness of this material and accepts no liability for losses arising from the use of the material presented. No representation or warranty is made by iCapital as to the reasonableness or completeness of such forward-looking statements or to any other financial information contained herein.
Securities products and services are offered by iCapital Markets LLC, an SEC-registered broker-dealer, member FINRA and SIPC, and an affiliate of iCapital, Inc. and Institutional Capital Network, Inc. These registrations and memberships in no way imply that the SEC, FINRA, or SIPC have endorsed any of the entities, products, or services discussed herein. Annuities and insurance services are provided by iCapital Annuities and Insurance Services LLC, an affiliate of iCapital, Inc. “iCapital” and “iCapital Network” are registered trademarks of Institutional Capital Network, Inc. Additional information is available upon request.
©2025 Institutional Capital Network, Inc. All Rights Reserved.