Alternatives Decoded – Q2-2025
Discover the pulse of the alternatives investment landscape with iCapital’s Alternatives Decoded. This dynamic and chart-driven narrative offers a timely deep-dive into private market data, key market trends, and leading indicators that influence and shape the direction and investment outlook of alternative assets. Alts Decoded delivers essential and comprehensive insights, empowering you to stay well informed and ahead in a rapidly evolving alternatives landscape.
-
Introduction keyboard_arrow_down
-
Flow-of-Funds keyboard_arrow_down
-
Overview keyboard_arrow_down
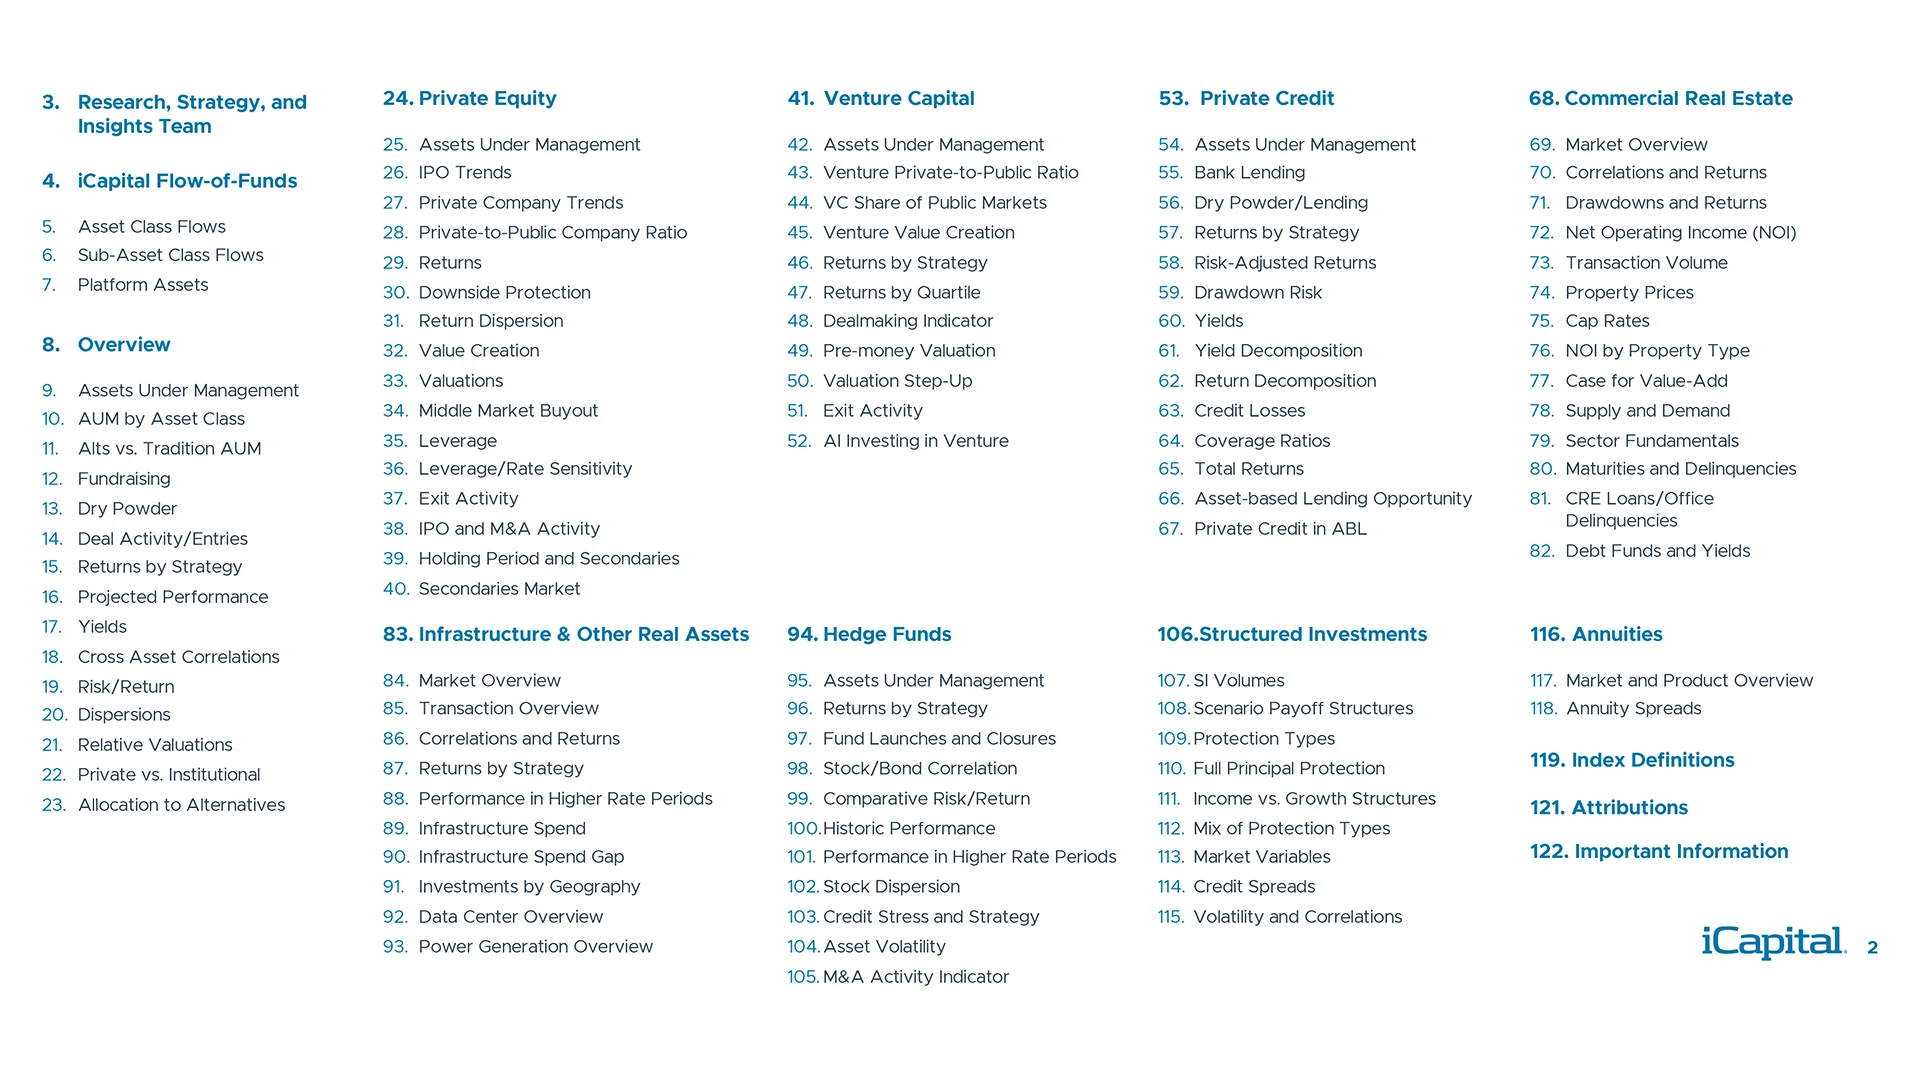
- Overview 08
- Assets Under Management 09
- AUM by Asset Class 10
- Alts vs. Tradition AUM 11
- Fundraising 12
- Dry Powder 13
- Deal Activity/Entries 14
- Returns by Strategy 15
- Projected Performance 16
- Yields 17
- Cross Asset Correlations 18
- Risk/Return 19
- Dispersions 20
- Relative Valuations 21
- Private vs. Institutional 22
- Allocation to Alternatives 23
-
Private Equity keyboard_arrow_down
- Private Equity 24
- Assets Under Management 25
- IPO Trends 26
- Private Company Trends 27
- Private-to-Public Company Ratio 28
- Returns 29
- Downside Protection 30
- Return Dispersion 31
- Value Creation 32
- Valuations 33
- Middle Market Buyout 34
- Leverage 35
- Leverage/Rate Sensitivity 36
- Exit Activity 37
- IPO and M&A Activity 38
- Holding Period and Secondaries 39
- Secondaries Market 40
-
Venture Capital keyboard_arrow_down
-
Private Credit keyboard_arrow_down
- Private Credit 53
- Assets Under Management 54
- Bank Lending 55
- Dry Powder/Lending 56
- Returns by Strategy 57
- Risk-Adjusted Returns 58
- Drawdown Risk 59
- Yields 60
- Yield Decomposition 61
- Return Decomposition 62
- Credit Losses 63
- Coverage Ratios 64
- Total Returns 65
- Asset-based Lending Opportunity 66
- Private Credit in ABL 67
-
Commercial Real Estate keyboard_arrow_down
- Commercial Real Estate 68
- Market Overview 69
- Correlations and Returns 70
- Drawdowns and Returns 71
- Net Operating Income (NOI) 72
- Transaction Volume 73
- Property Prices 74
- Cap Rates 75
- NOI by Property Type 76
- Case for Value-Add 77
- Supply and Demand 78
- Sector Fundamentals 79
- Maturities and Delinquencies 80
- CRE Loans/Office Delinquencies 81
- Debt Funds and Yields 82
-
Infrastructure & Other Real Assets keyboard_arrow_down
- Infrastructure & Other Real Assets 83
- Market Overview 84
- Transaction Overview 85
- Correlations and Returns 86
- Returns by Strategy 87
- Performance in Higher Rate Periods 88
- Infrastructure Spend 89
- Infrastructure Spend Gap 90
- Investments by Geography 91
- Data Center Overview 92
- Power Generation Overview 93
-
Hedge Funds keyboard_arrow_down
- Hedge Funds 94
- Assets Under Management 95
- Returns by Strategy 96
- Fund Launches and Closures 97
- Stock/Bond Correlation 98
- Comparative Risk/Return 99
- Historic Performance 100
- Performance in Higher Rate Periods 101
- Stock Dispersion 102
- Credit Stress and Strategy 103
- Asset Volatility 104
- M&A Activity Indicator 105
-
Structured Investments keyboard_arrow_down
-
Annuities keyboard_arrow_down
- Annuities 116
- Market and Product Overview 117
- Annuity Spreads 118
-
Index Definitions keyboard_arrow_down
-
Attributions keyboard_arrow_down
- Attributions 121
-
Important Information keyboard_arrow_down

Page Index
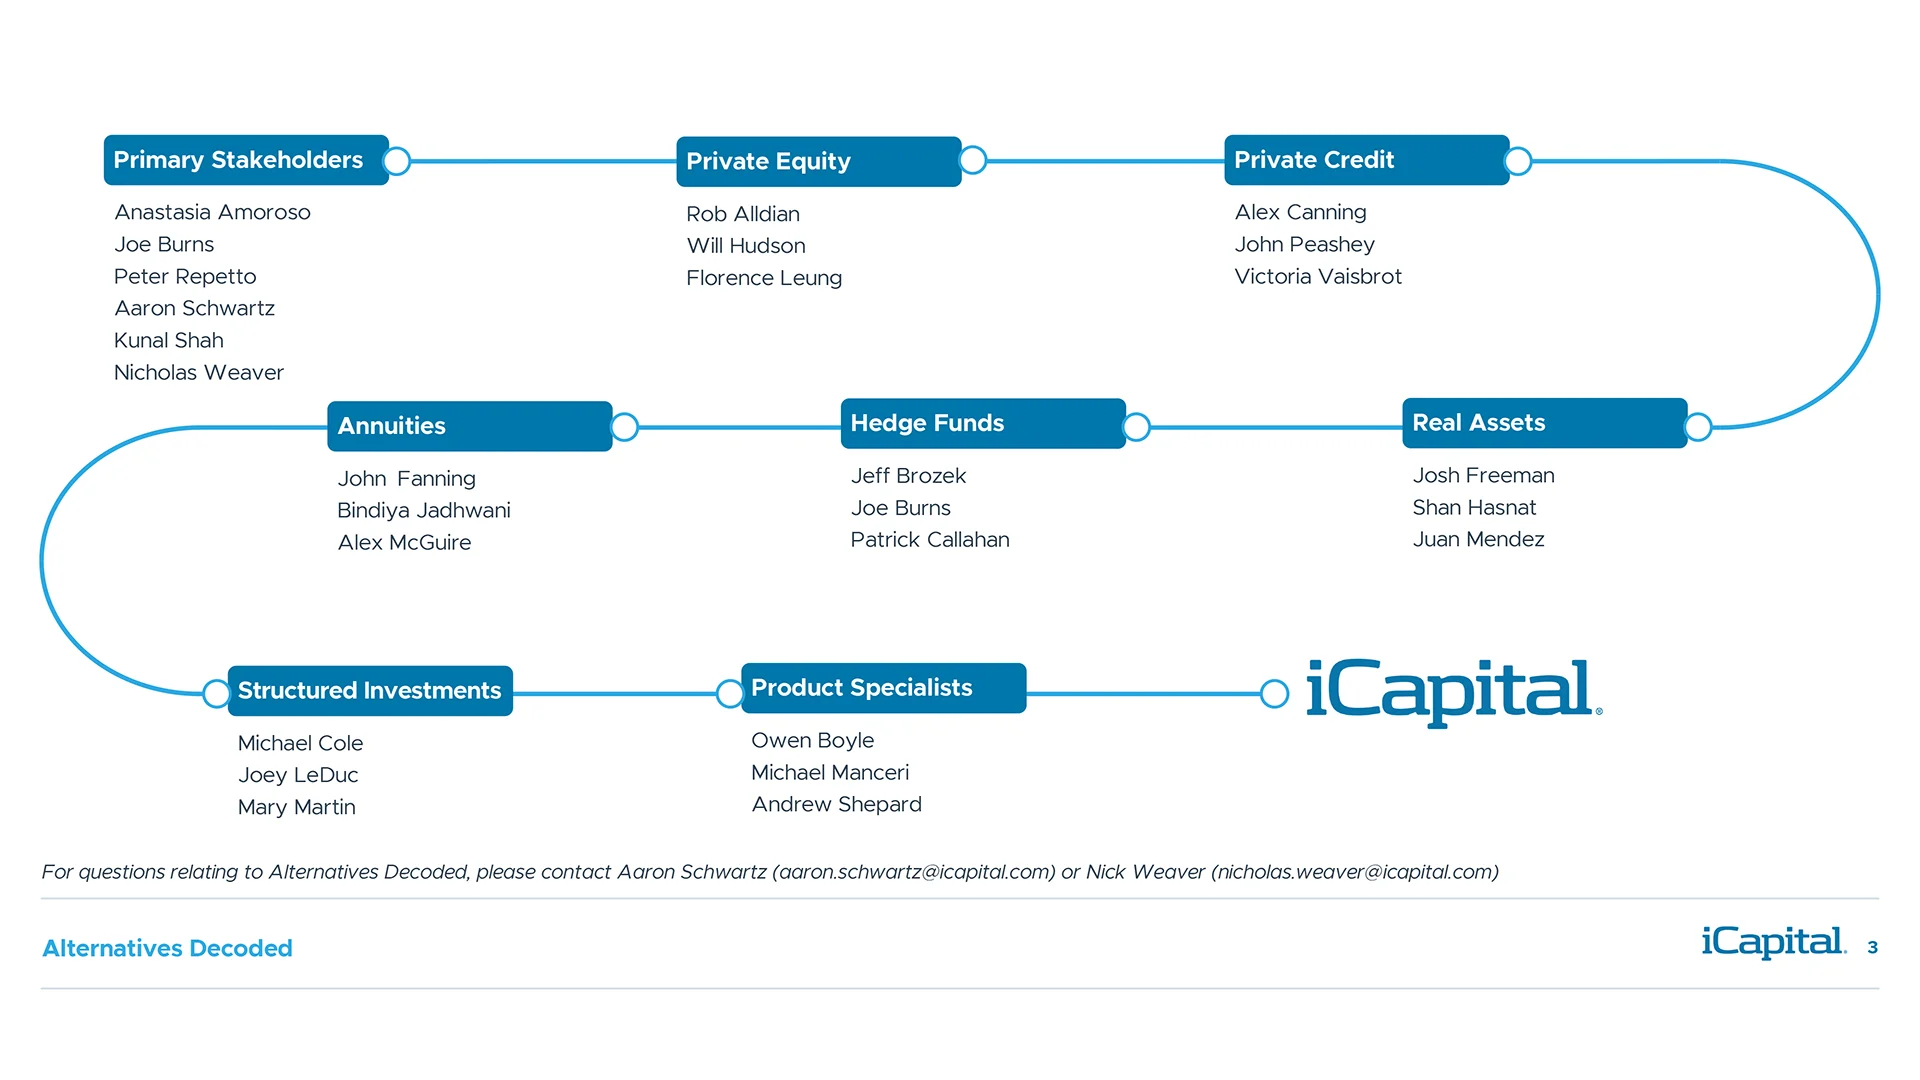
Global Research, Strategy, and Insights Team
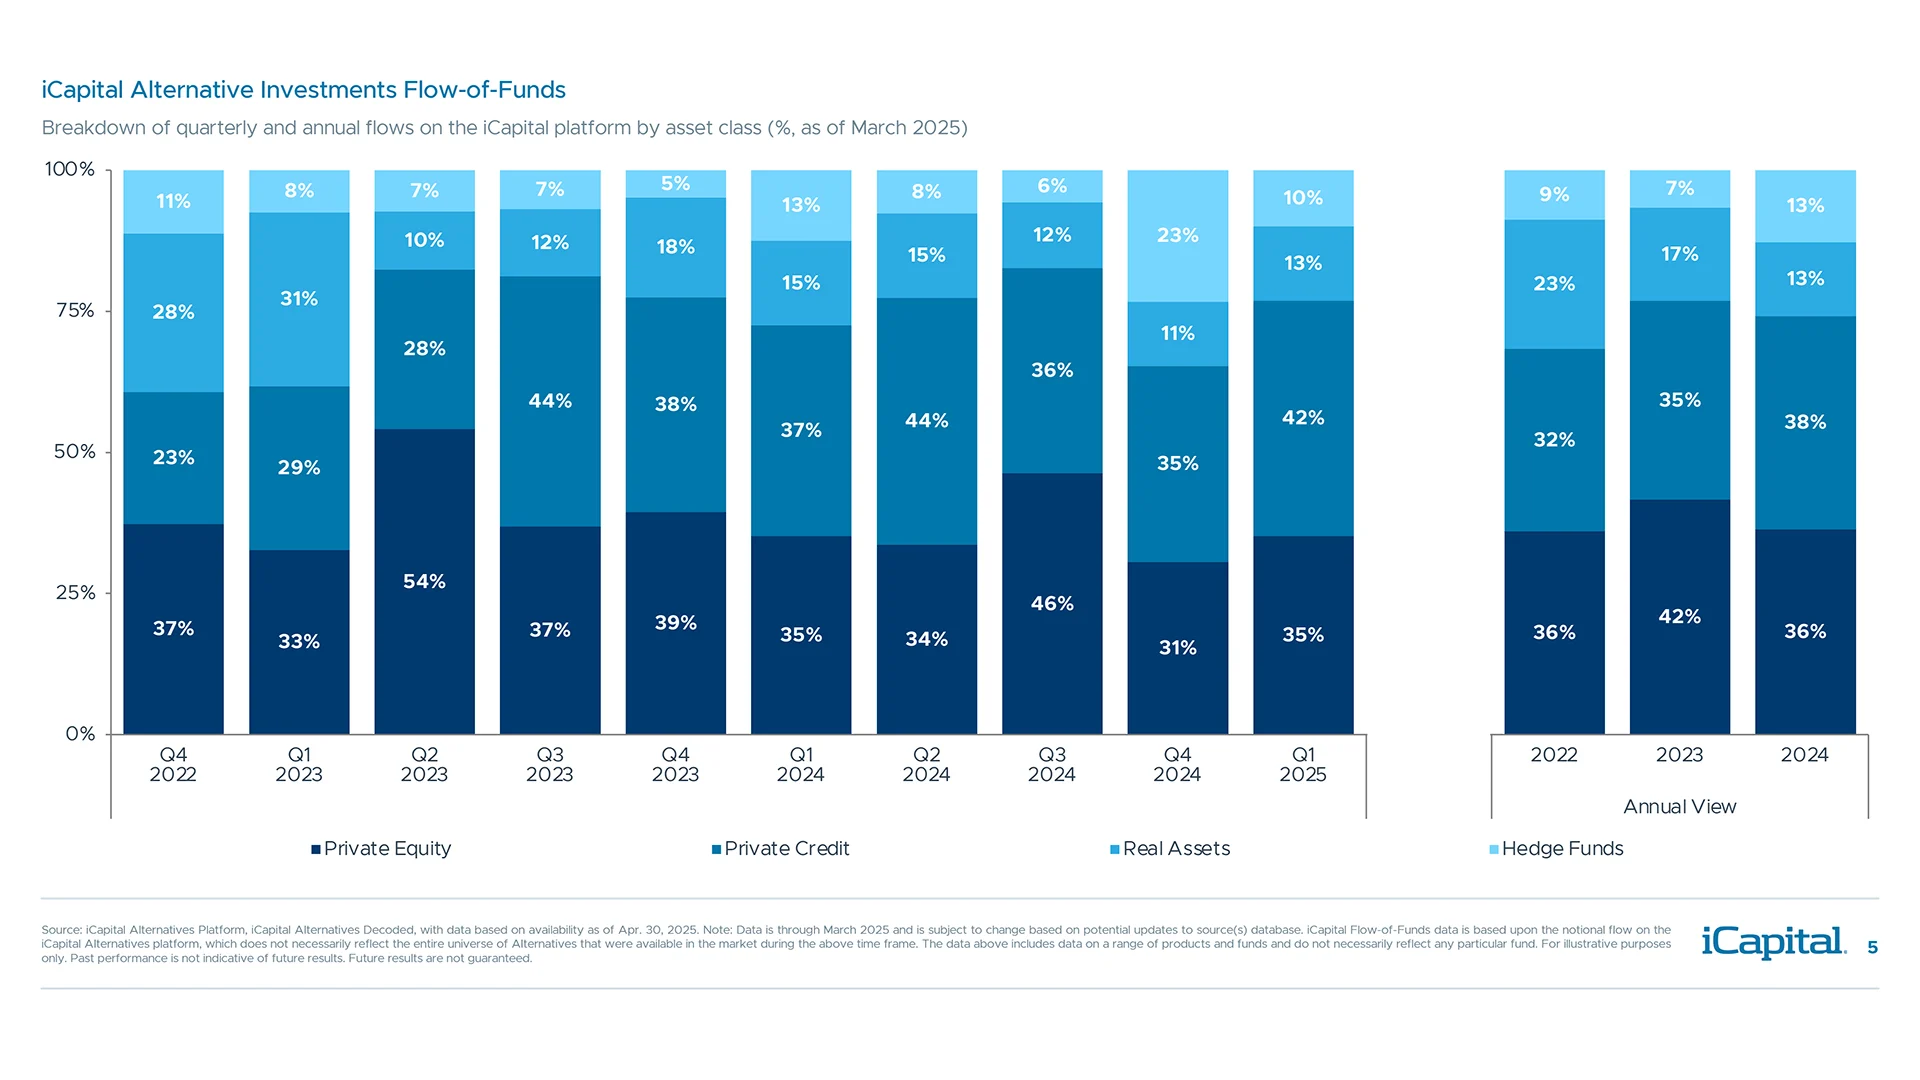
iCapital Flow-of-Funds

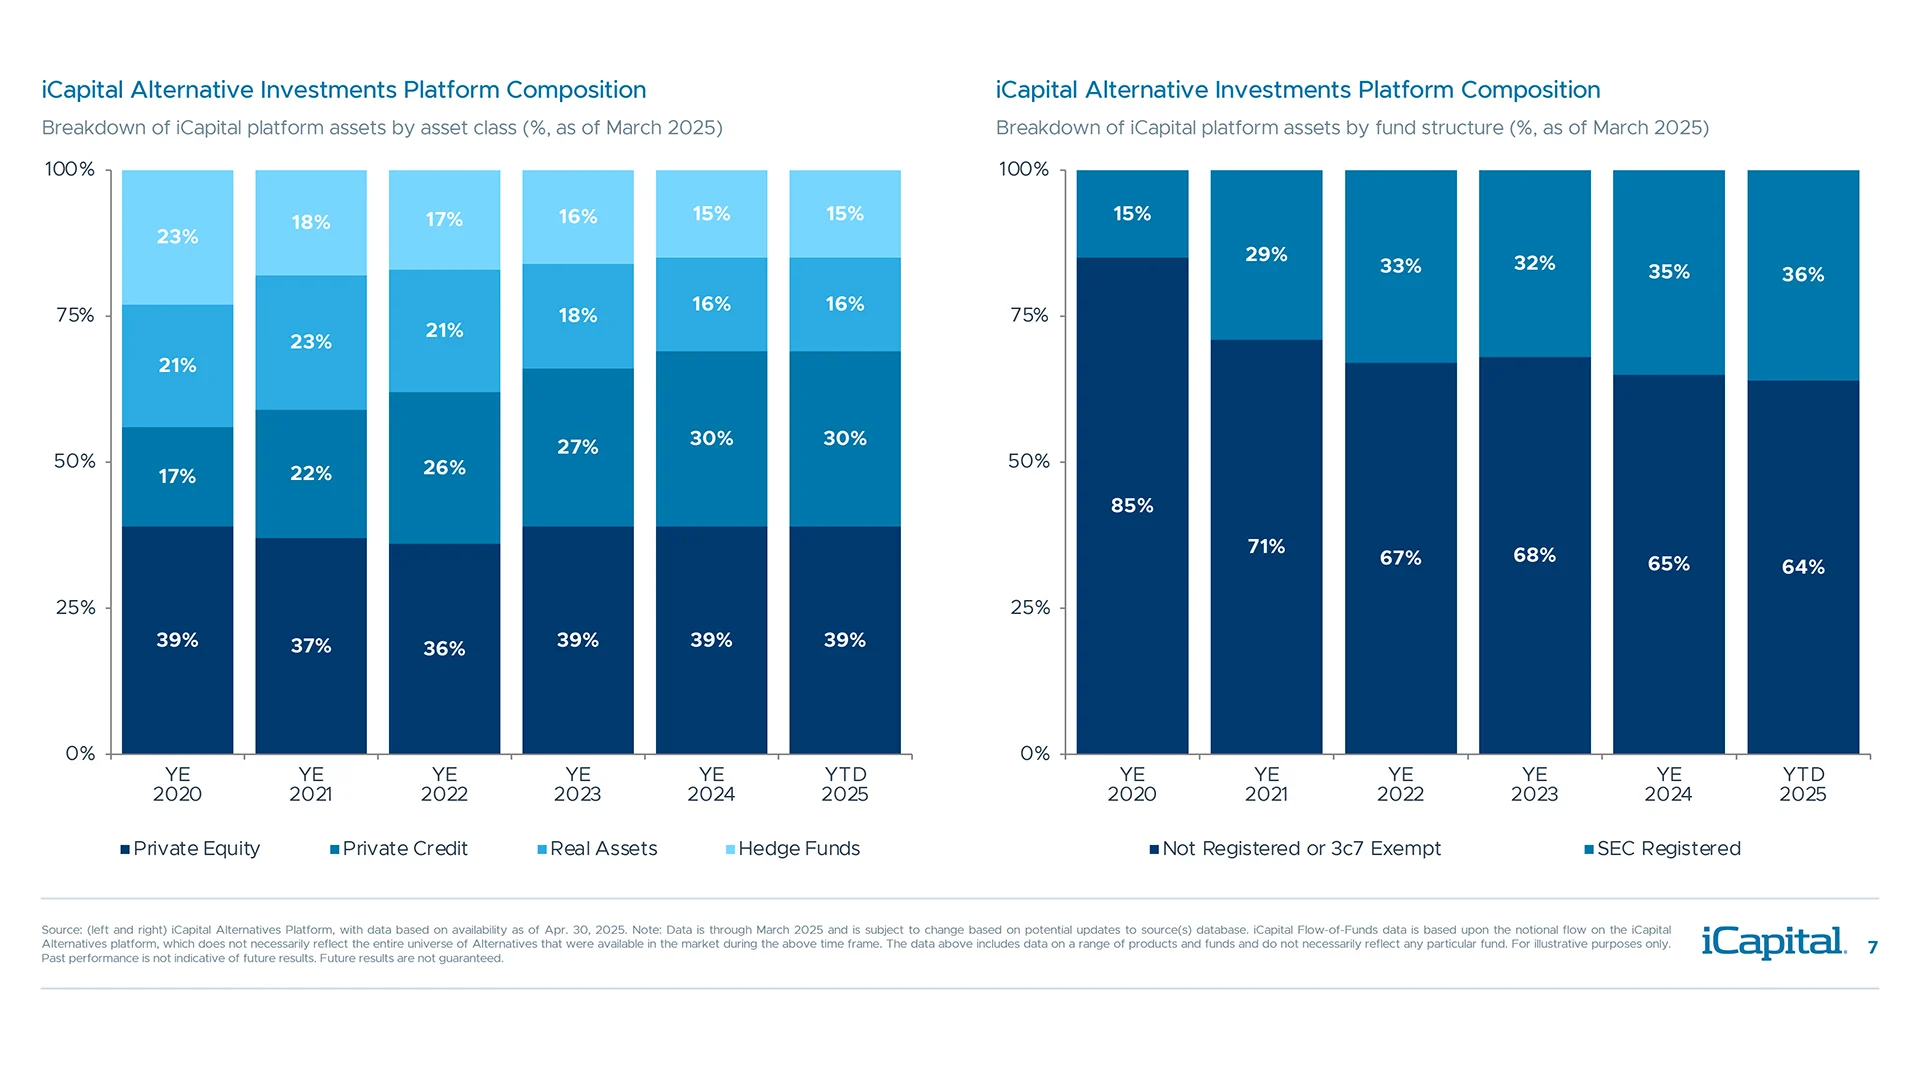
Private wealth clients favored private equity and private credit in the first quarter of 2025
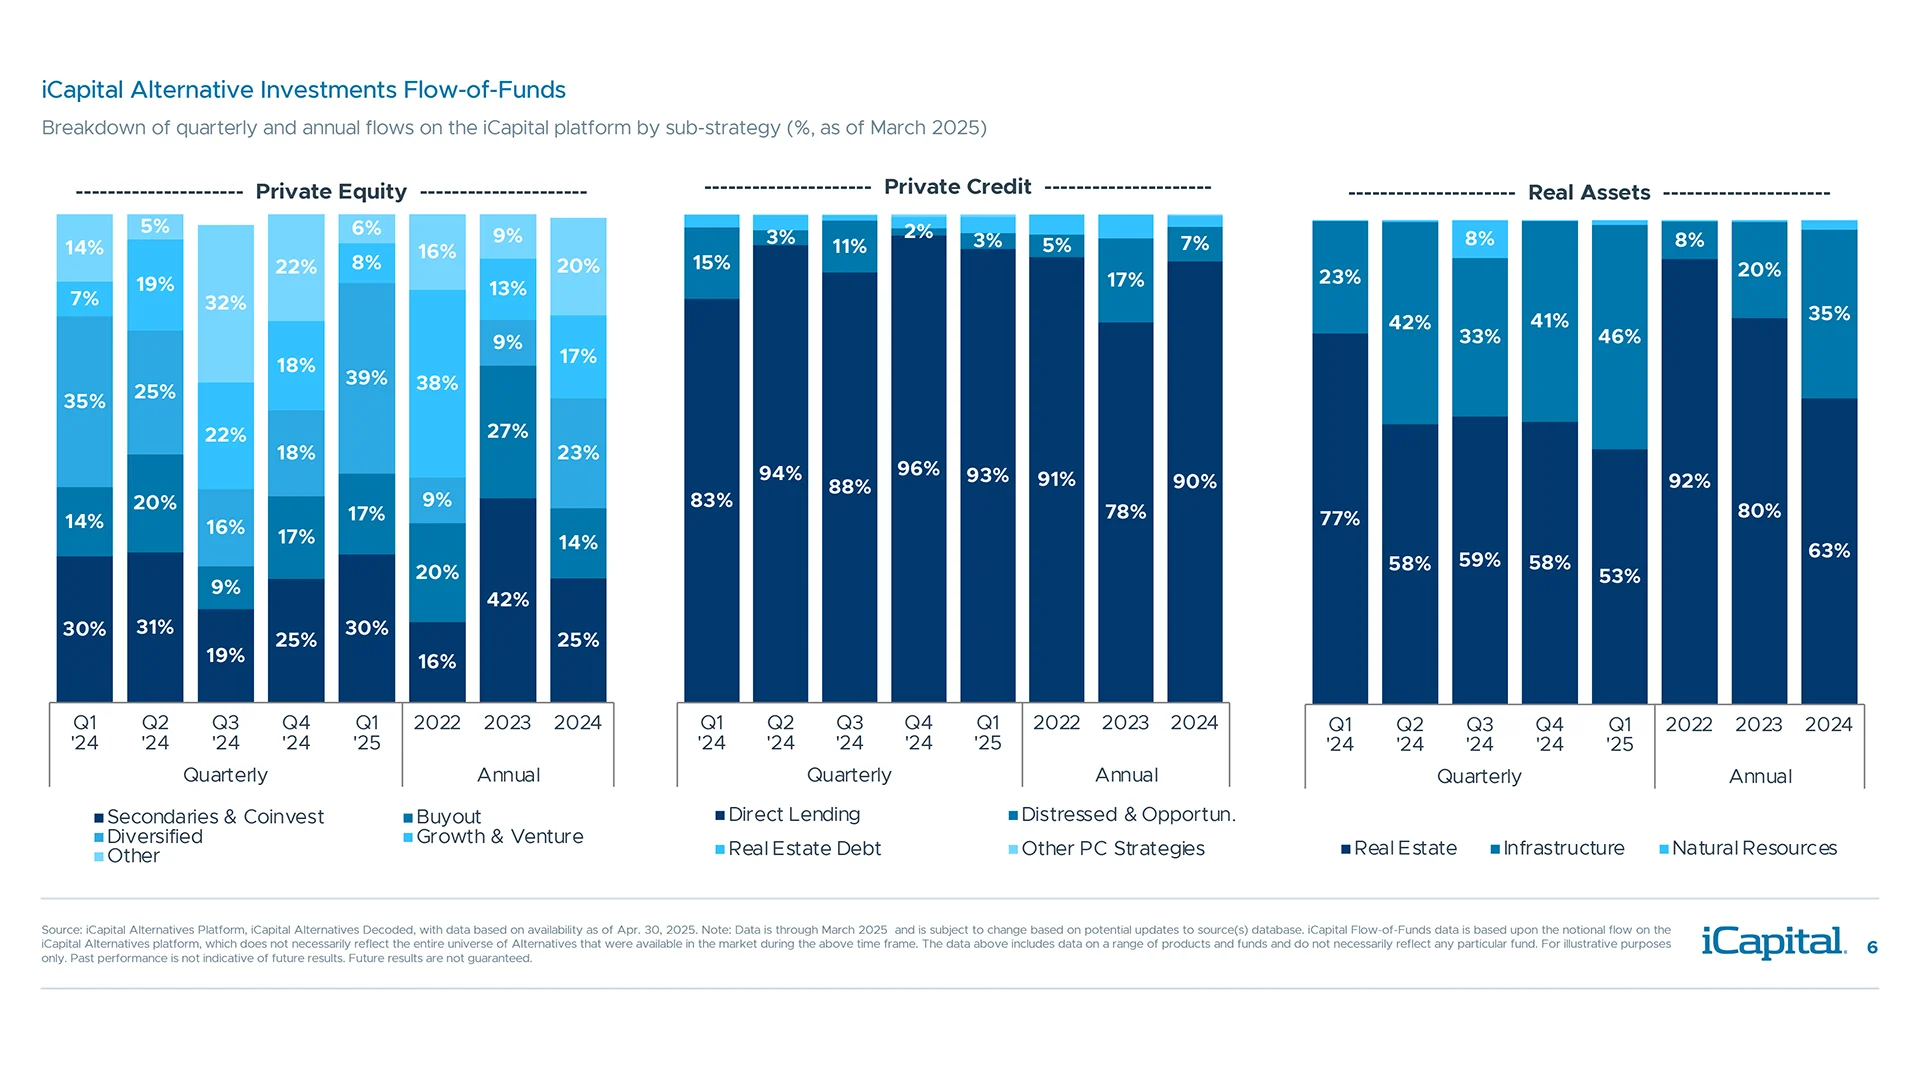
Private wealth clients are increasing allocations to direct lending and infrastructure strategies
In the last five years, private wealth clients boosted allocations to private credit, registered funds
Overview

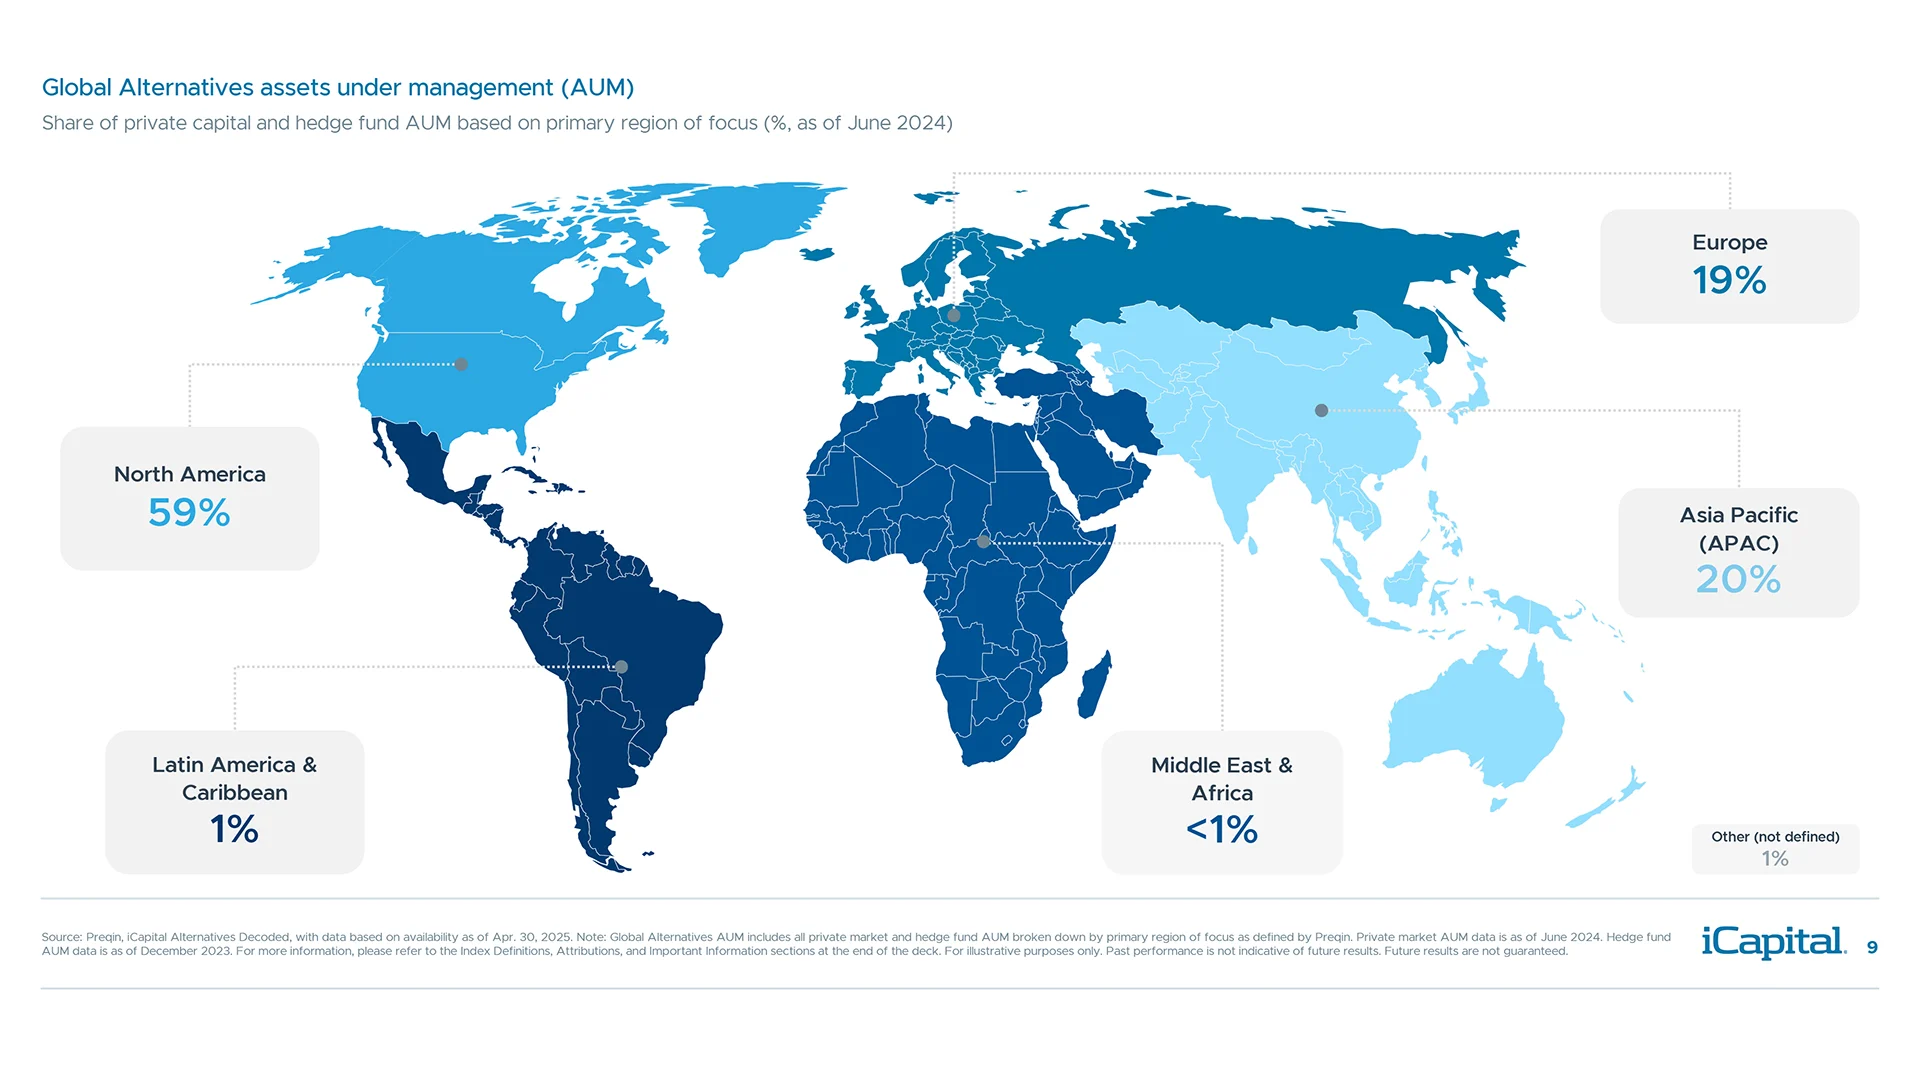
Alternatives hold $17.2 trillion in assets under management globally across strategies
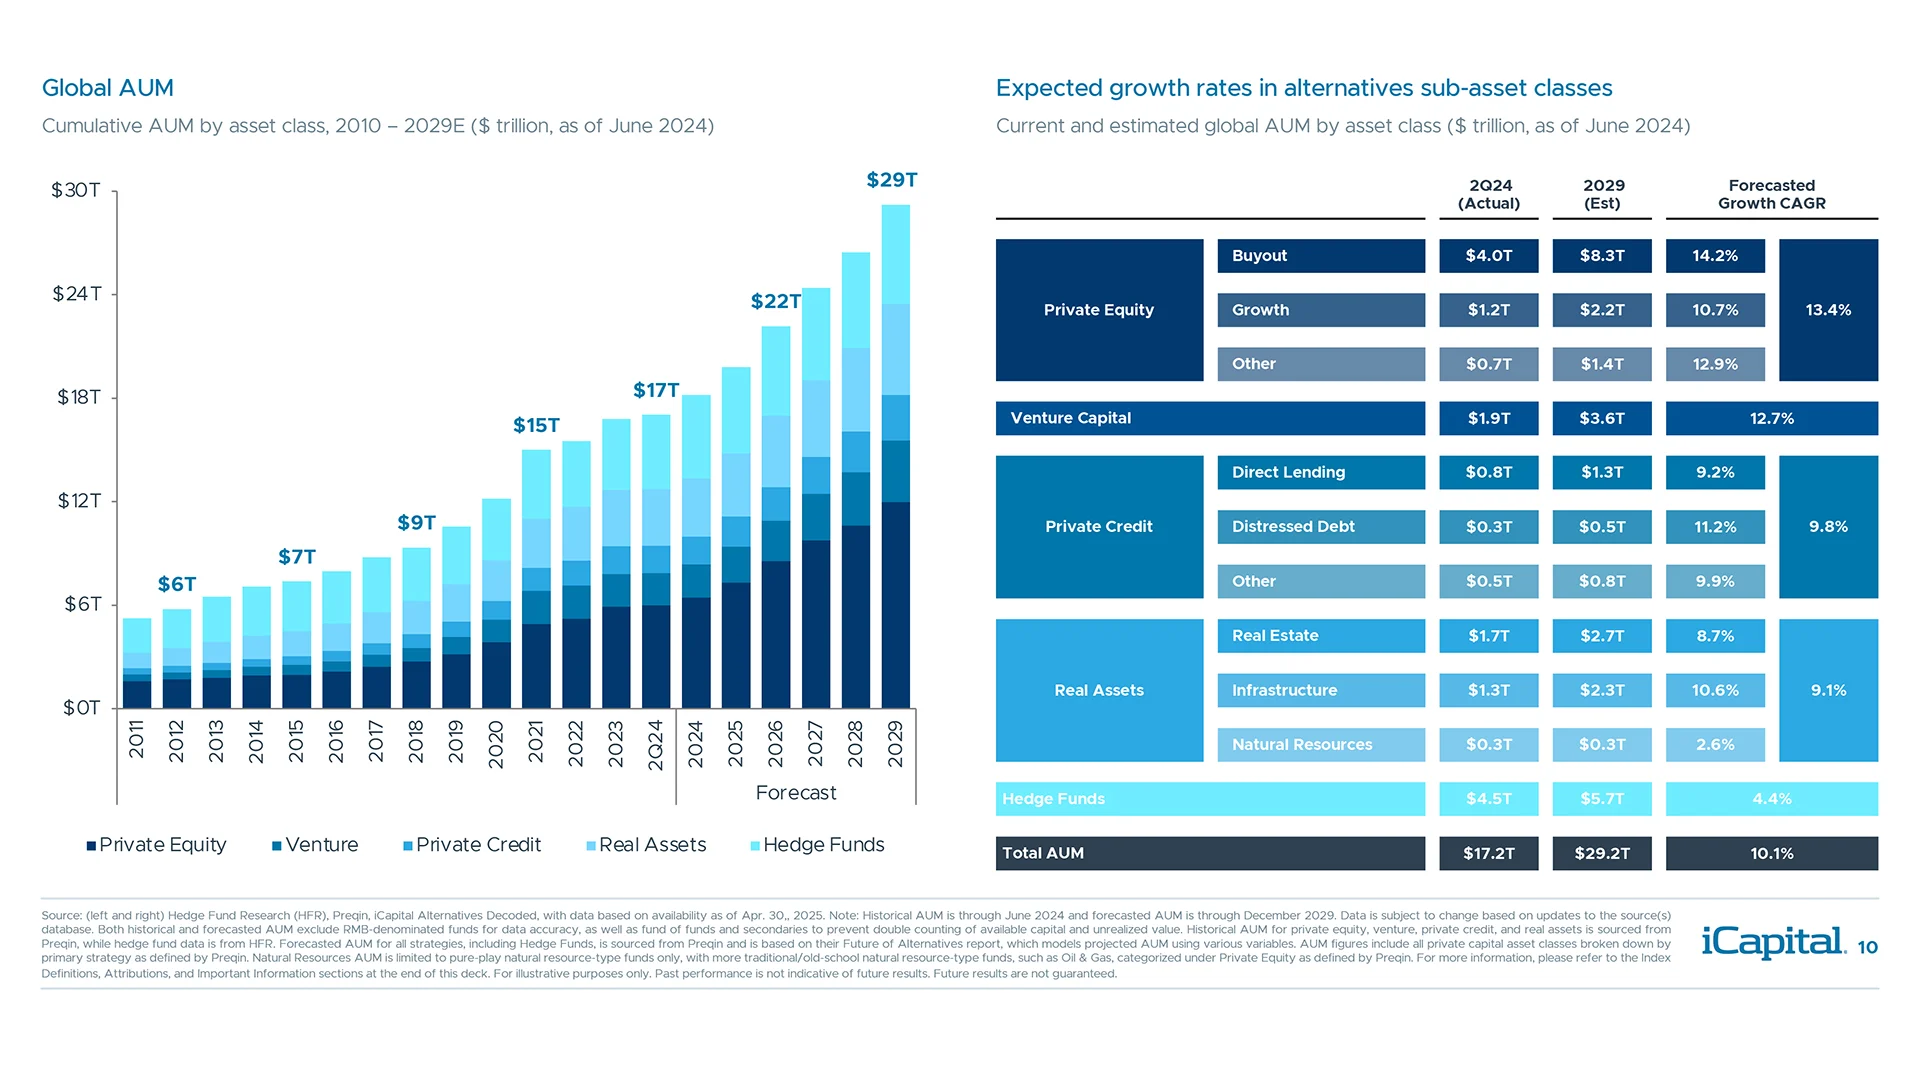
Alternatives have grown significantly and are projected to grow further in years ahead
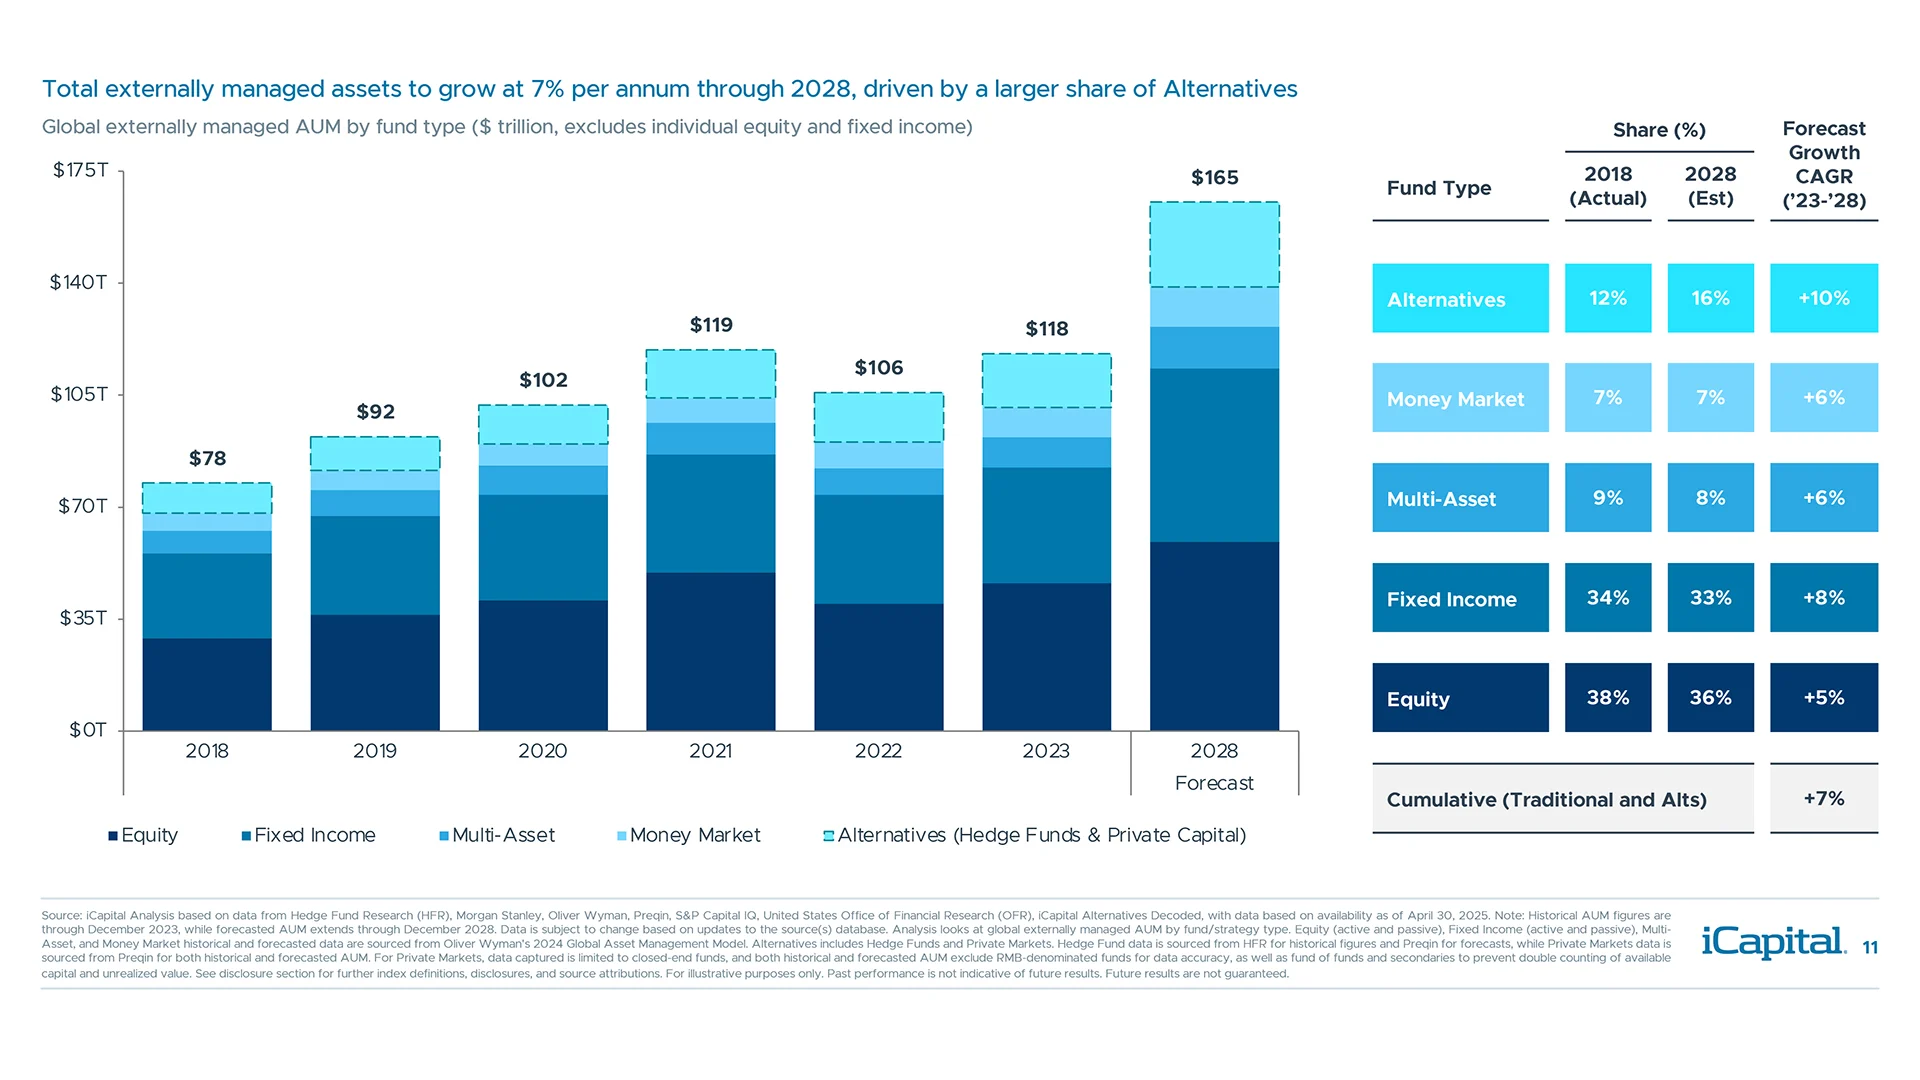
Alternatives are expected to have the strongest growth rate compared to traditional markets
Alternatives fundraising activity has been challenged amidst an uncertain macro backdrop
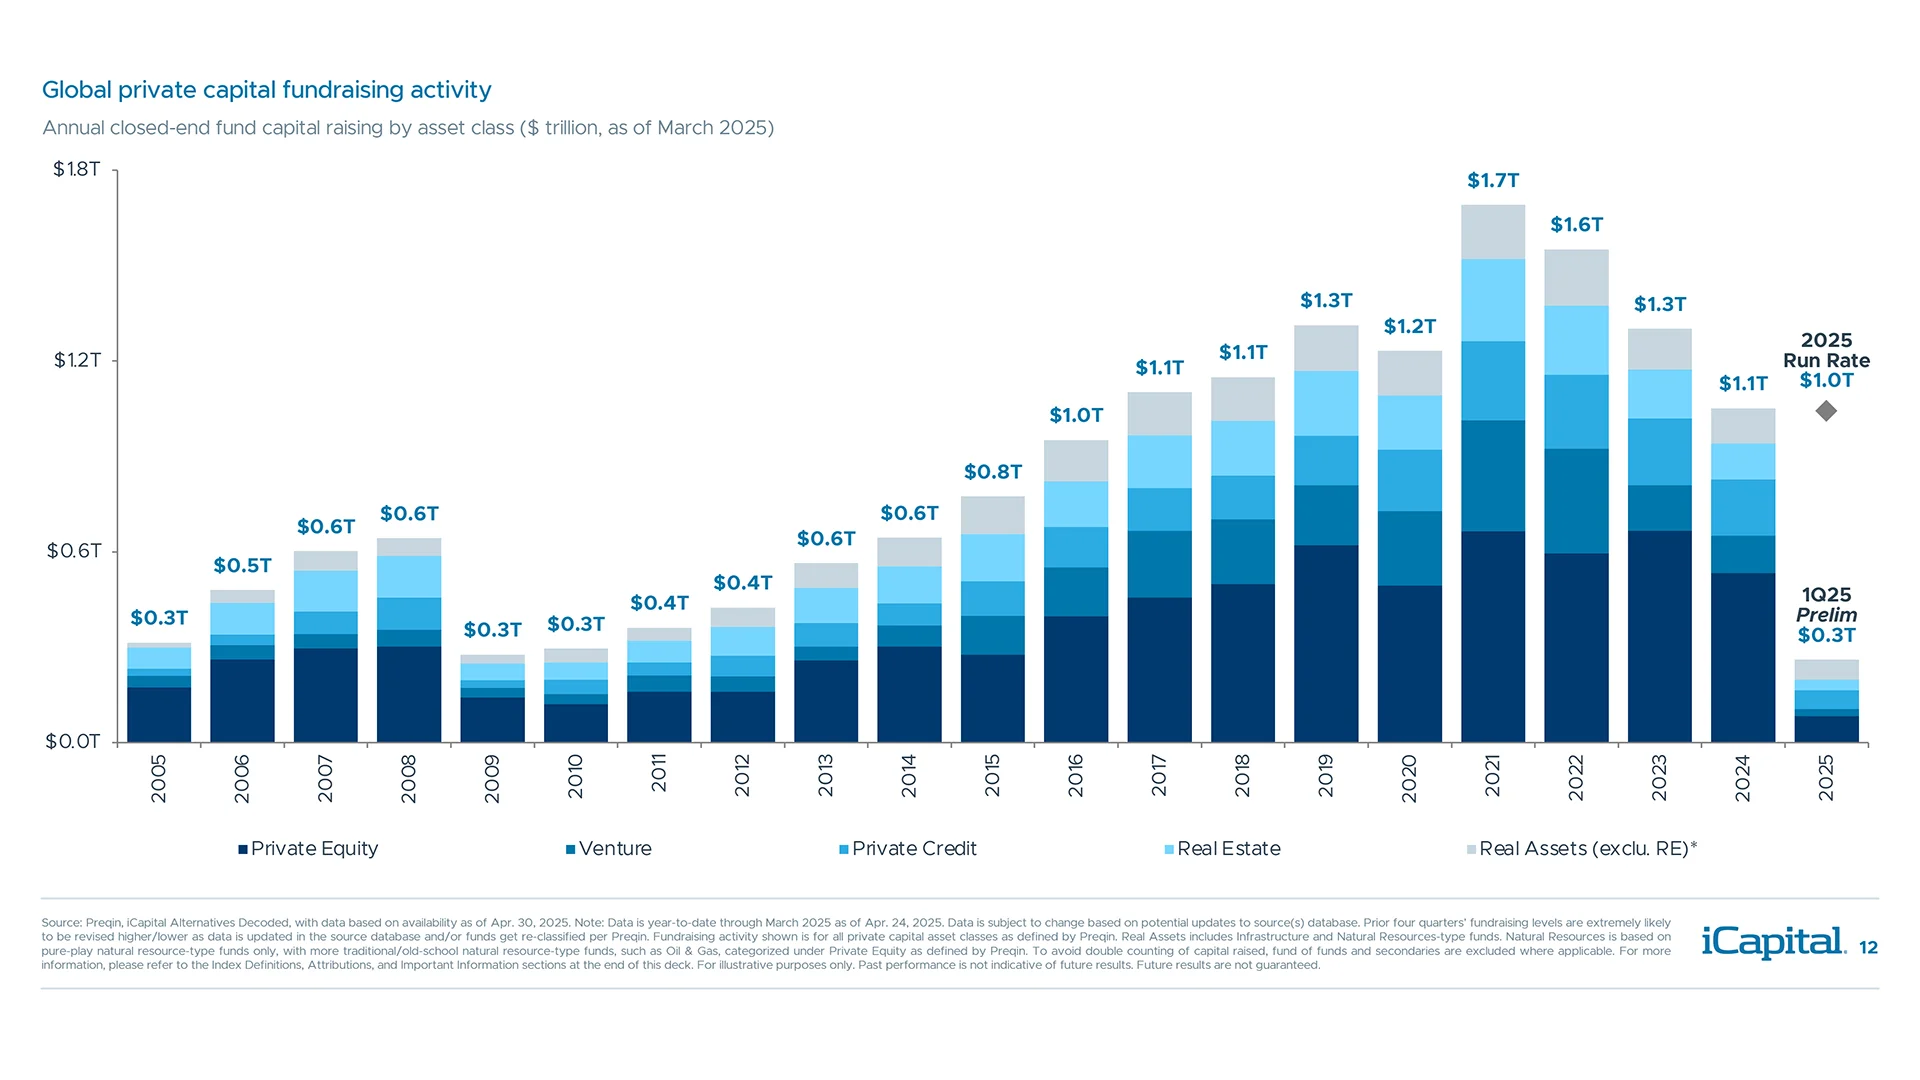
Dry powder has declined to $3.9 trillion as committed capital begins to get deployed globally

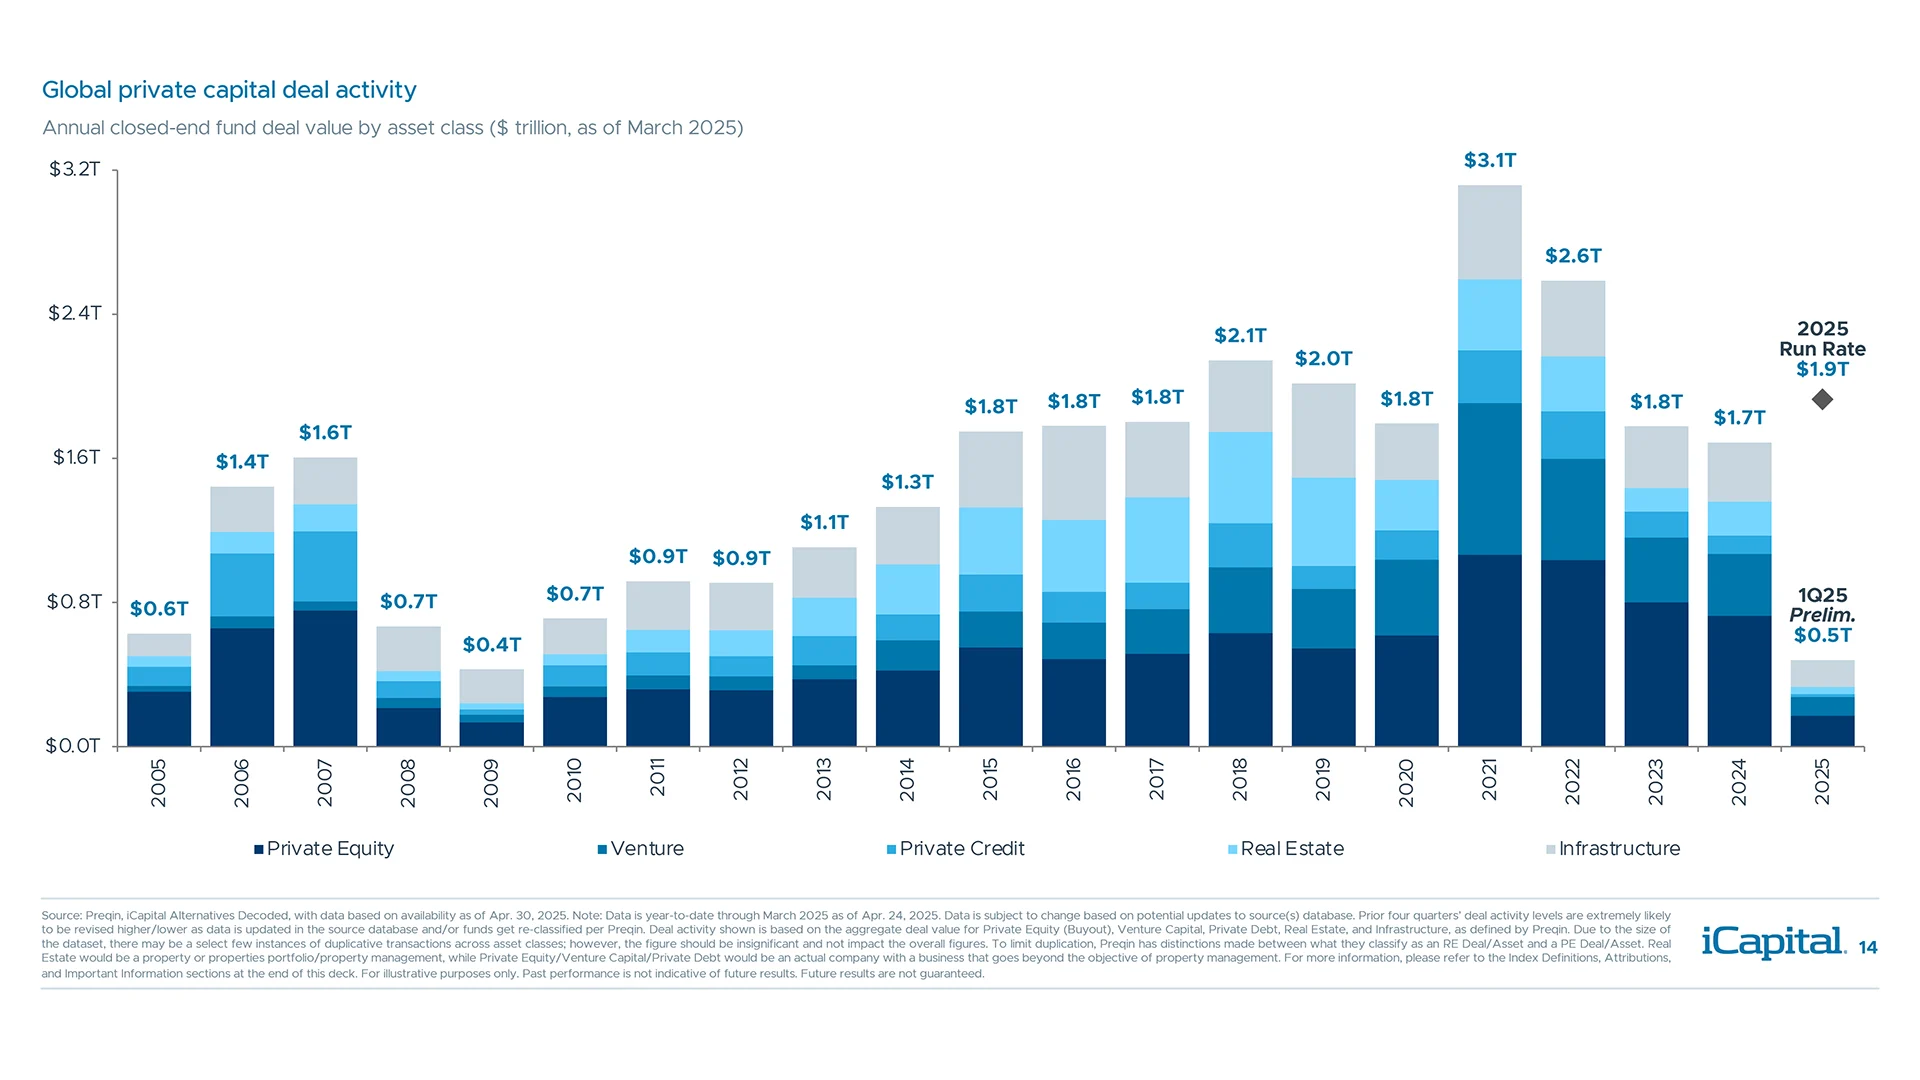
Deals continue to get done, but at a much slower pace than expected at the start of the year
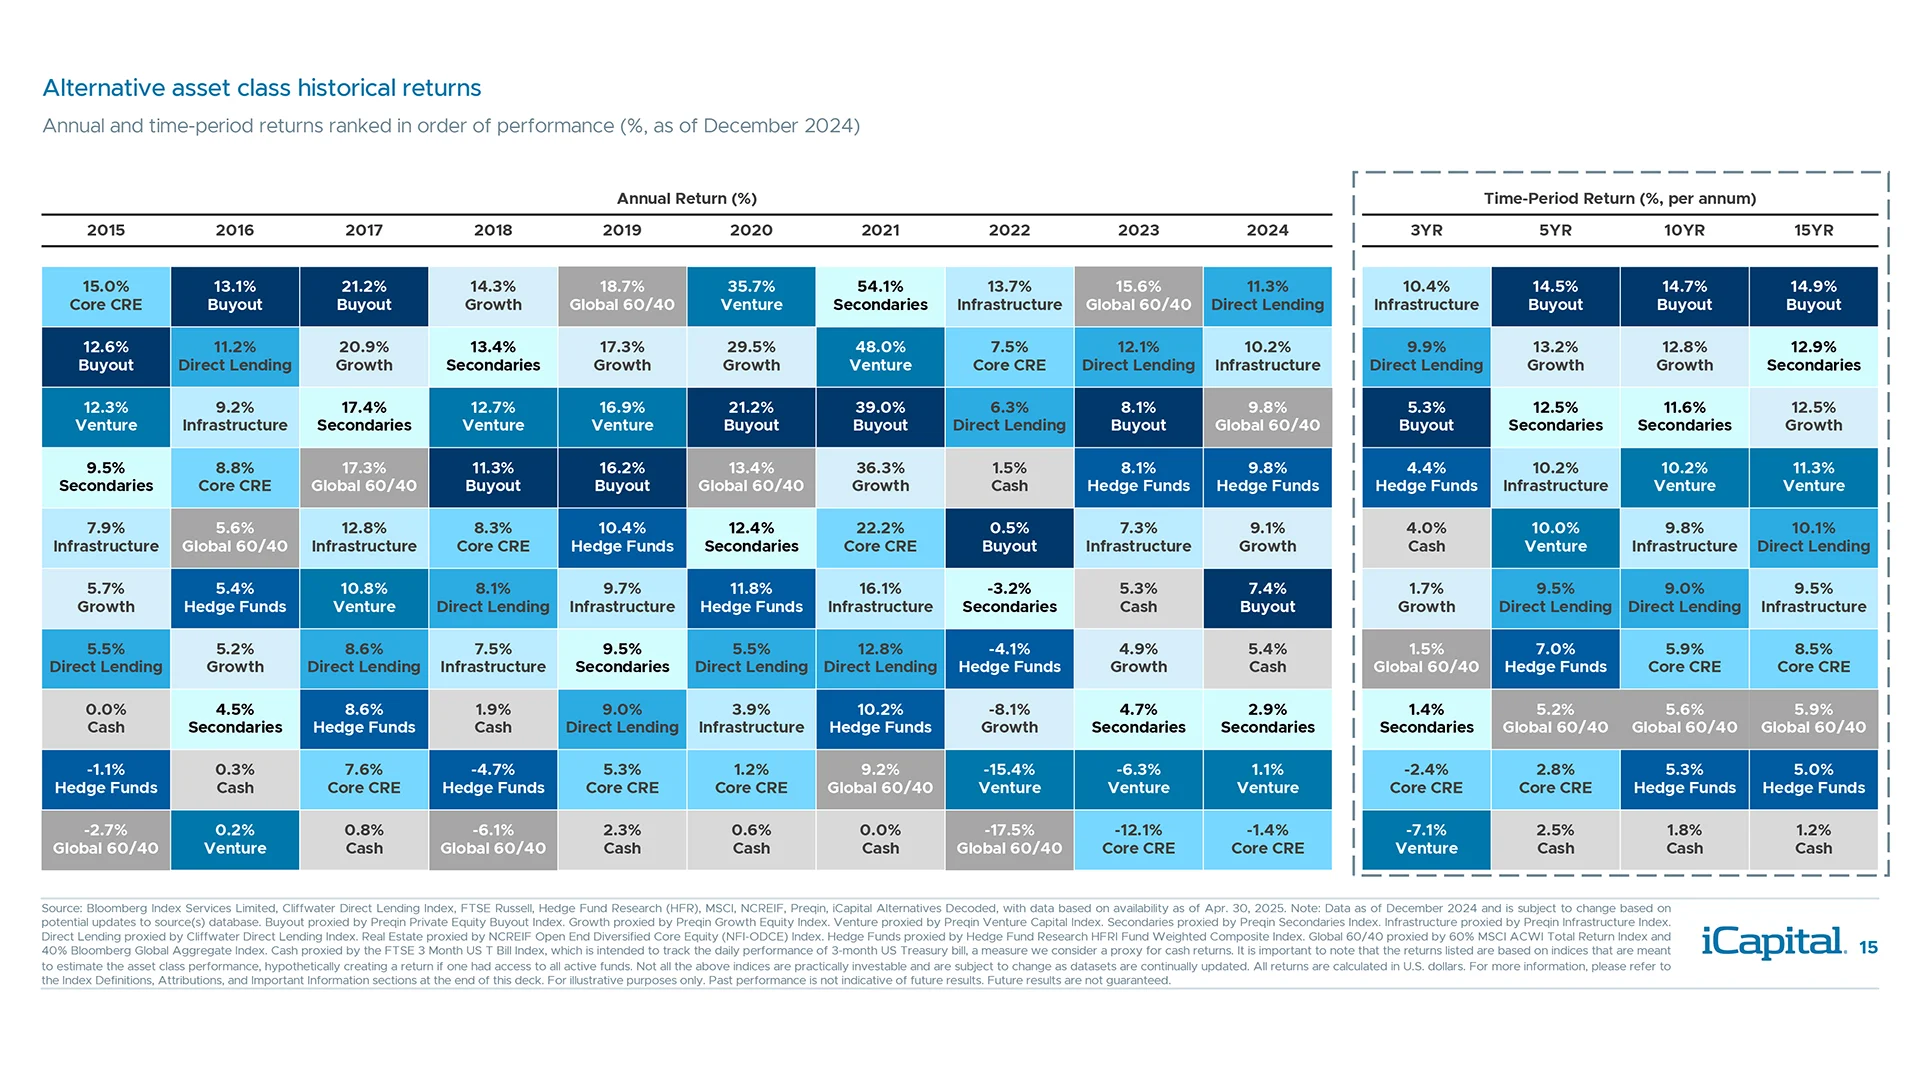
Alternatives have offered strong outperformance vs. a traditional 60/40 portfolio
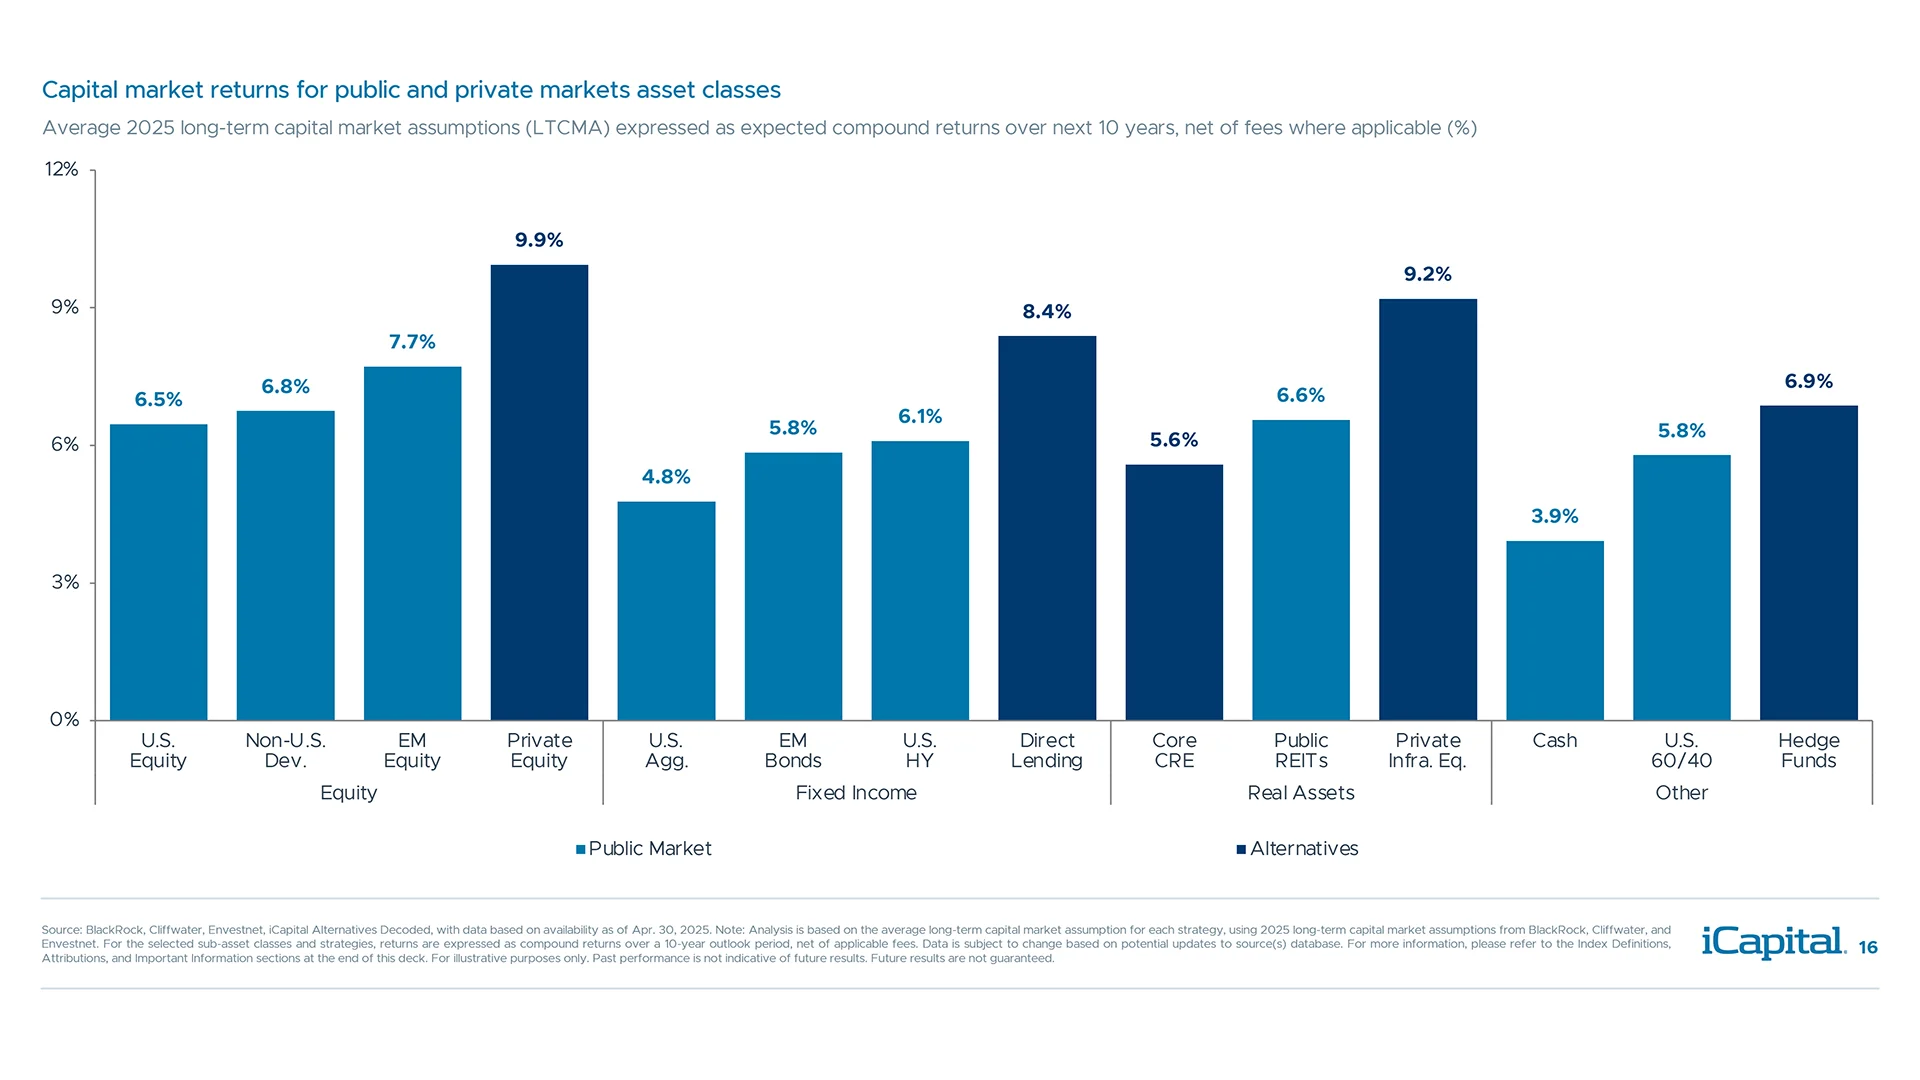
Over the next decade, alternatives are projected to outperform their public counterparts
Several private market strategies offer higher yields than those available in public markets

Alternatives can be a powerful diversifier due to their low correlation to public markets

Alternatives offer higher returns and lower volatility vs. a traditional 60/40 portfolio

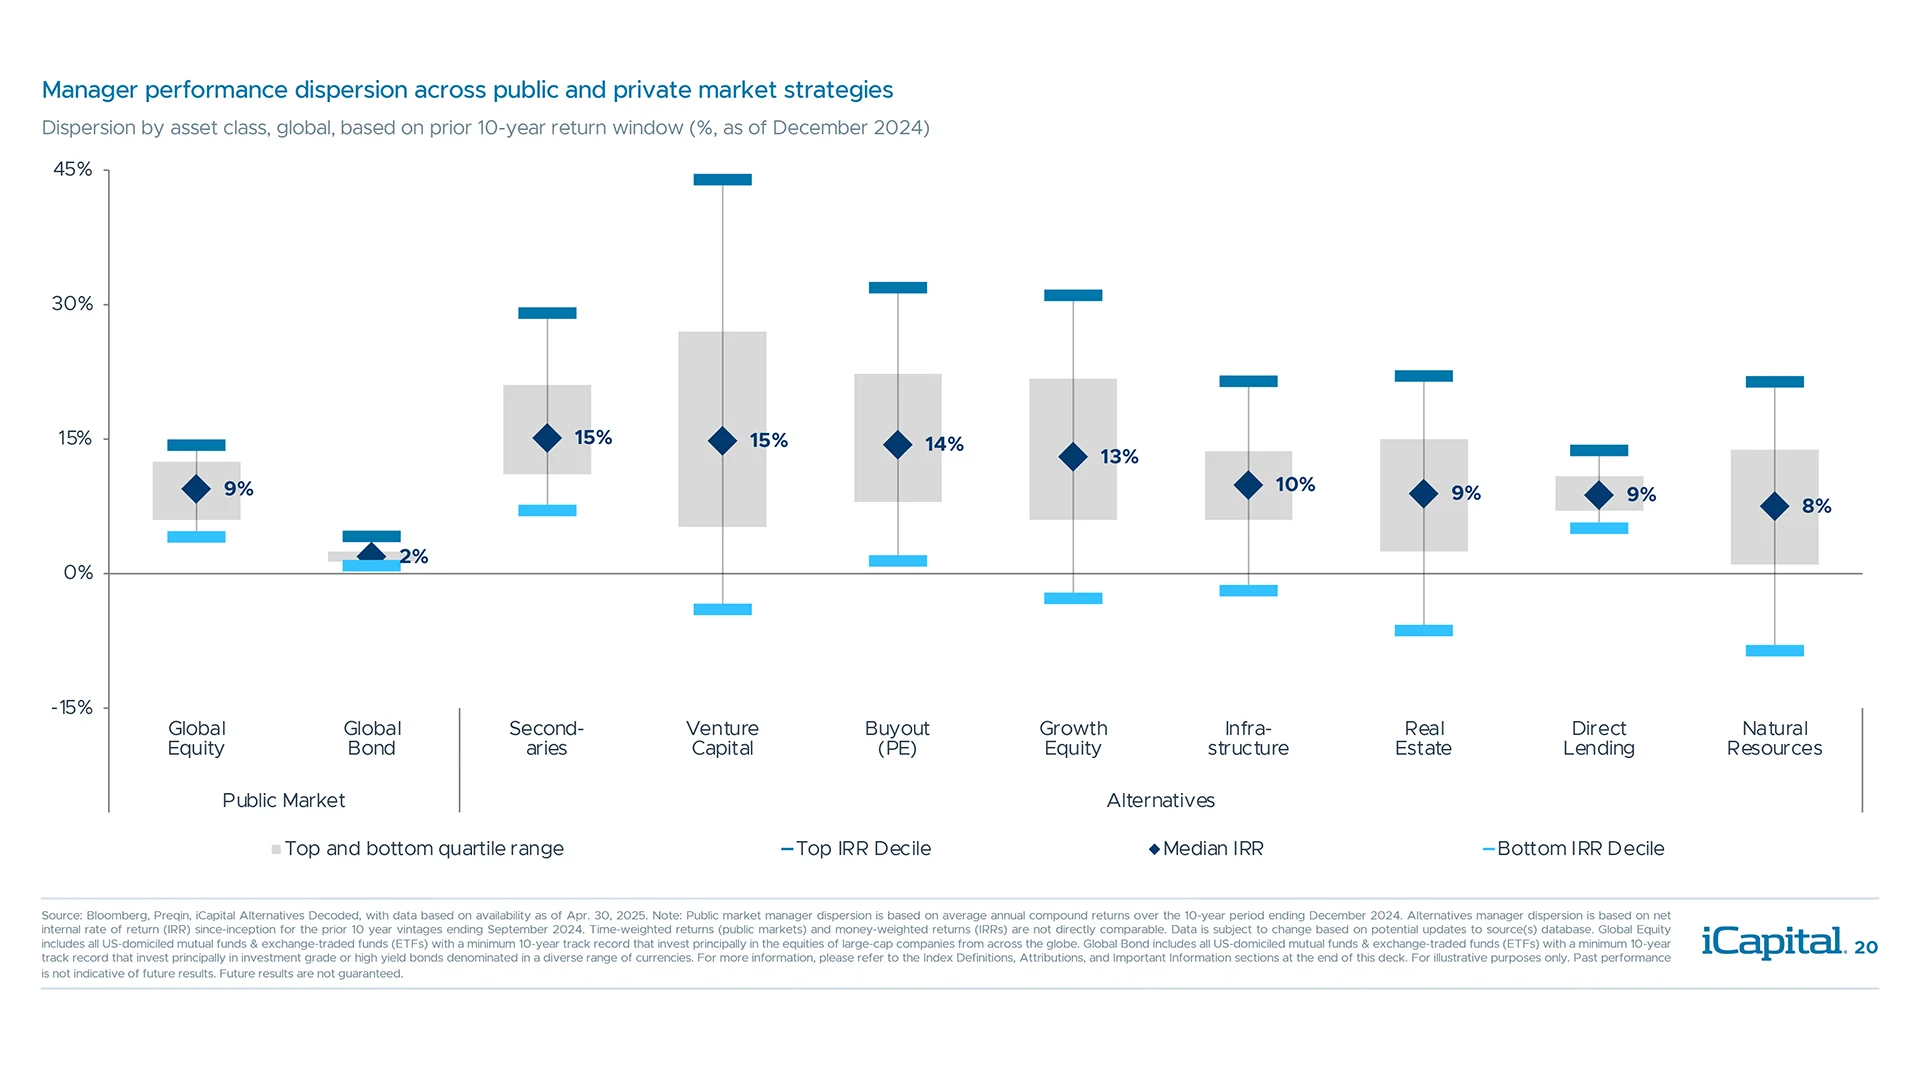
Manager selection has been an important driver of return outcomes in alternatives
Several private market strategies are inexpensive relative to public markets and history

Private clients to increase alternatives allocation from $4 trillion to $13 trillion by 2032
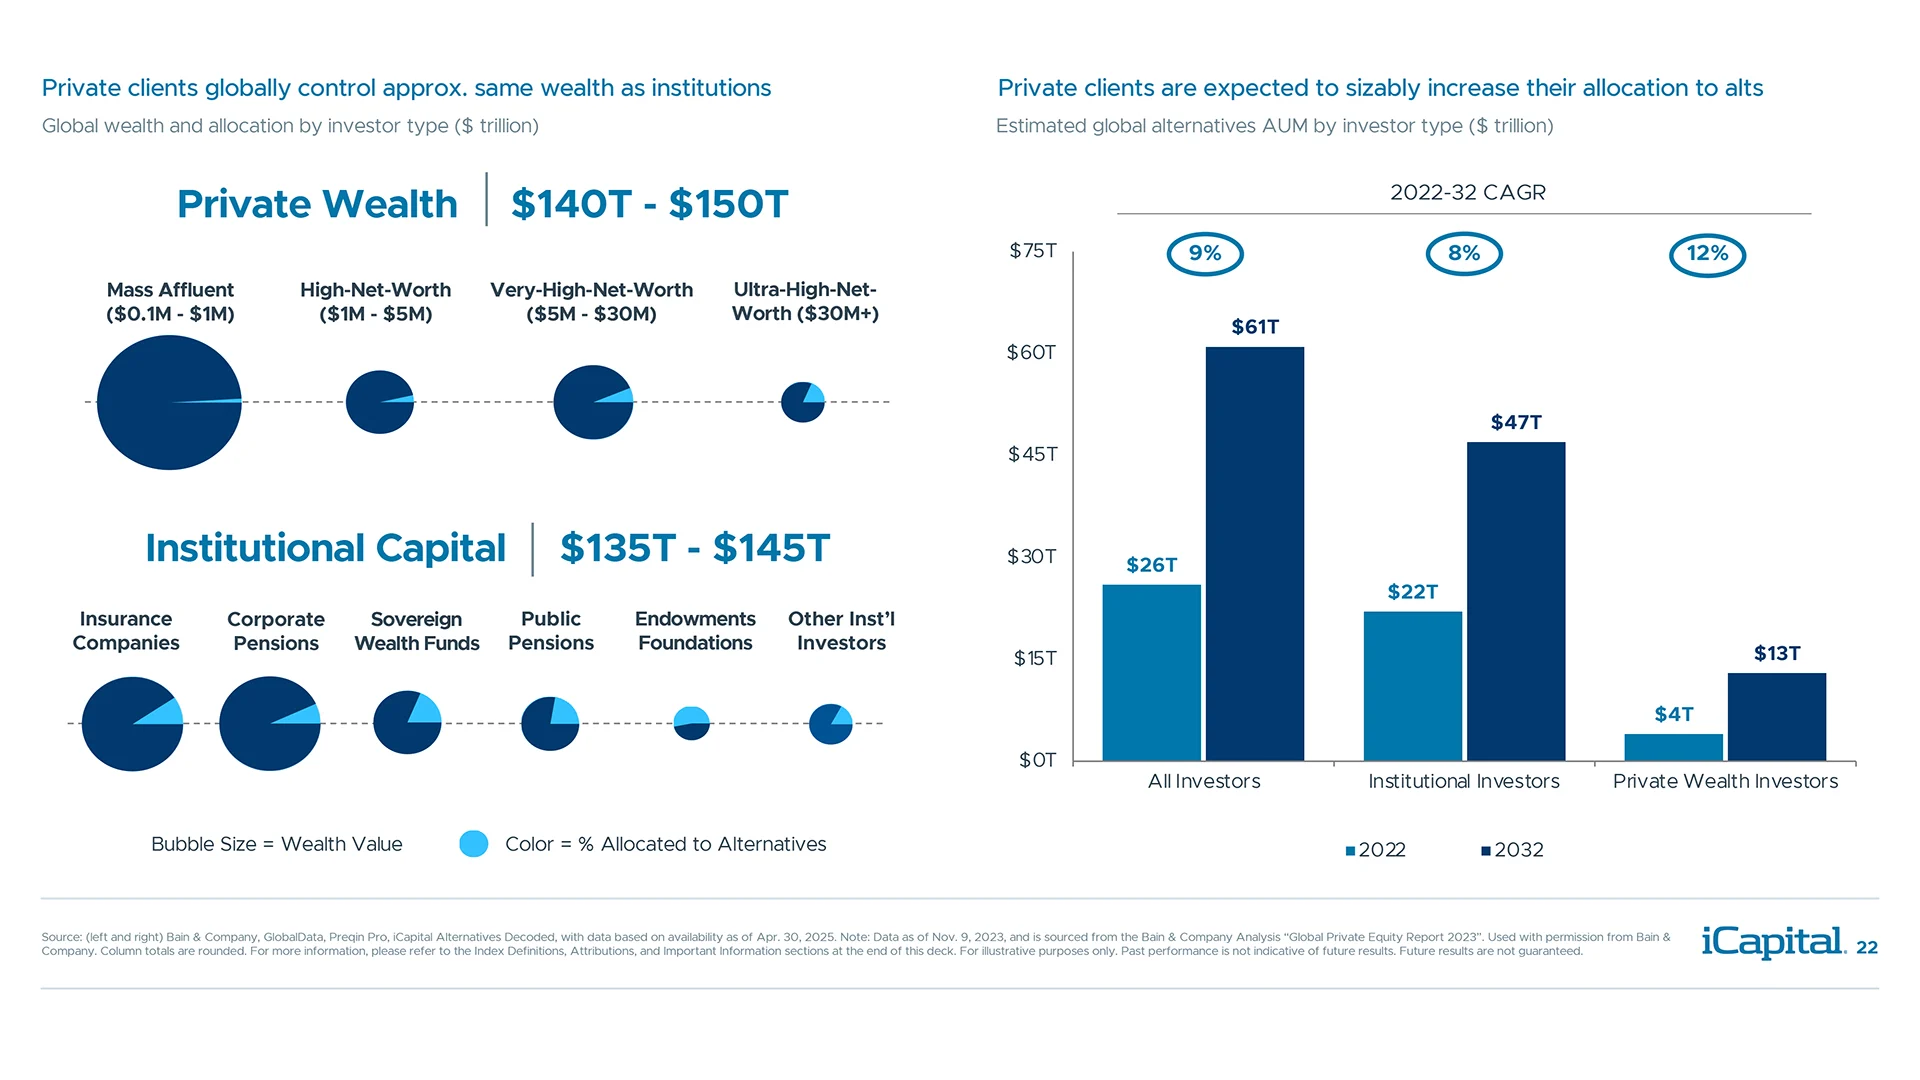
Opportunity to increase allocation is sizable given low portfolio allocation and advisor use


Private equity is the largest asset class within alternatives and has grown significantly

Companies are delaying their IPO (some indefinitely) as they stay private for longer

Private companies outnumber publicly traded ones, across most revenue segments
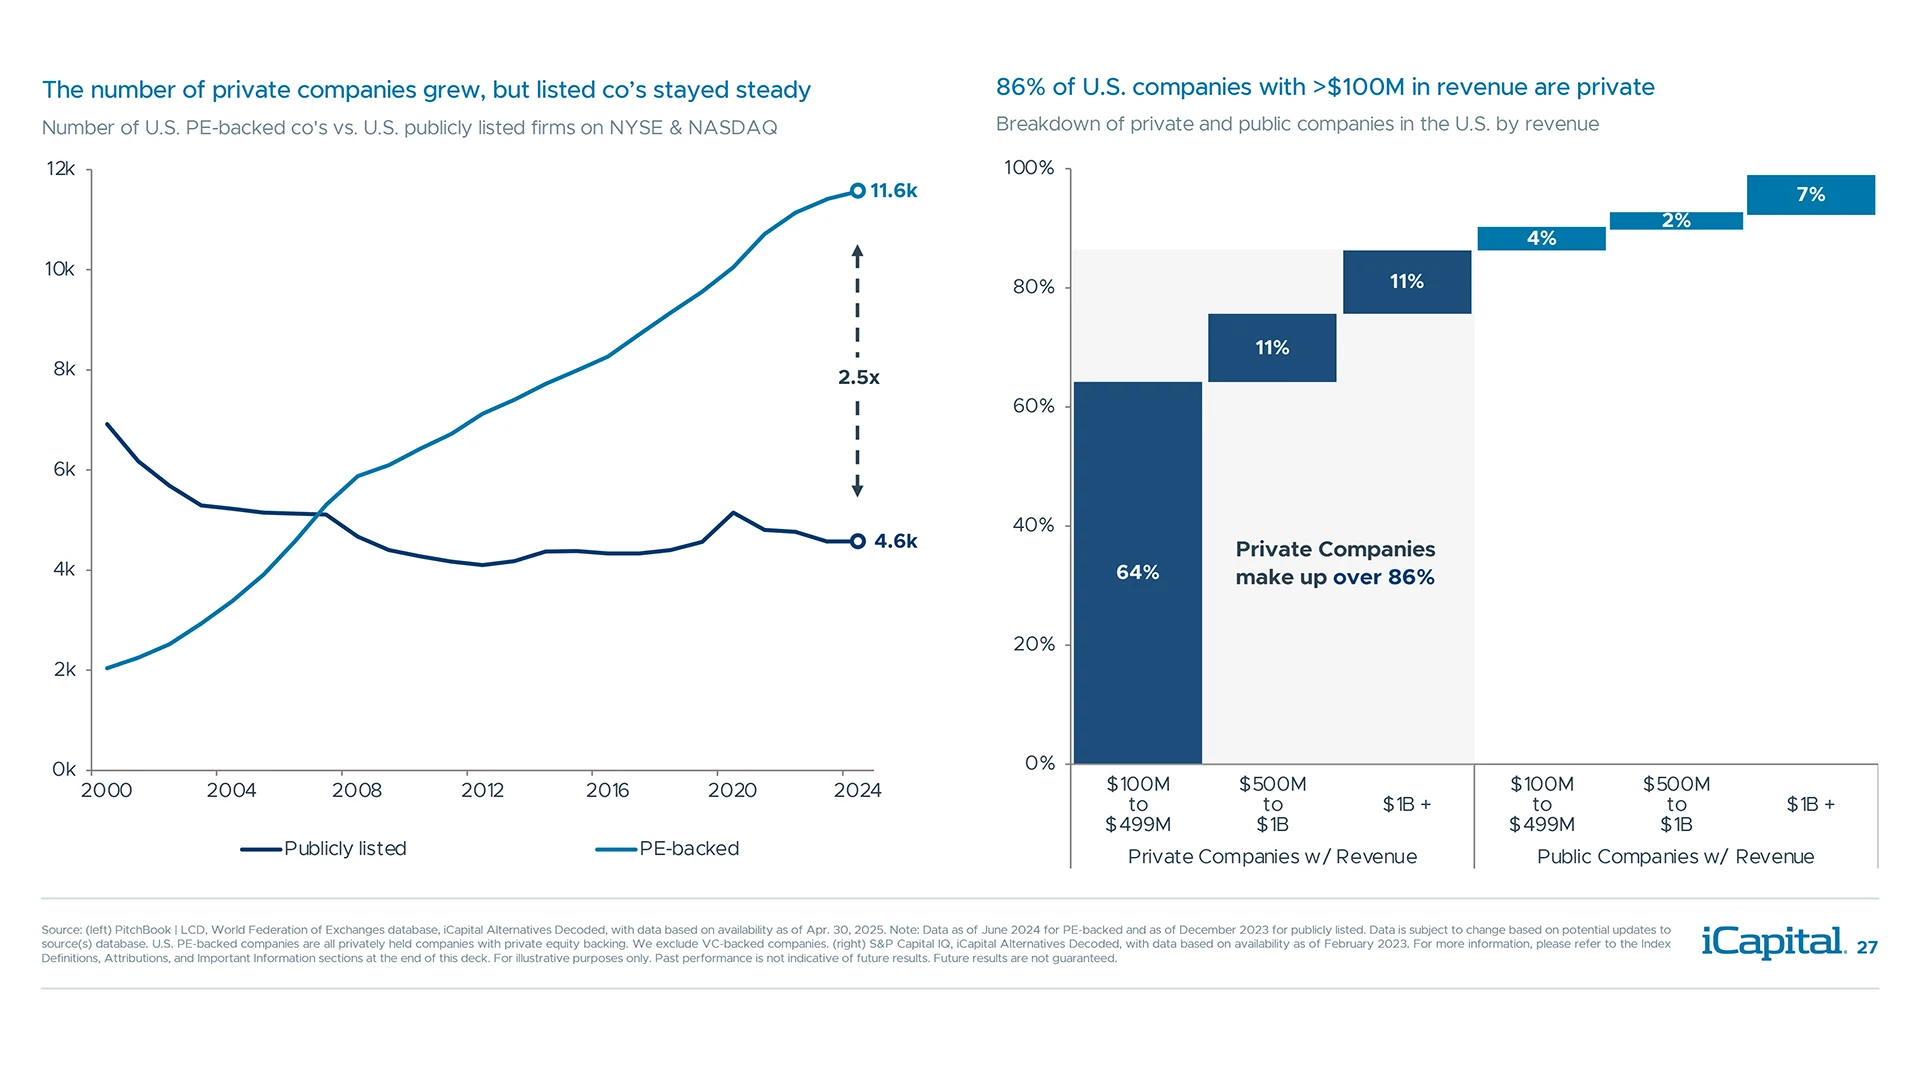
Private markets offer investors an opportunity to tap into a larger pool of innovation

Private equity outperformed public equities over various time horizons

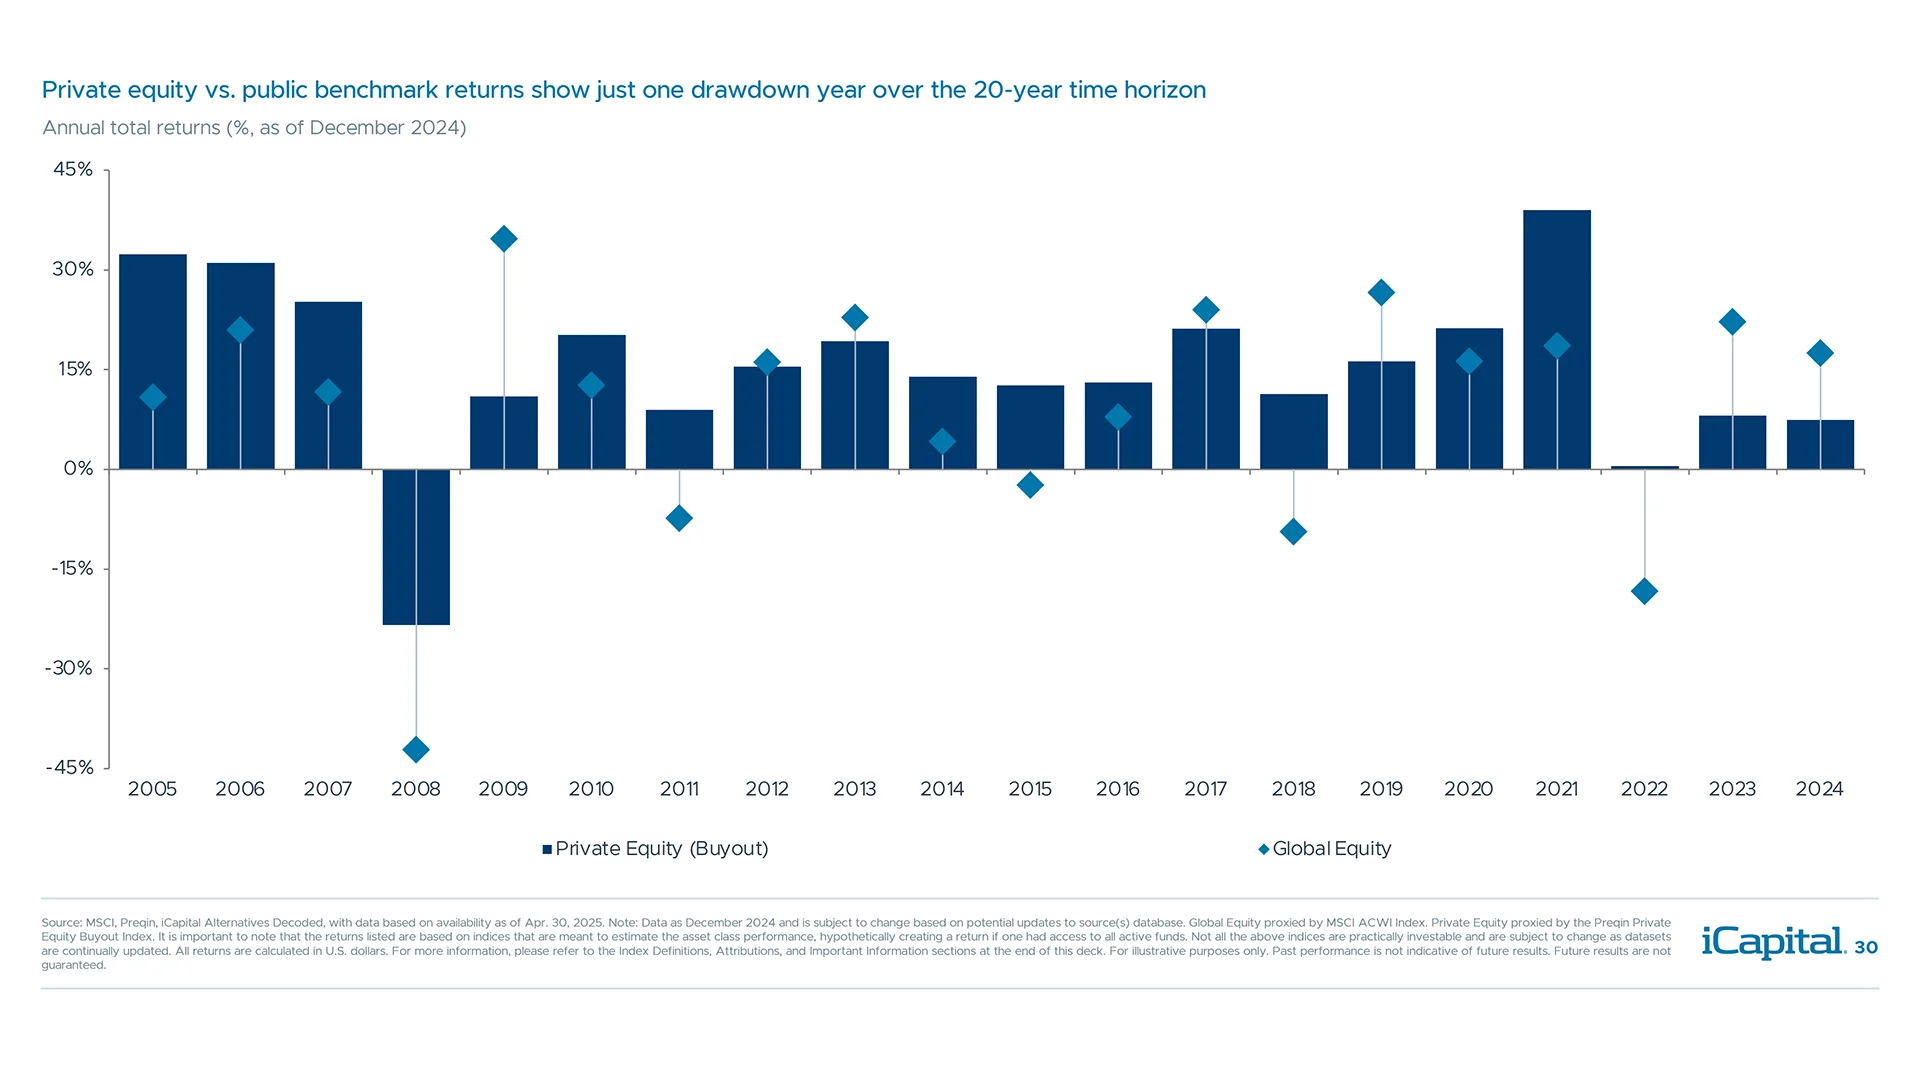
Private equity has delivered more consistently positive returns with fewer negative years
Private equity improves when investing during downturn year vintages

Private equity fund managers have multiple ways to create value vs. public markets

Private equity valuations have stabilized and remain lower than public markets in the U.S.

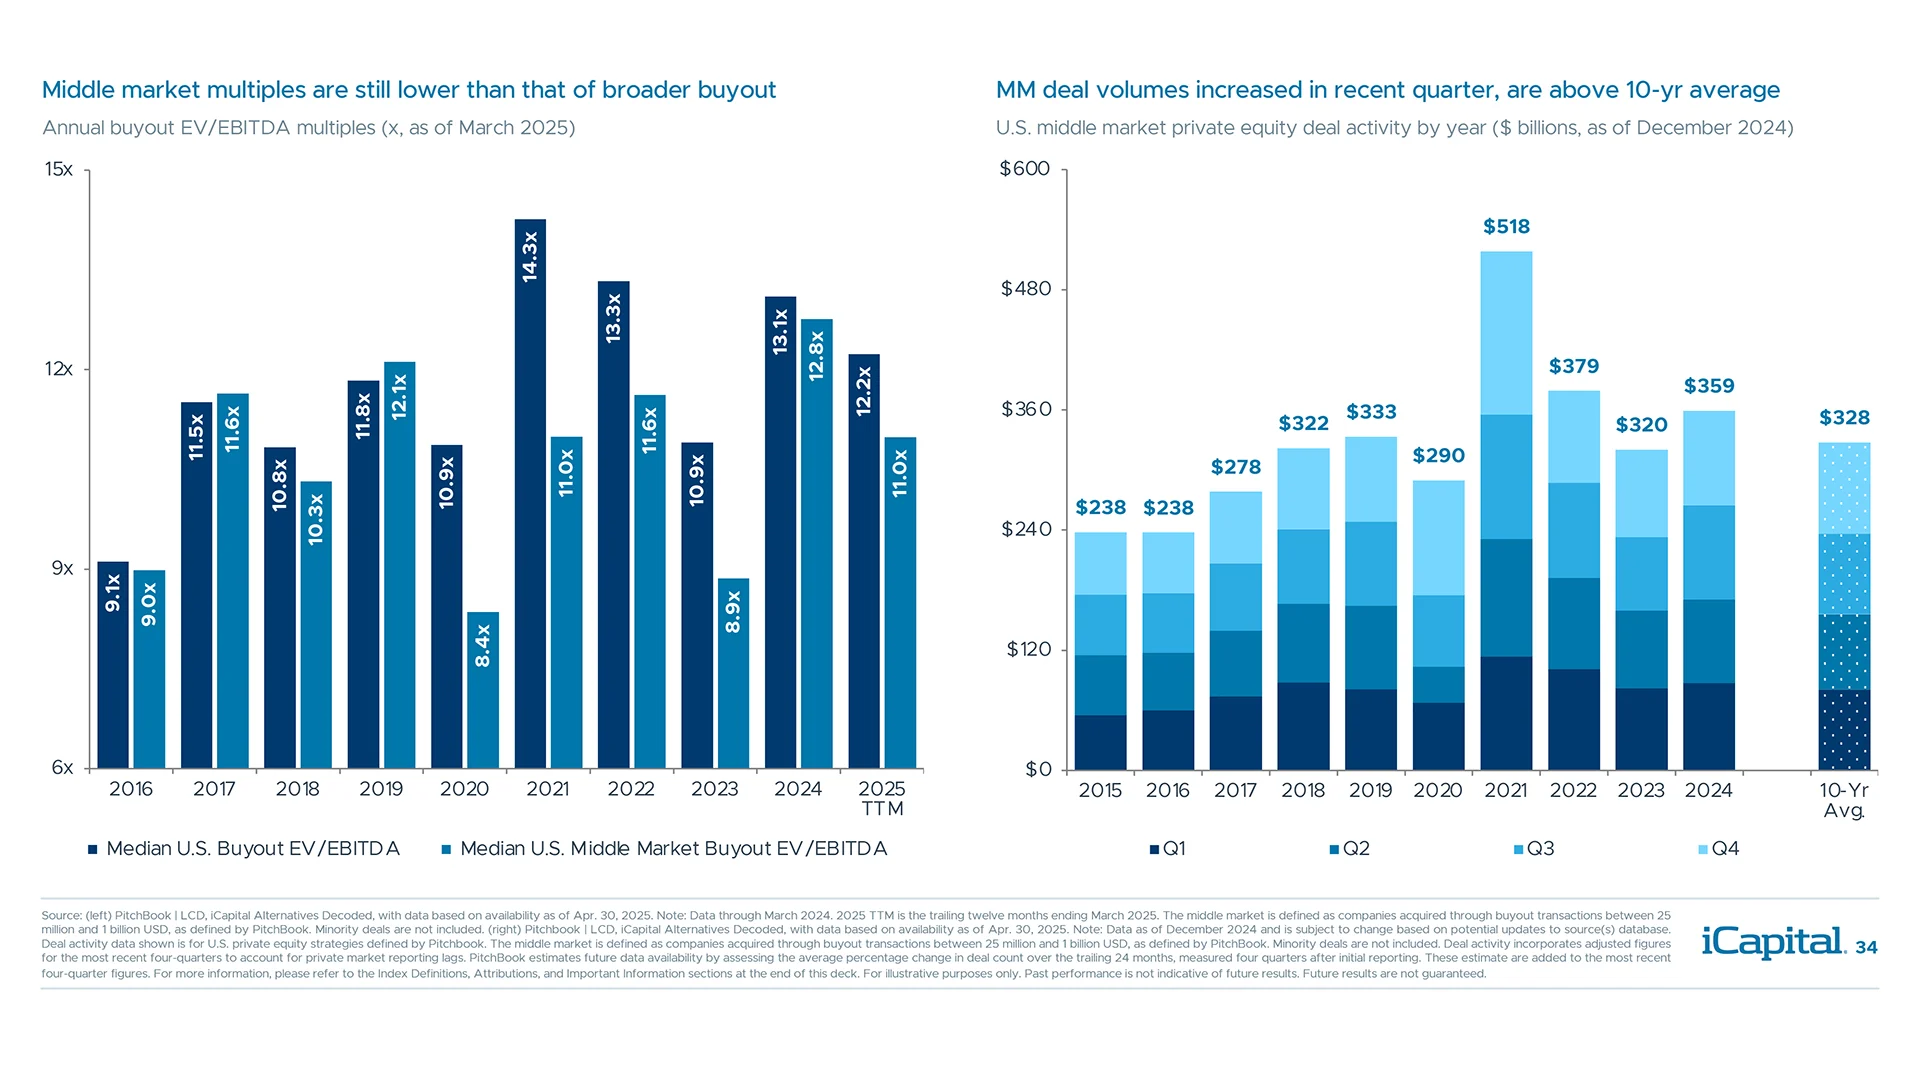
Middle market buyout may be in favor this year given valuations and capital market activity
Fund managers have adjusted to higher cost of capital by reducing the use of leverage

Realization of further rate cuts may help improve levered company financials

Exits have been off to a lackluster start and will likely be challenged by the macro backdrop

Capital markets optimism has faded on tariff concerns and lack of deregulation focus

Holding periods continue to increase and drive the need for additional sources of liquidity

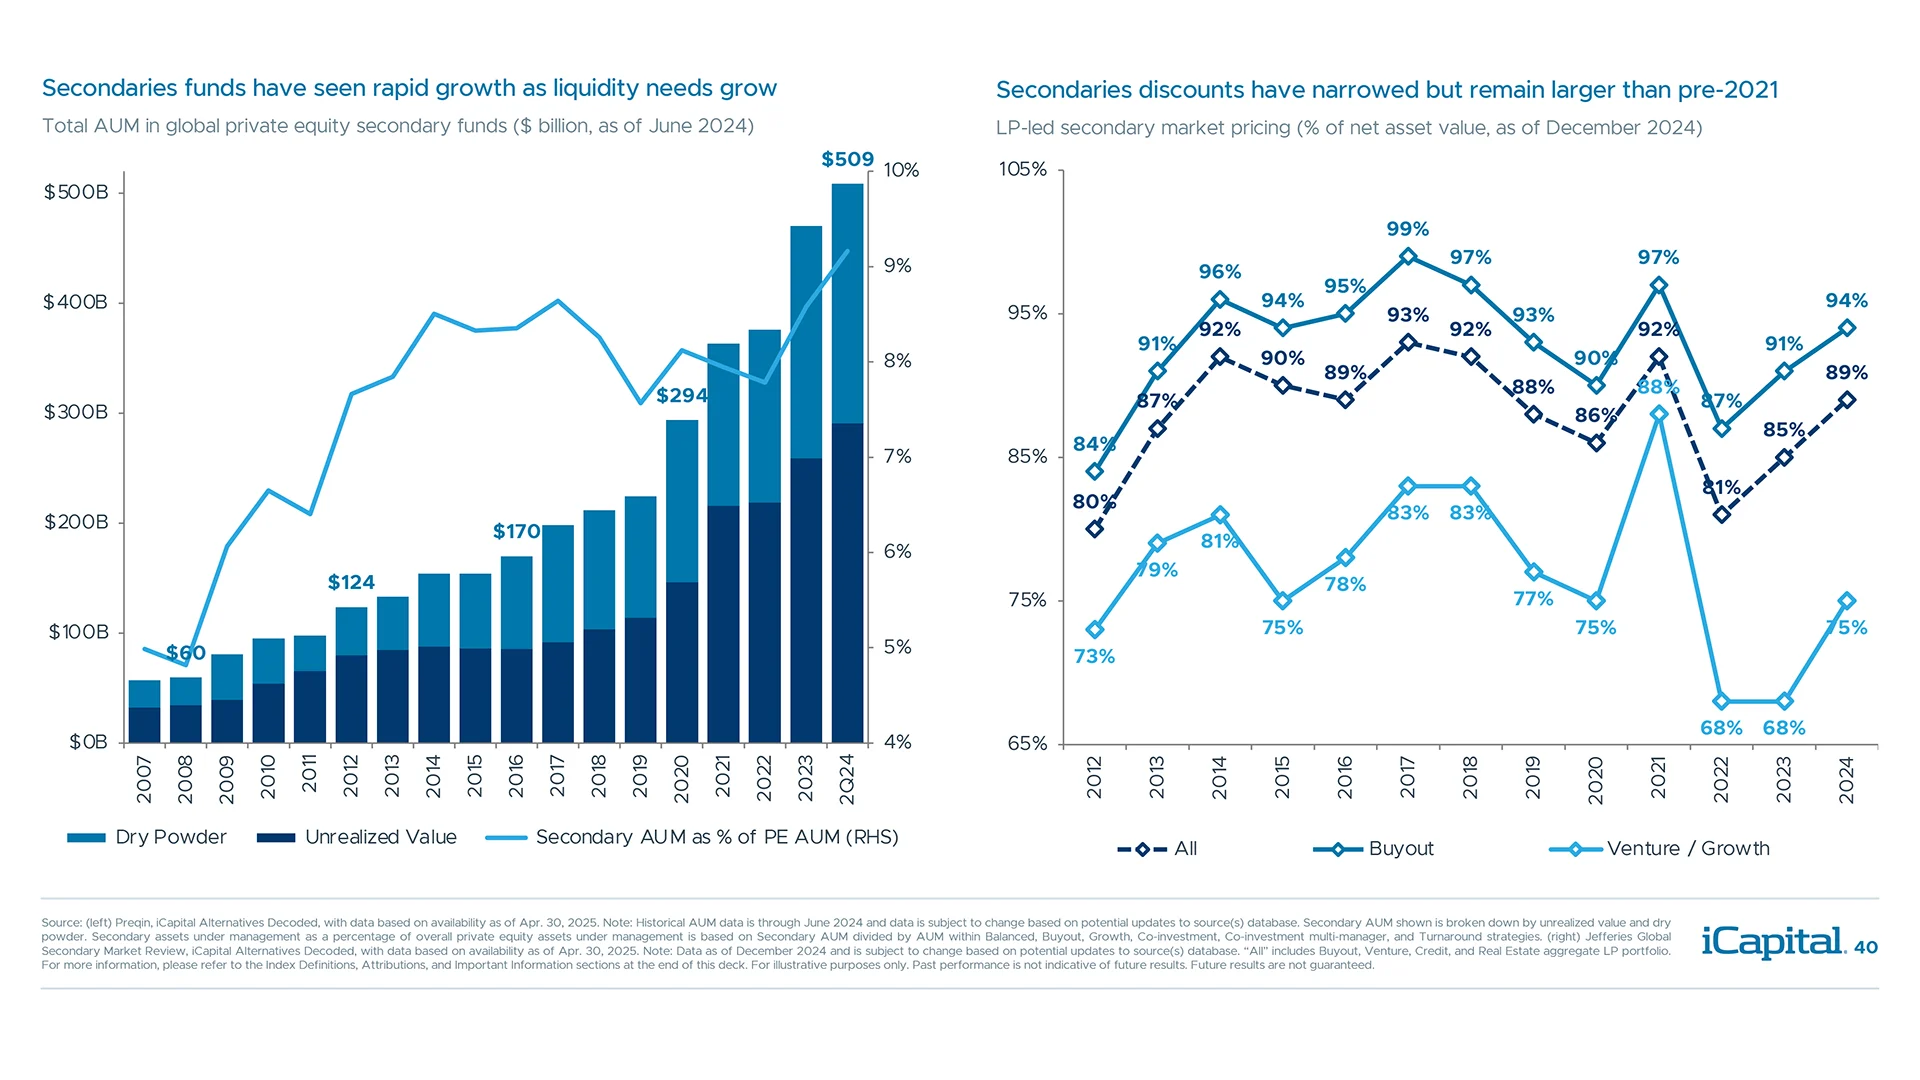
Growth in secondaries is driven by strong supply/demand dynamics

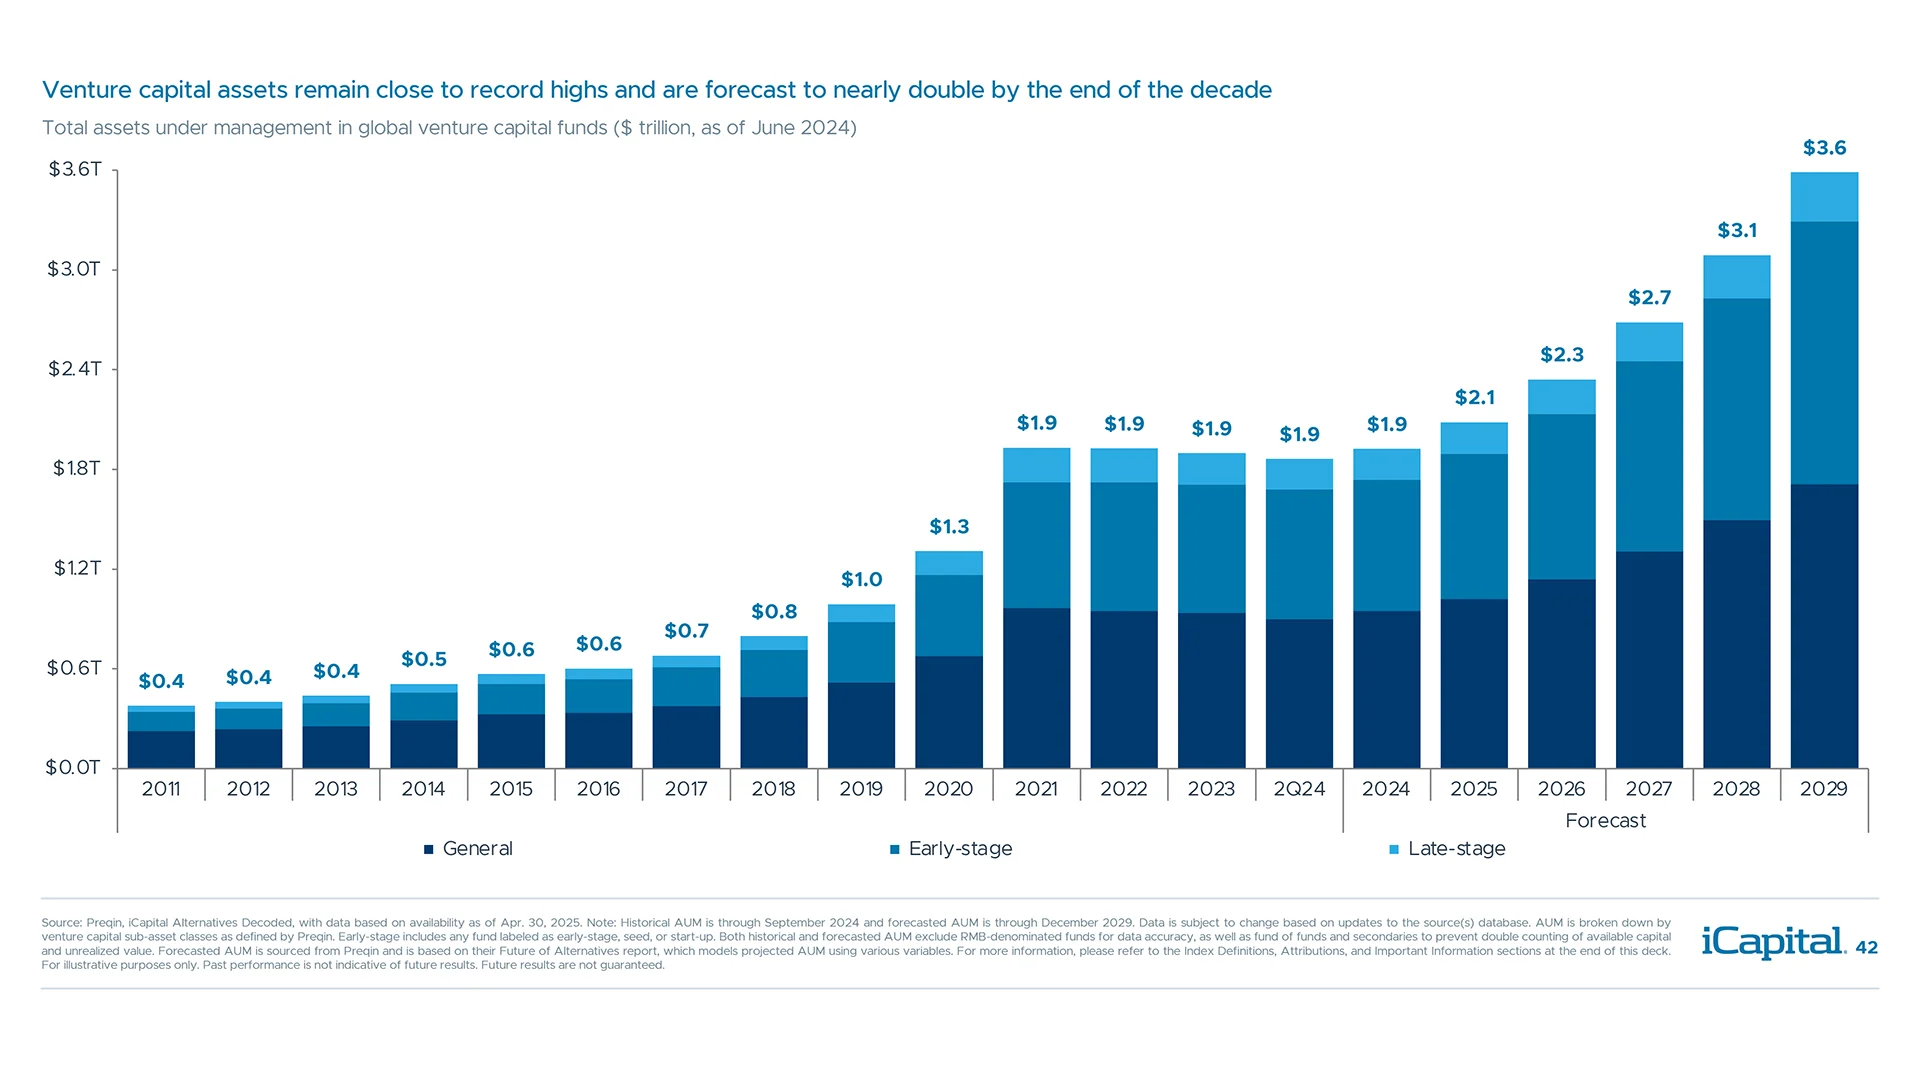
Venture capital AUM is expected to grow at a 12.7% CAGR through 2029
Venture capital offers access to a vast opportunity set and high-growth sectors like Tech
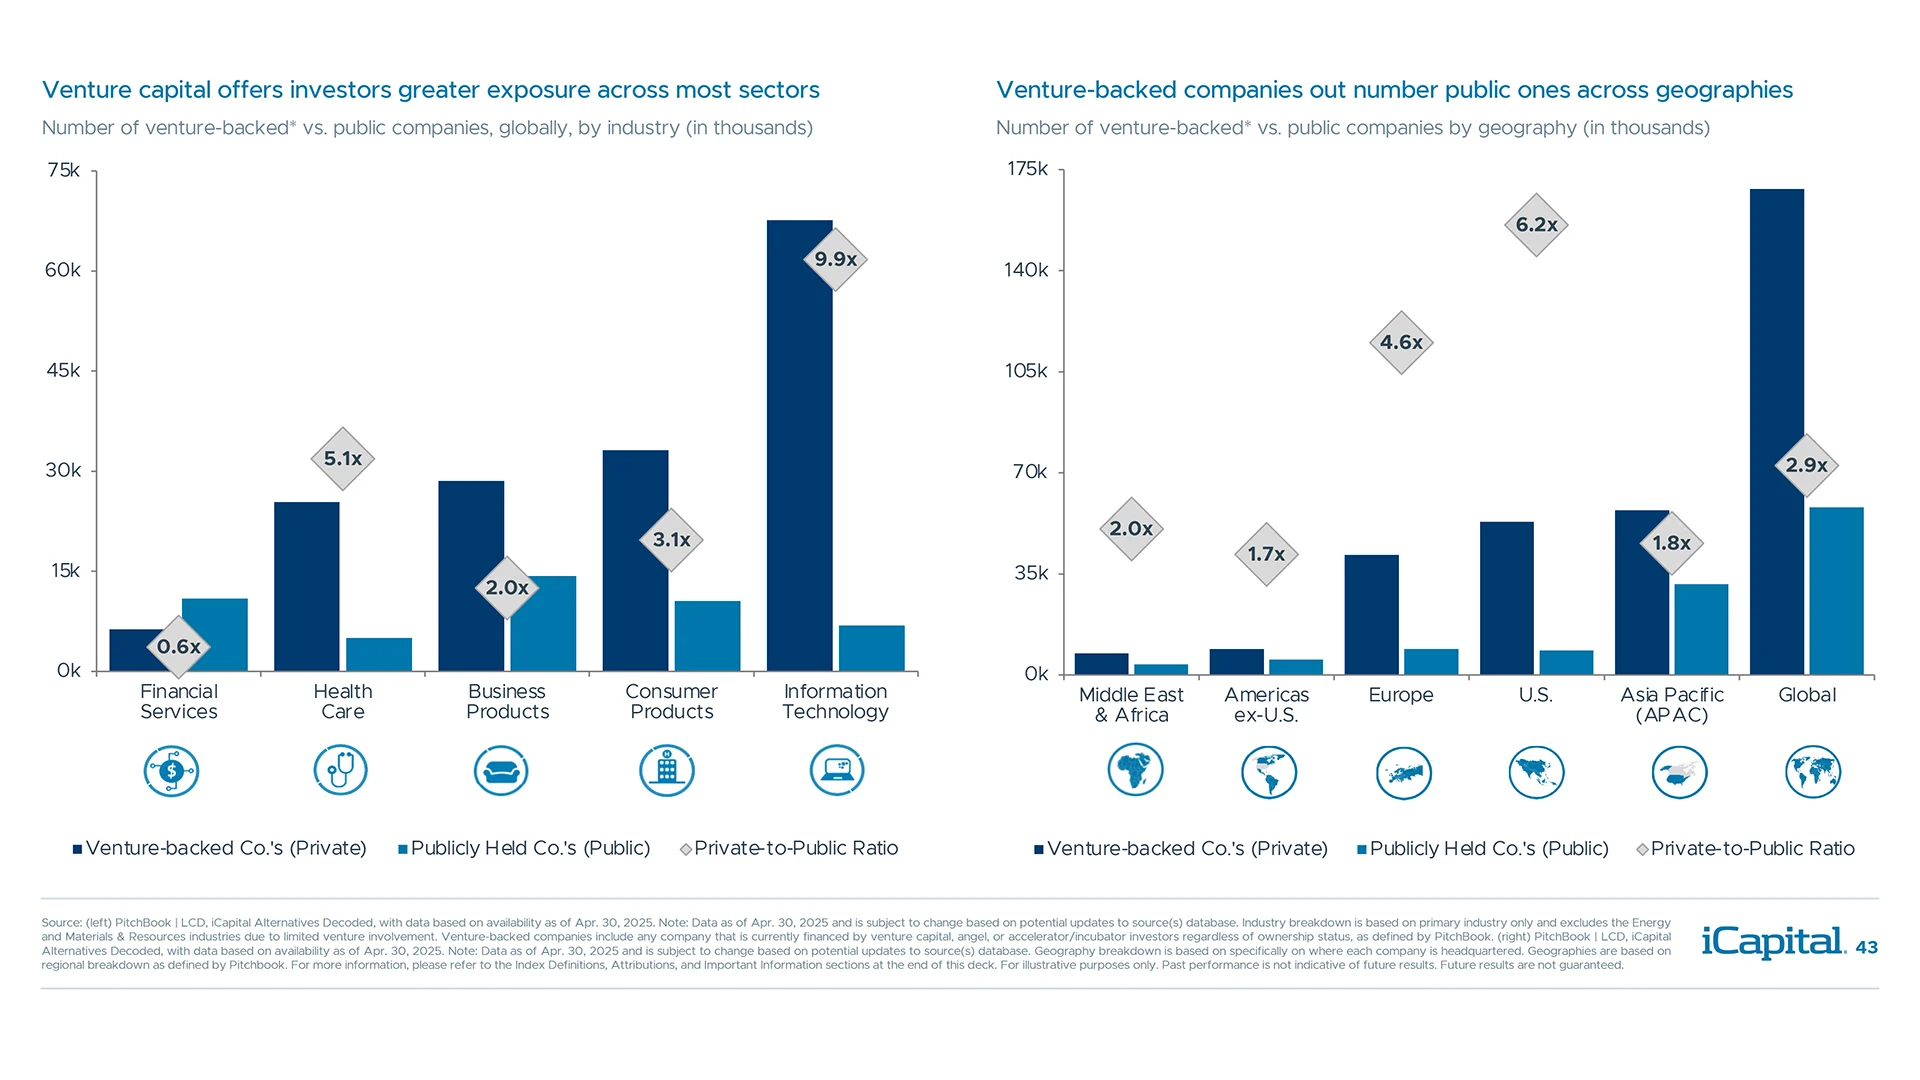
Venture capital has become a dominant force in the financing of innovation and growth

Private markets drive most of the value creation meaning most returns are captured pre-IPO

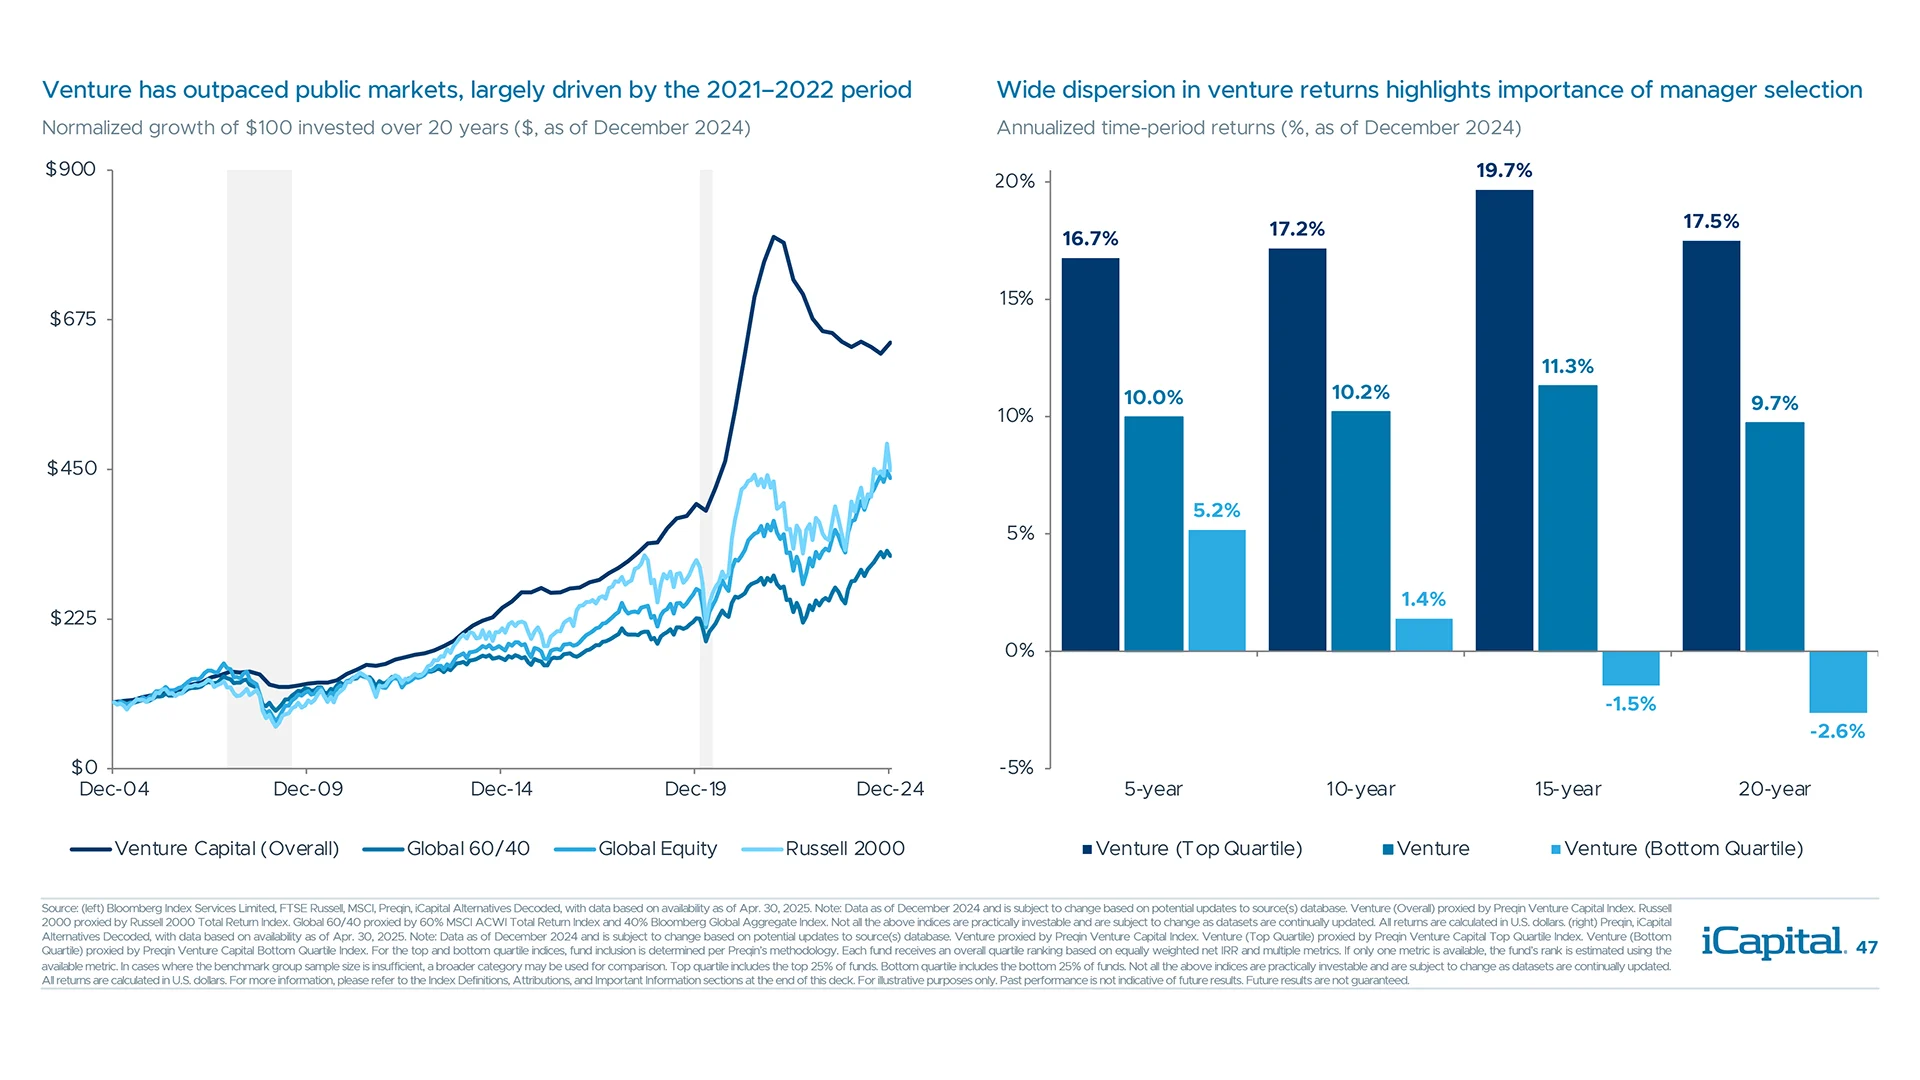
Despite recent underperformance, venture returns have outpaced equities over the long run

Manager selection is key when investing in VC as top quartile funds significantly outperform
Signs point to a turning tide in venture capital despite recent macro turmoil & uncertainty

Venture valuations have remained sticky but are more reasonable than they appear

Lower valuation step-ups signal a cooler VC market but better entry points for investors

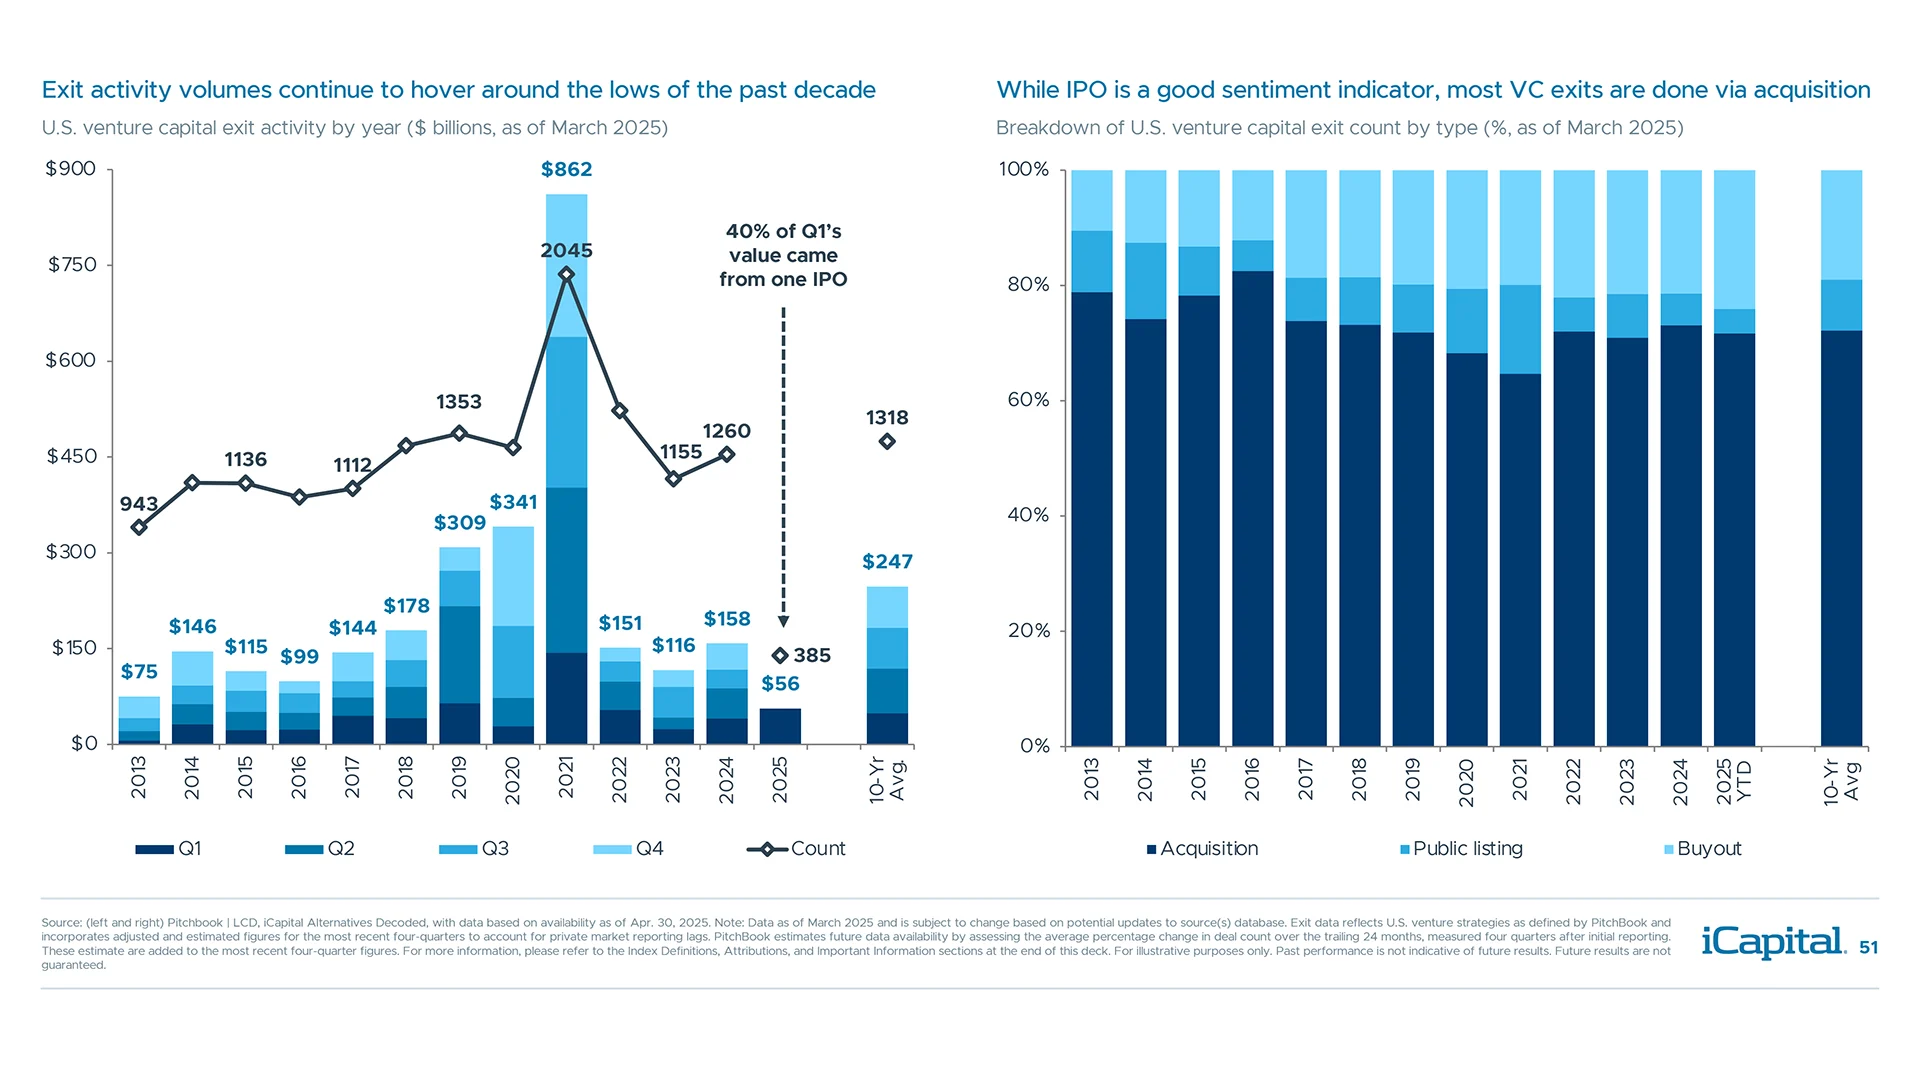
Exit activity remains challenged, and acquisitions continue to be primary exit path for startups
AI startups drive VC funding resurgence, and they command significant valuation premiums

Private Credit

Private credit AUM have grown rapidly to record levels

Secular decline in bank lending is being driven by regulation, capital requirements

Growth in private equity buyout strategies drives further demand for private credit

Private credit strategies historically outperformed public fixed income sectors
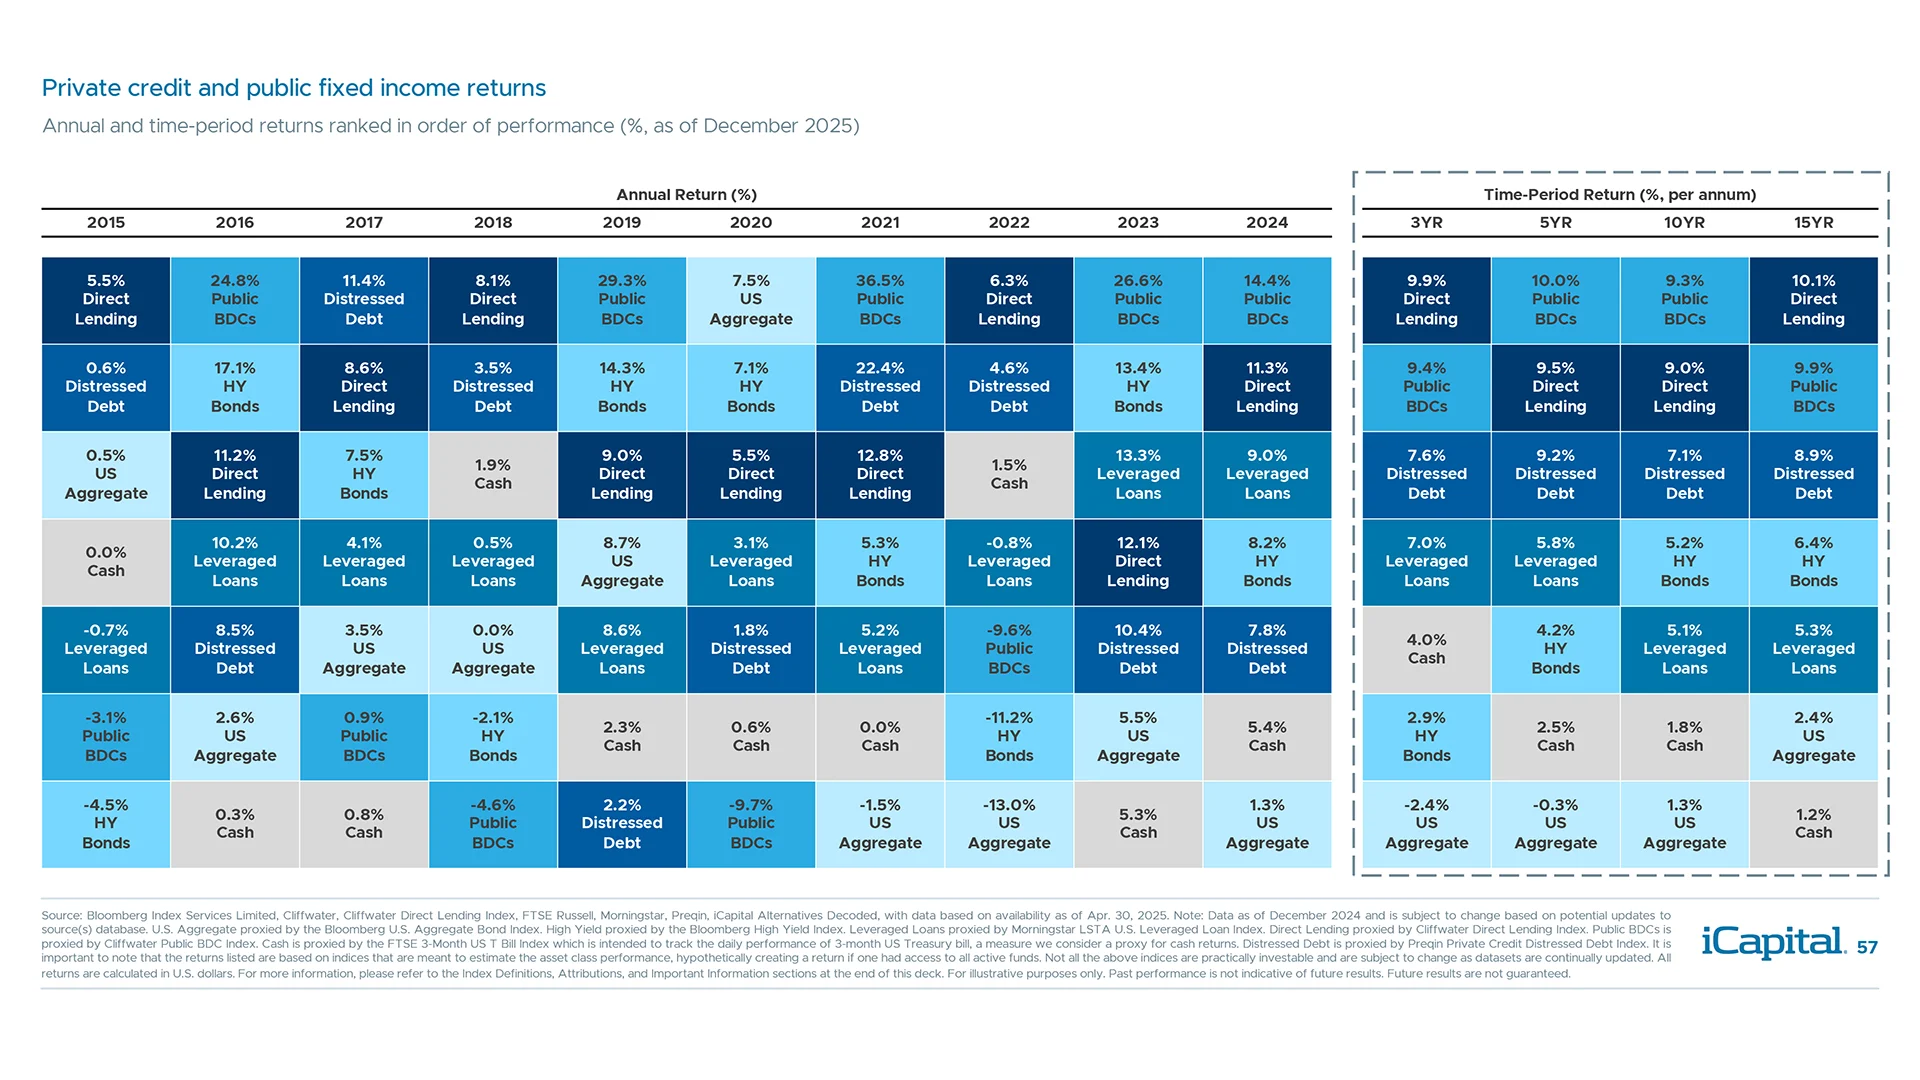
Direct lending offered favorable risk-adjusted returns versus public fixed income

Private credit drawdown risk is moderated by buy-and-hold nature, fewer dislocations

Risk premium, complexity and market inefficiencies provides a backdrop for attractive yields

Direct lending spreads recently widened, moving closer to historical excess spread
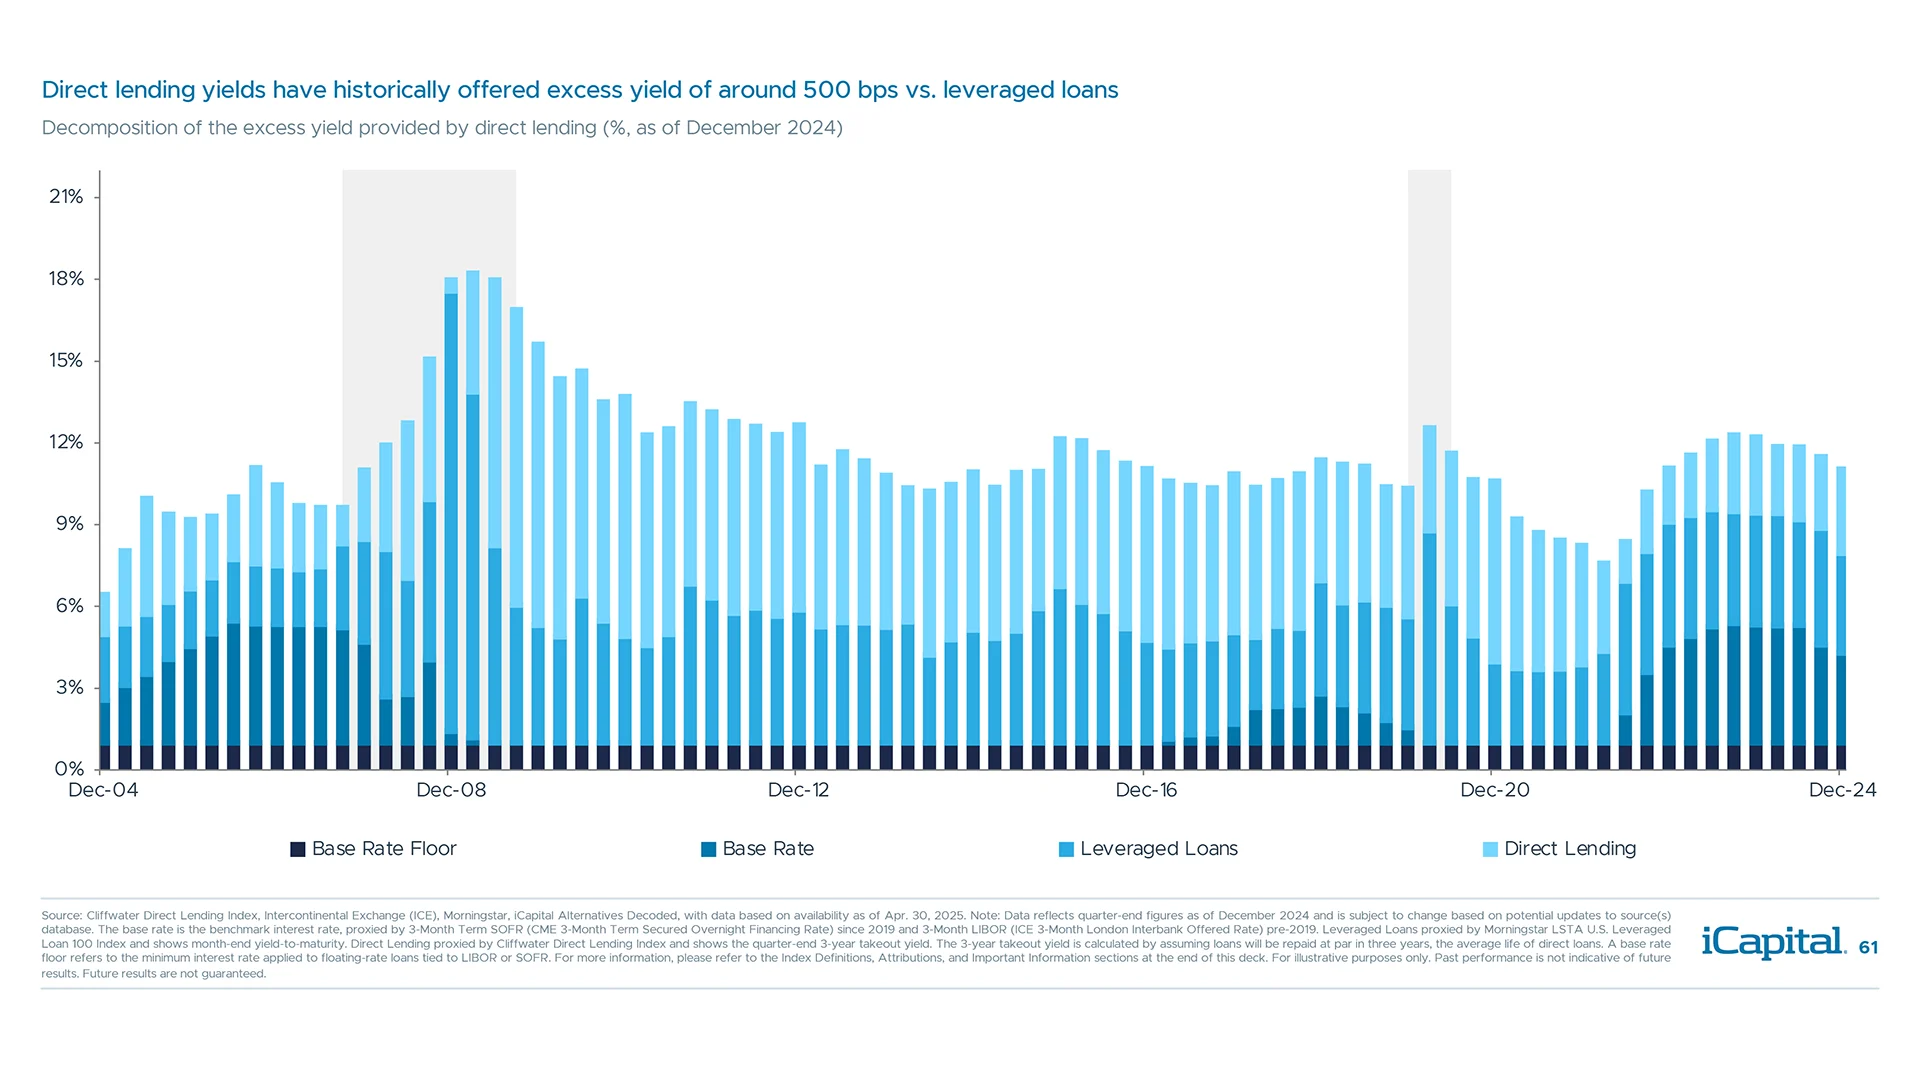
Income has been a steady component of private credit returns over time

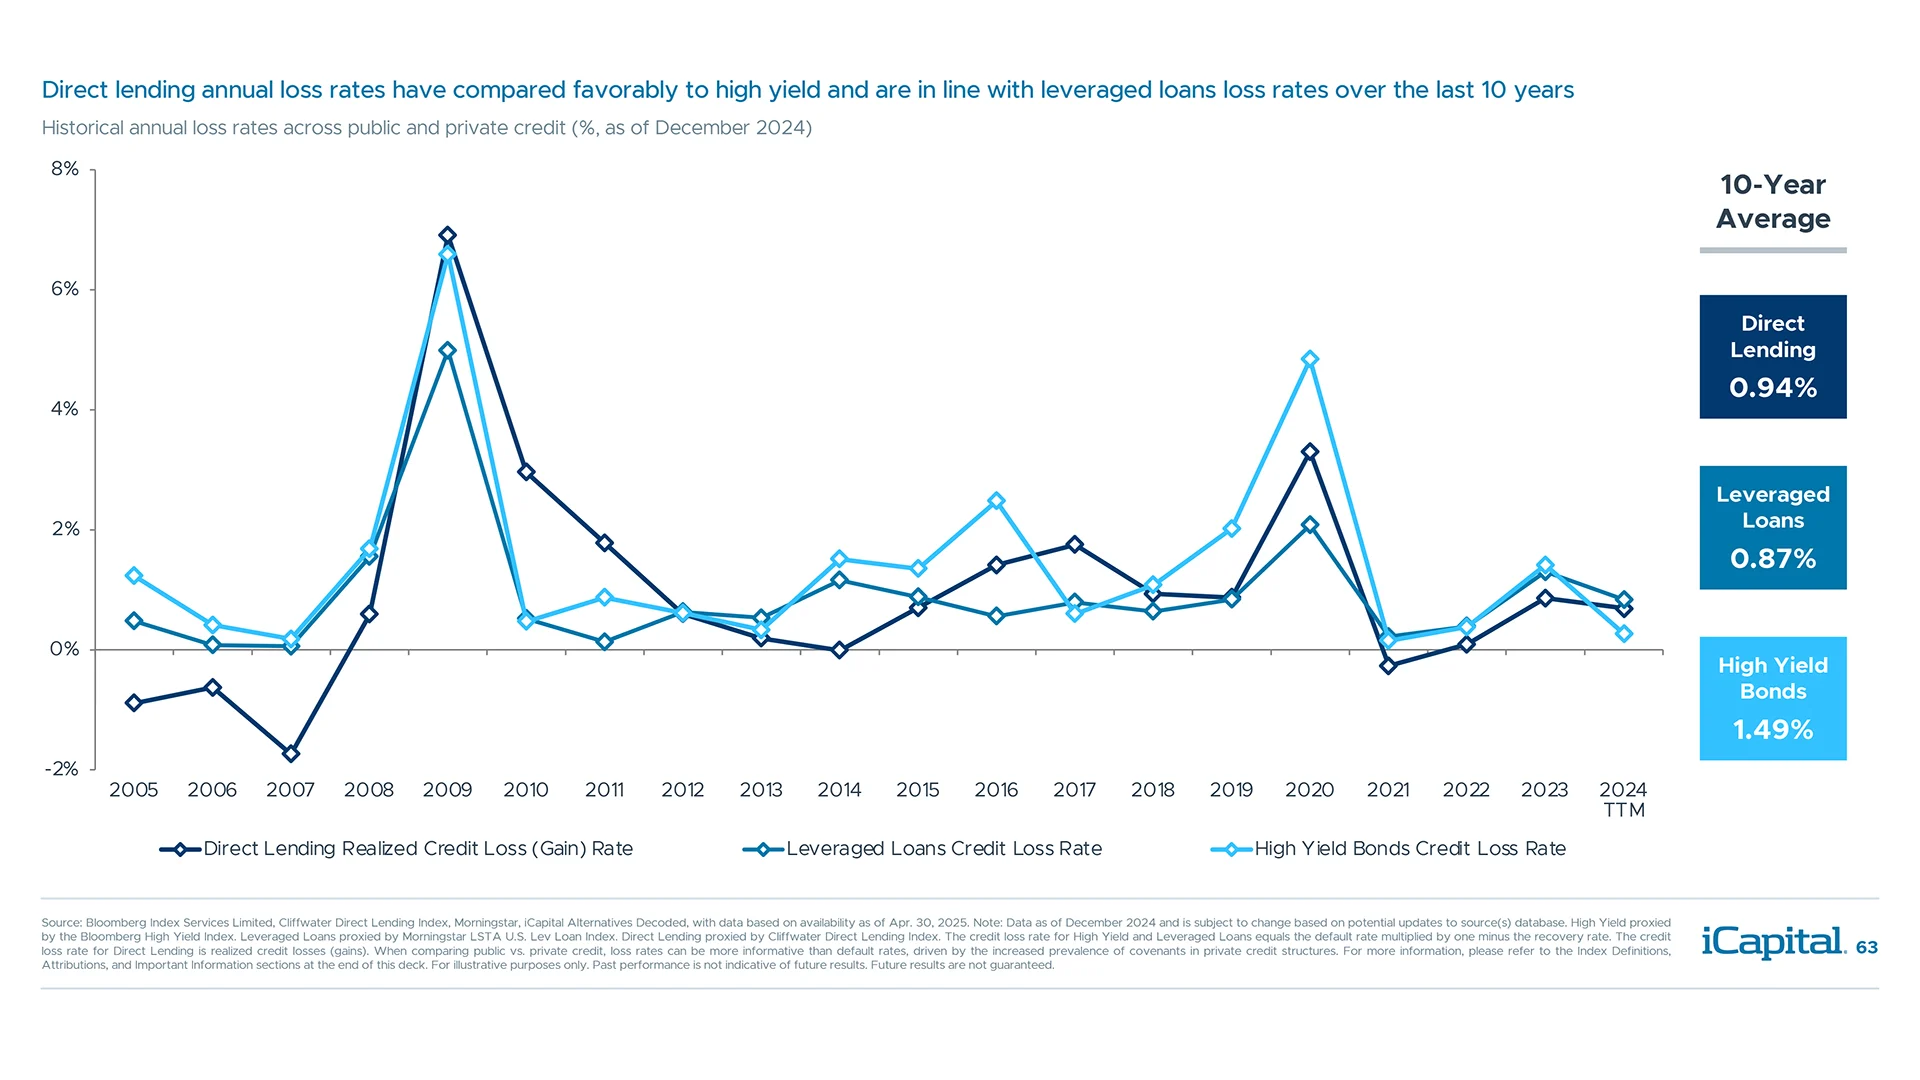
Credit losses for private credit have been in line with high yield and bank loan issuers
Private credit coverage ratios are improving, which could help keep defaults in check

Lower volatility, high income led to more consistently positive results for private credit

The emergence of asset-based-lending in private credit unlocks a vastly larger opportunity set

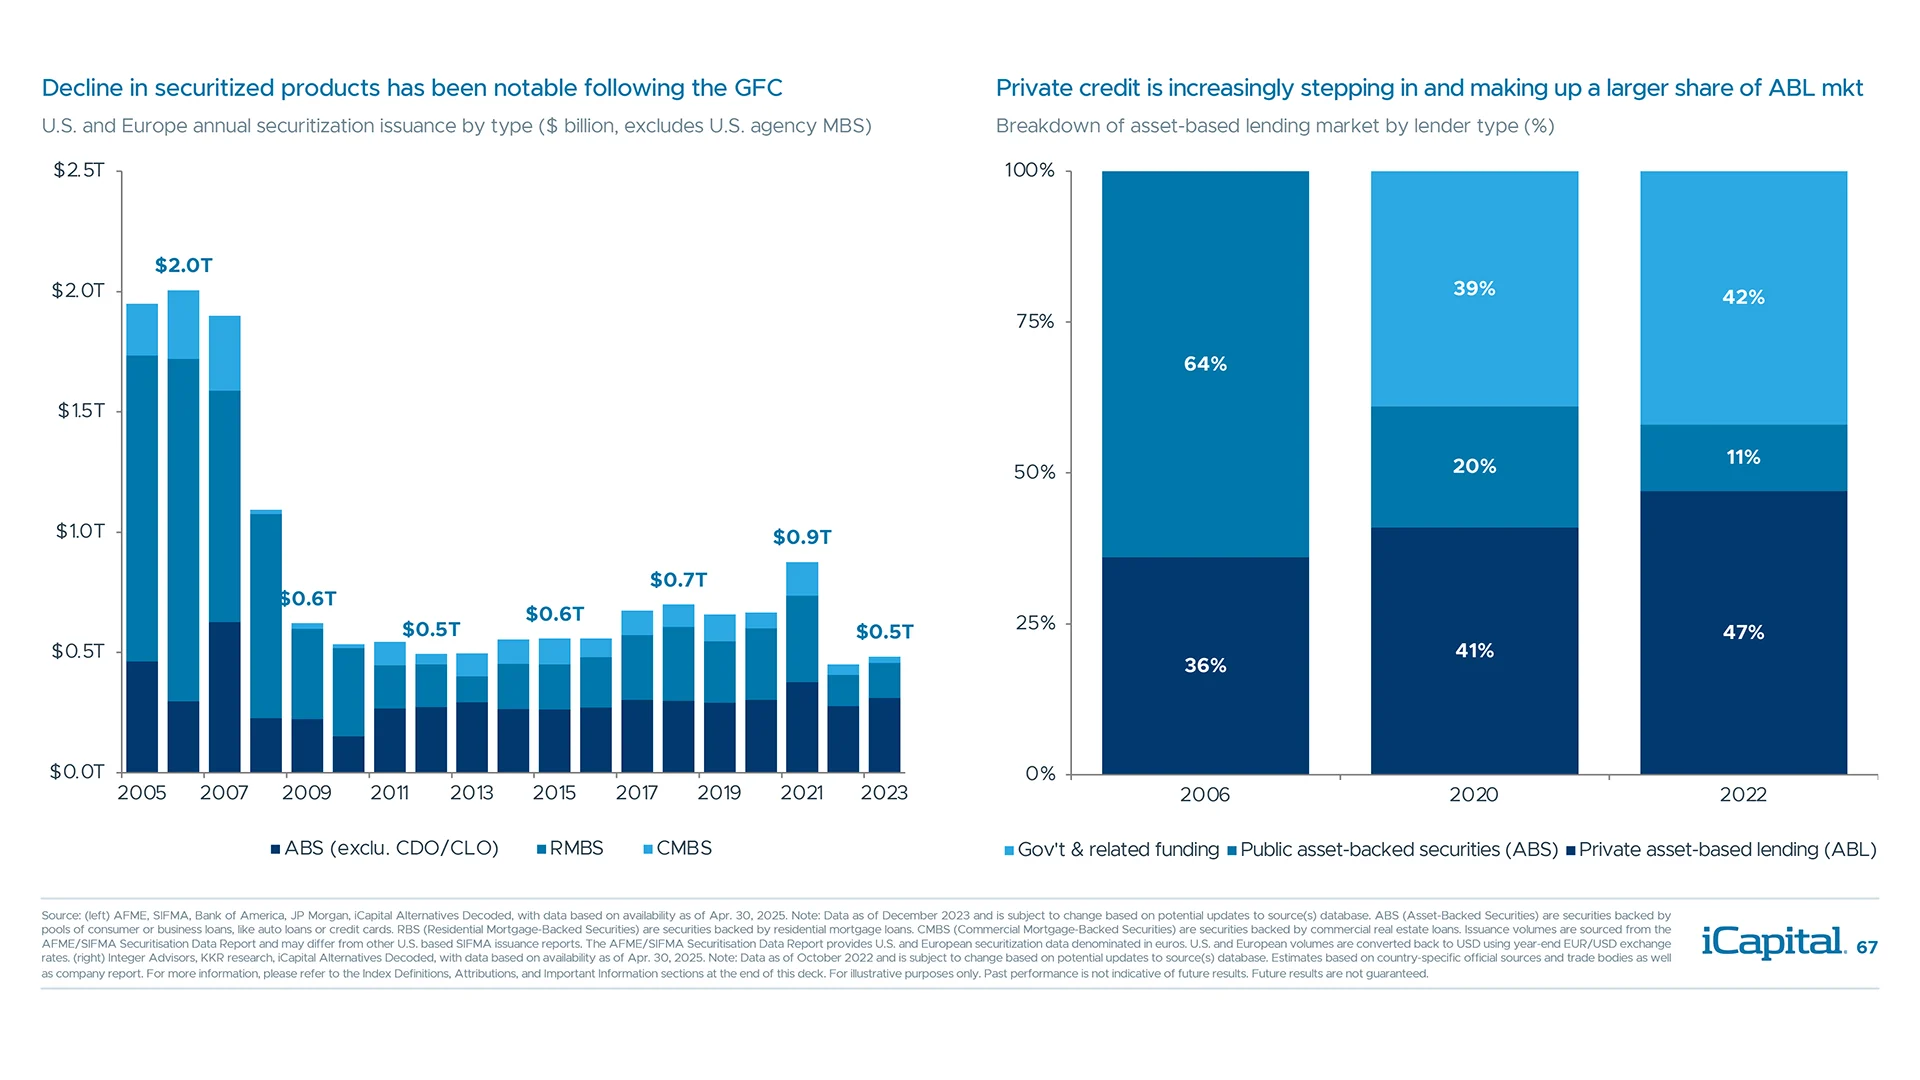
Asset-based lending is becoming a meaningful alternative as banks pulled back post-GFC

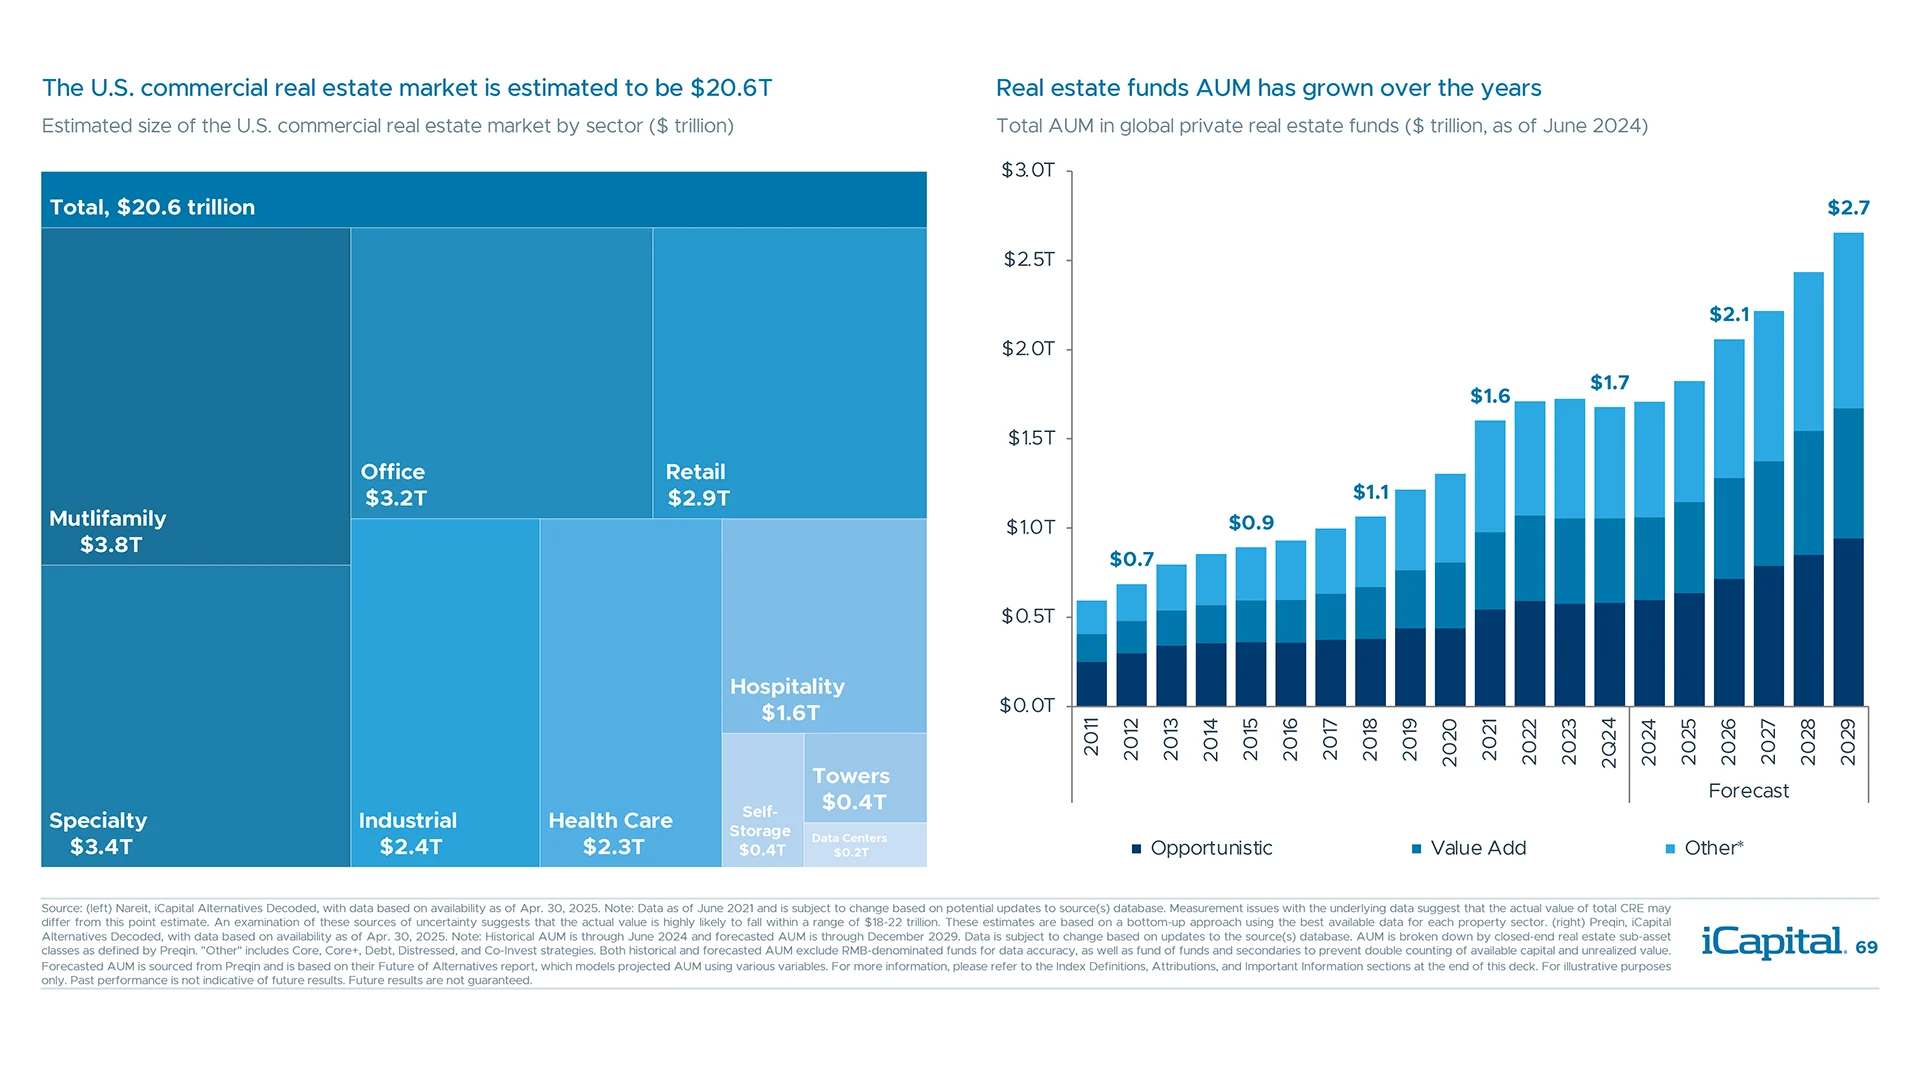
CRE is a large, diversified asset class with growing interest from private capital investors
CRE has had a low correlation to and better risk-adjusted returns than public markets

Private real estate had less frequent drawdowns, which helped deliver returns overtime

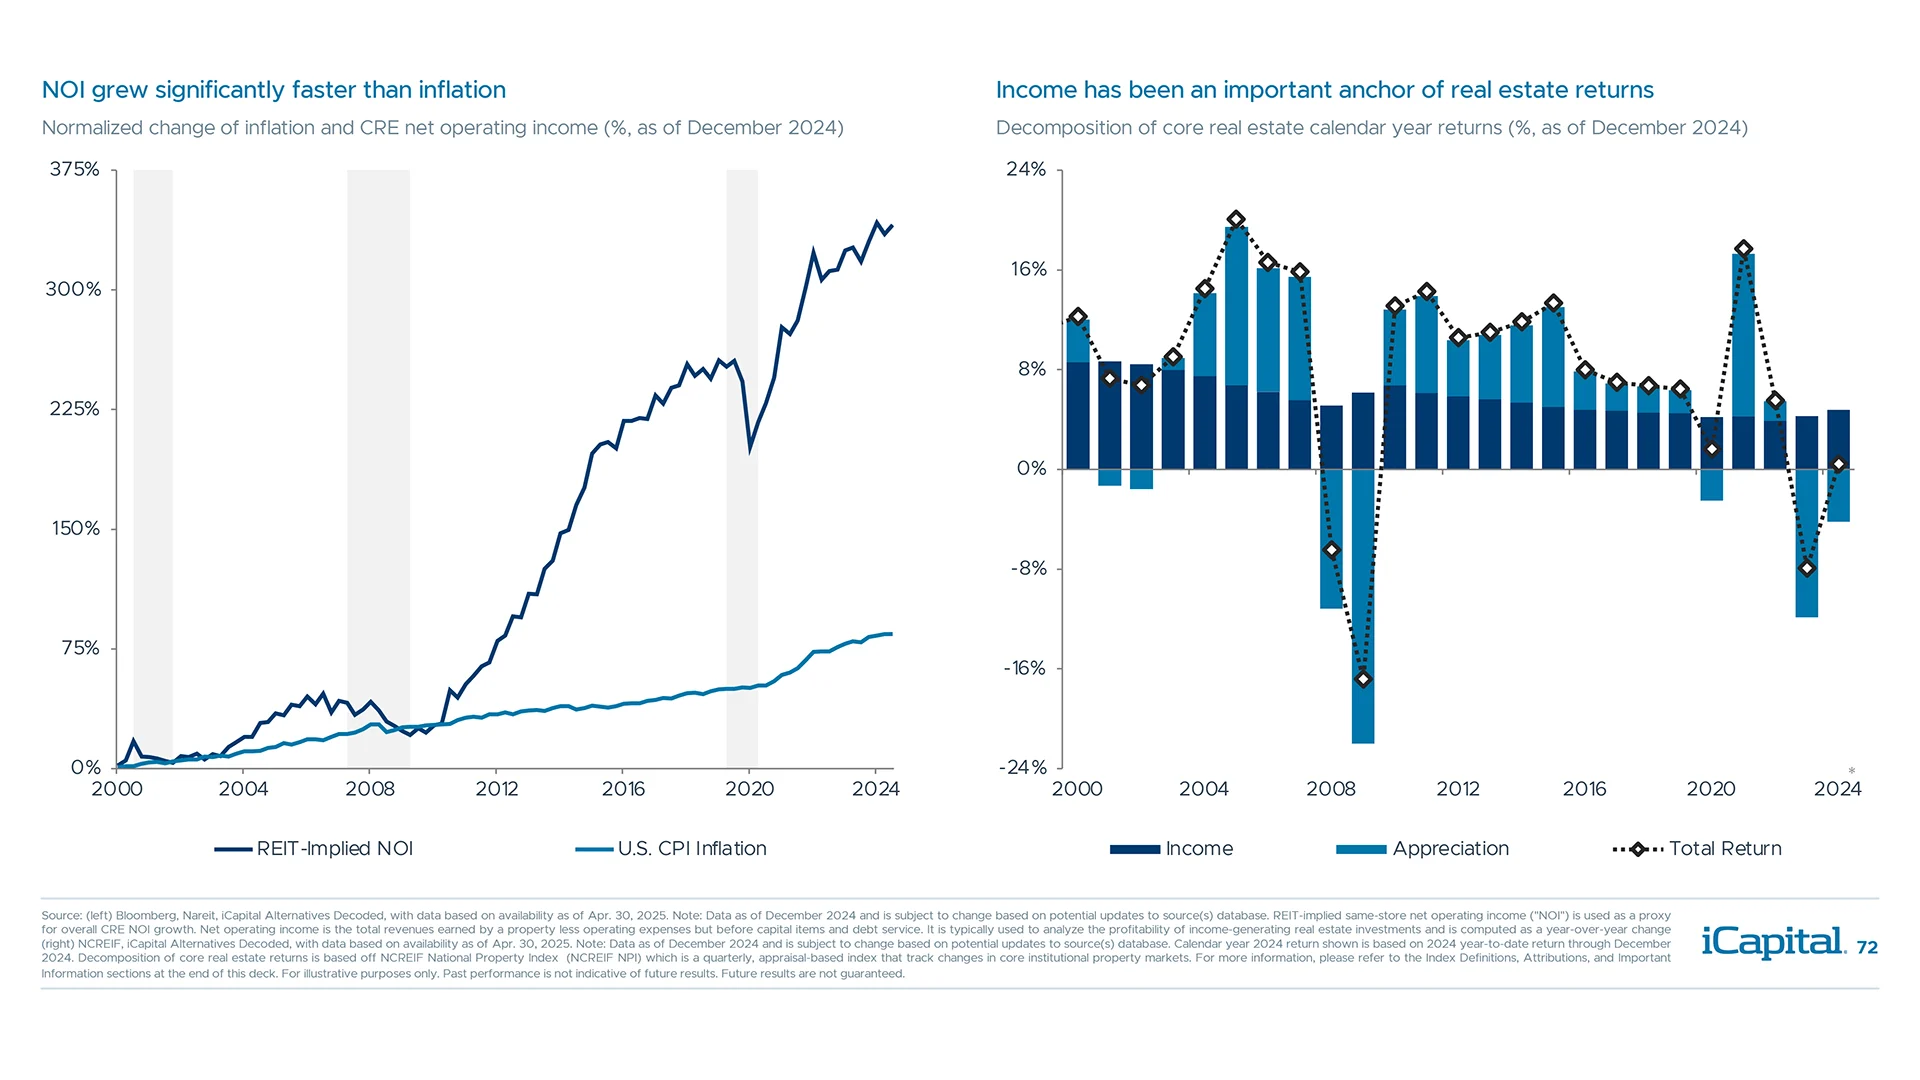
Growth in net operating income (NOI) has outpaced inflation and served as a core return driver
Transaction volumes are recovering, should help provide more realistic pricing in coming quarters

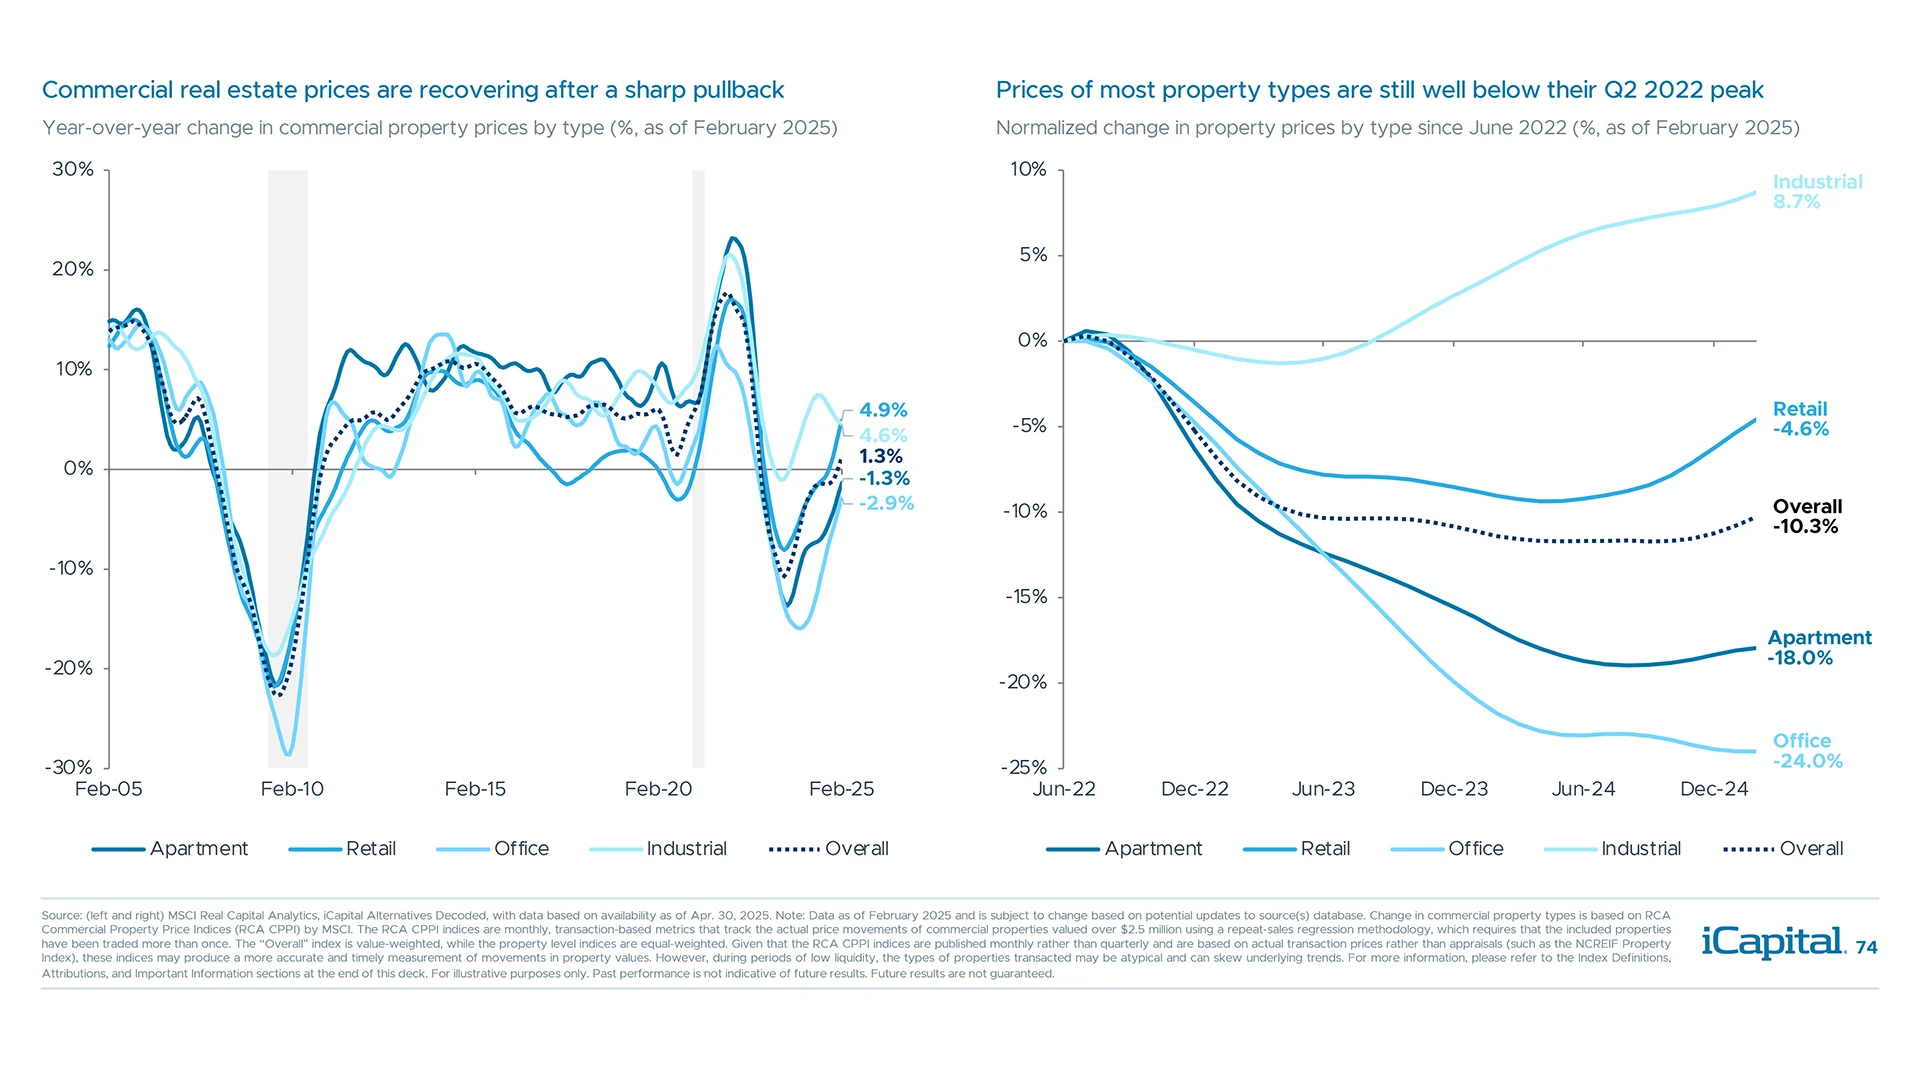
Commercial real estate prices corrected sharply, but the recovery process is underway
Cap rates reset higher as the Fed raised interest rates, but remain low relative to bond yields

NOI growth is slowing from high levels but is still roughly above long-term averages and inflation

Value-add funds can help improve NOI given the growing need to improve aging structures

Supply and demand dynamics remain relatively healthy and should also support NOI
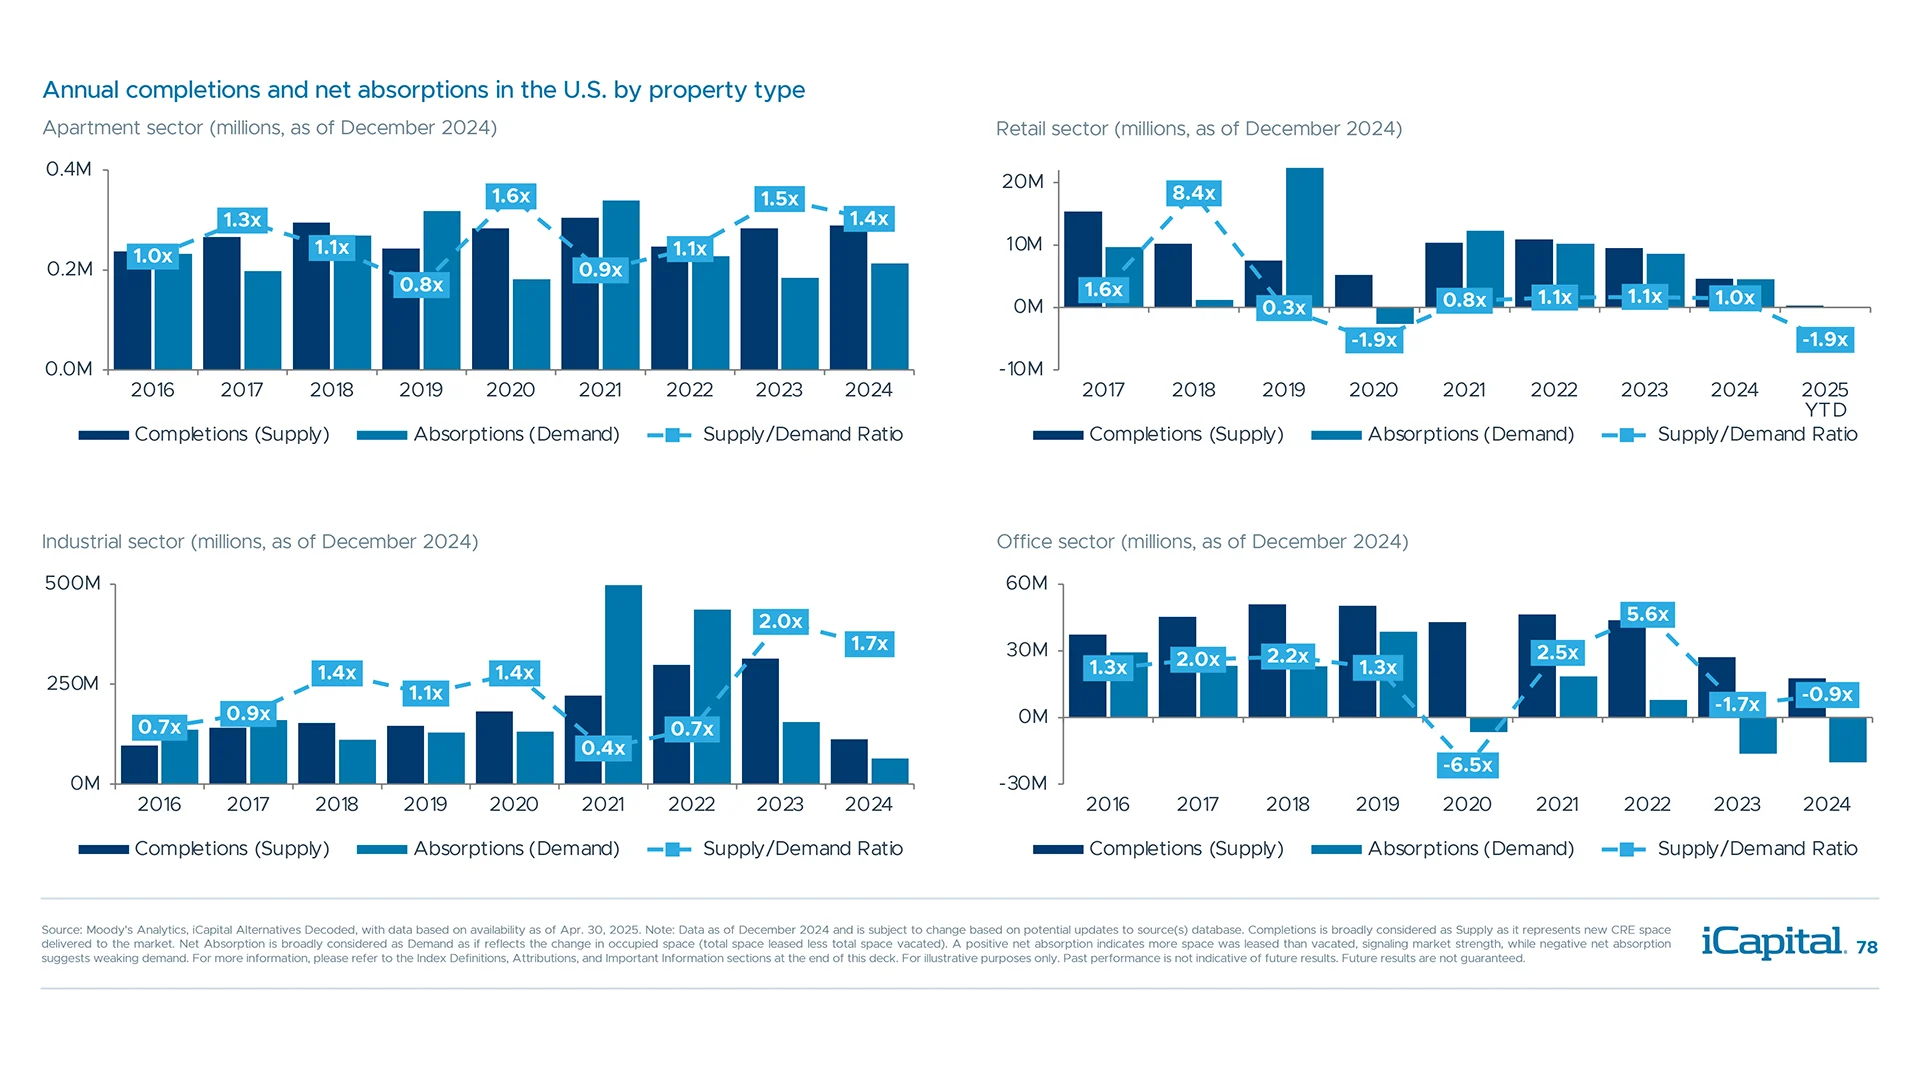
Most CRE sectors have solid fundamentals, except for office where weakness persists

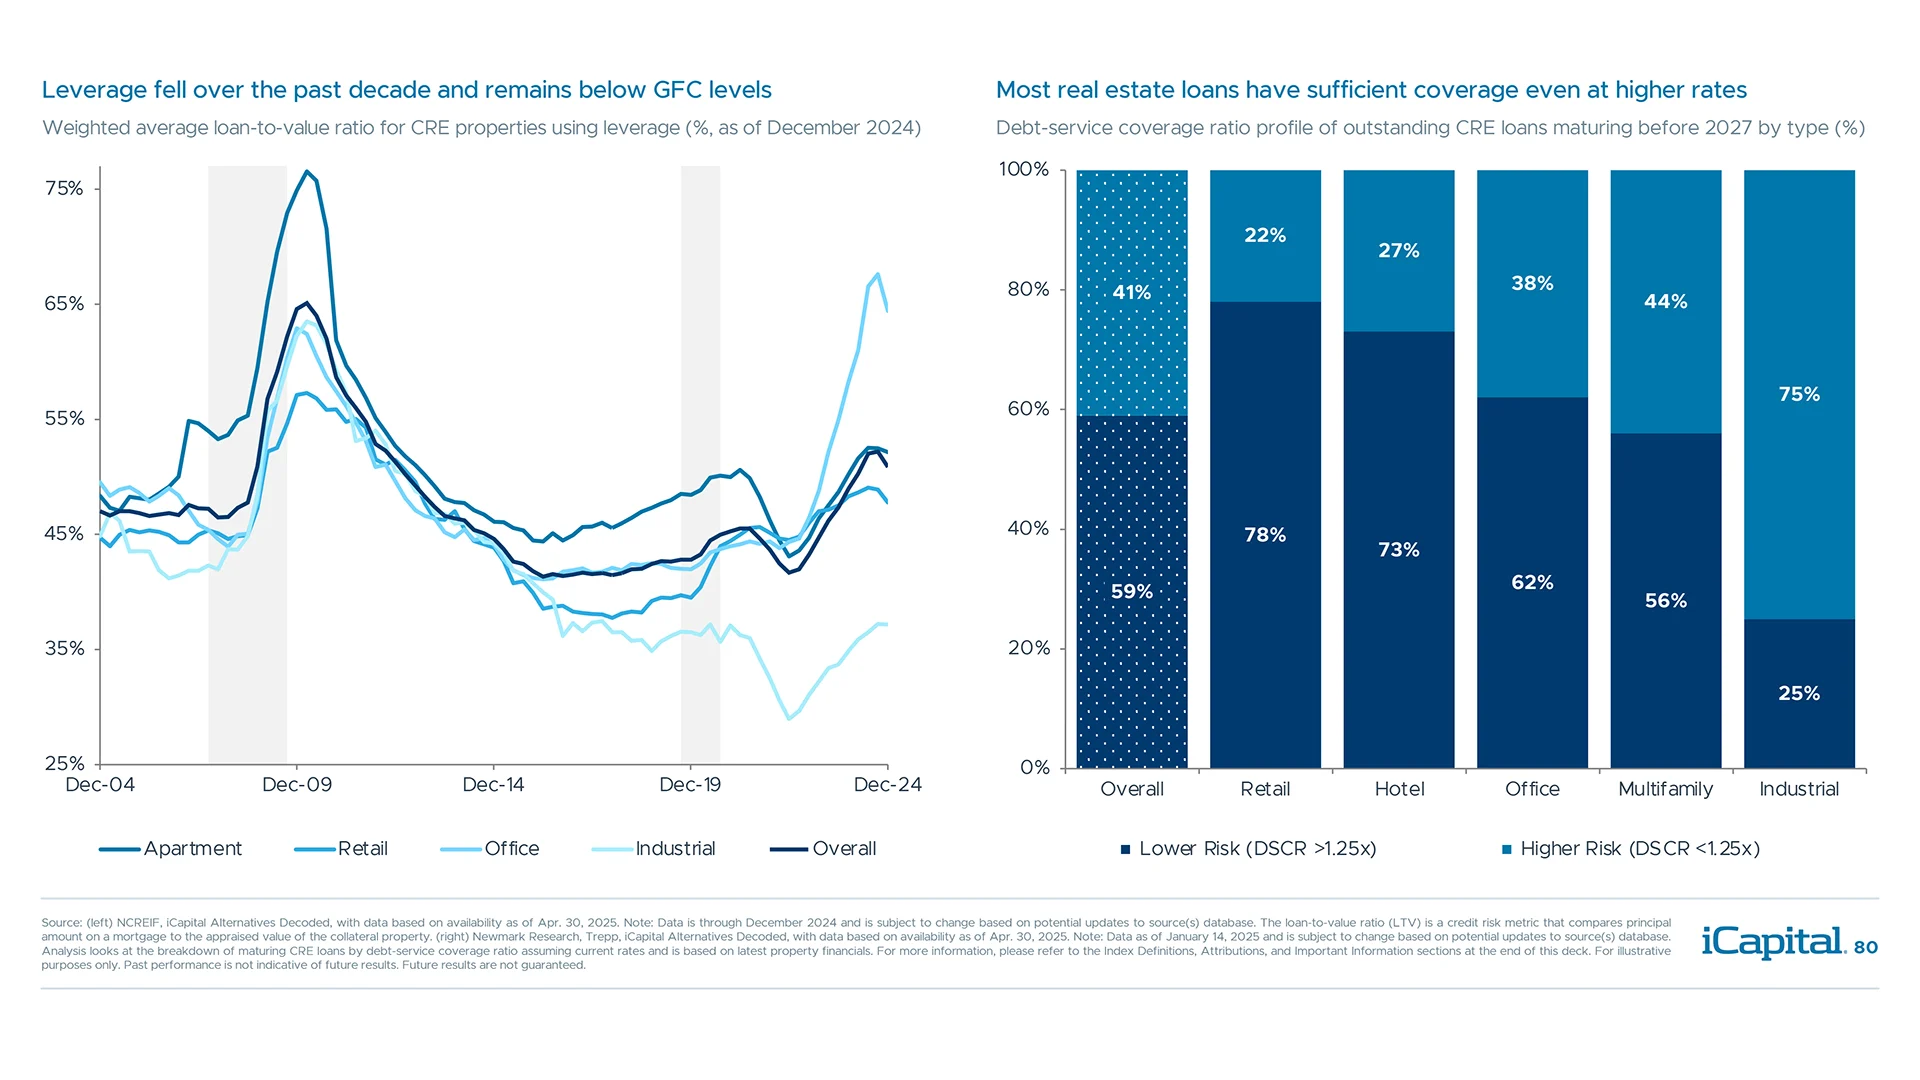
Lower use of leverage and higher debt coverage ratios offset some of these concerns
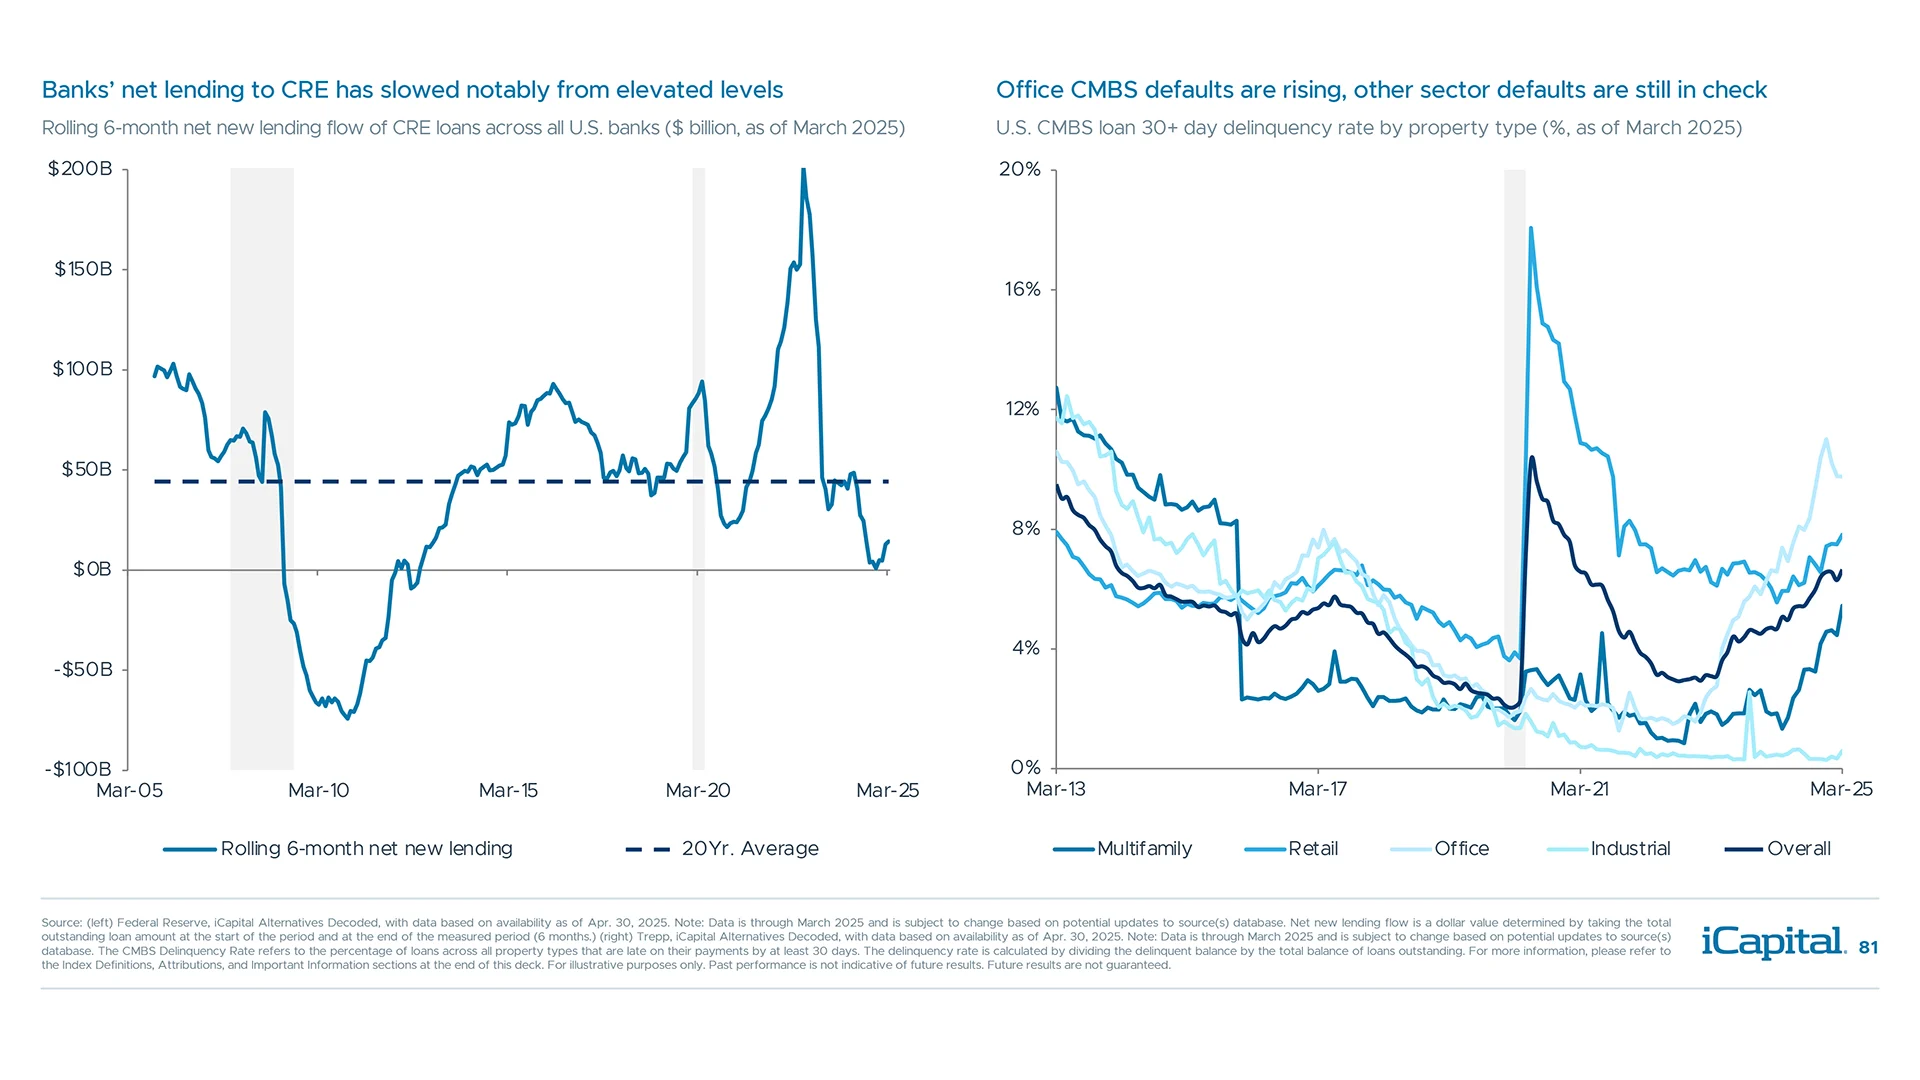
Banks are still retrenching from commercial real estate lending amidst rising defaults
CRE debt funds with ample dry powder should help partially fill the void


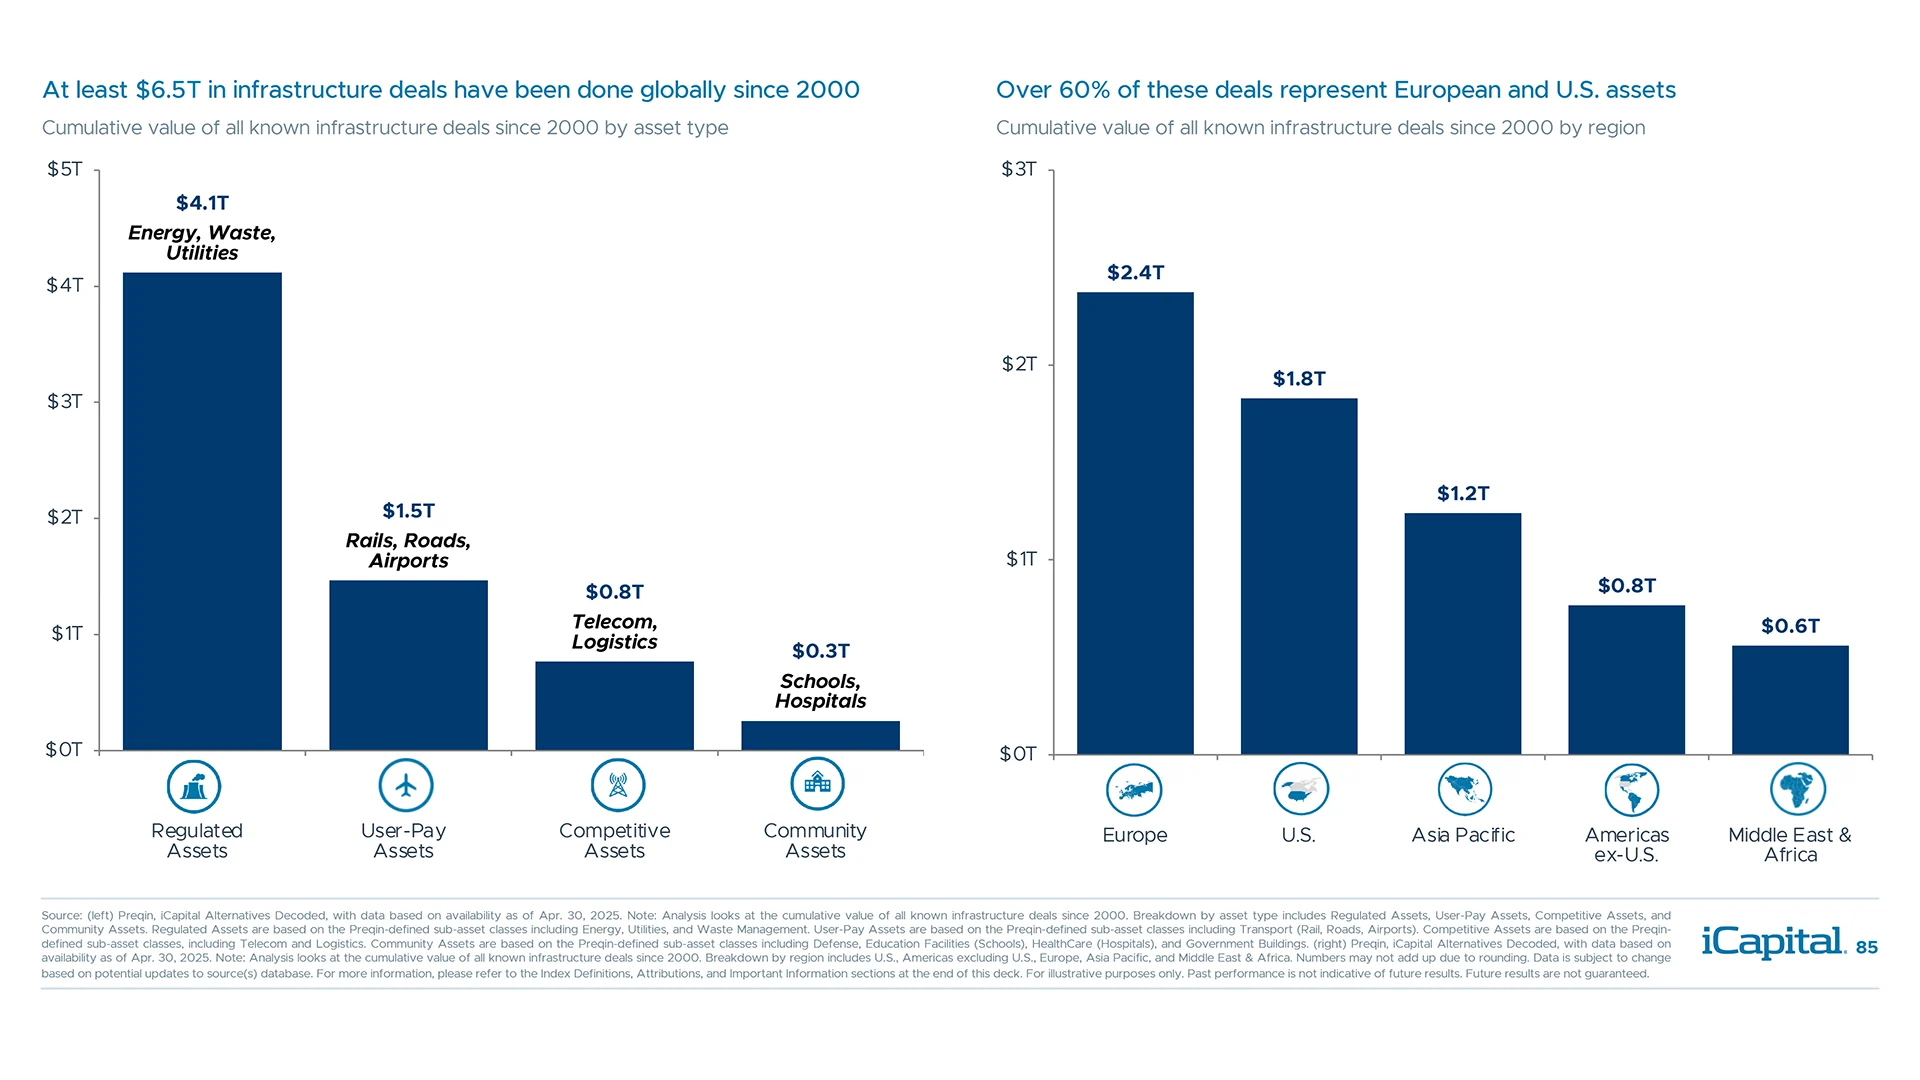
Infrastructure is a globally diverse asset class with significant fund assets in Europe

Investors can consider four broad categories of infrastructure with varying characteristics
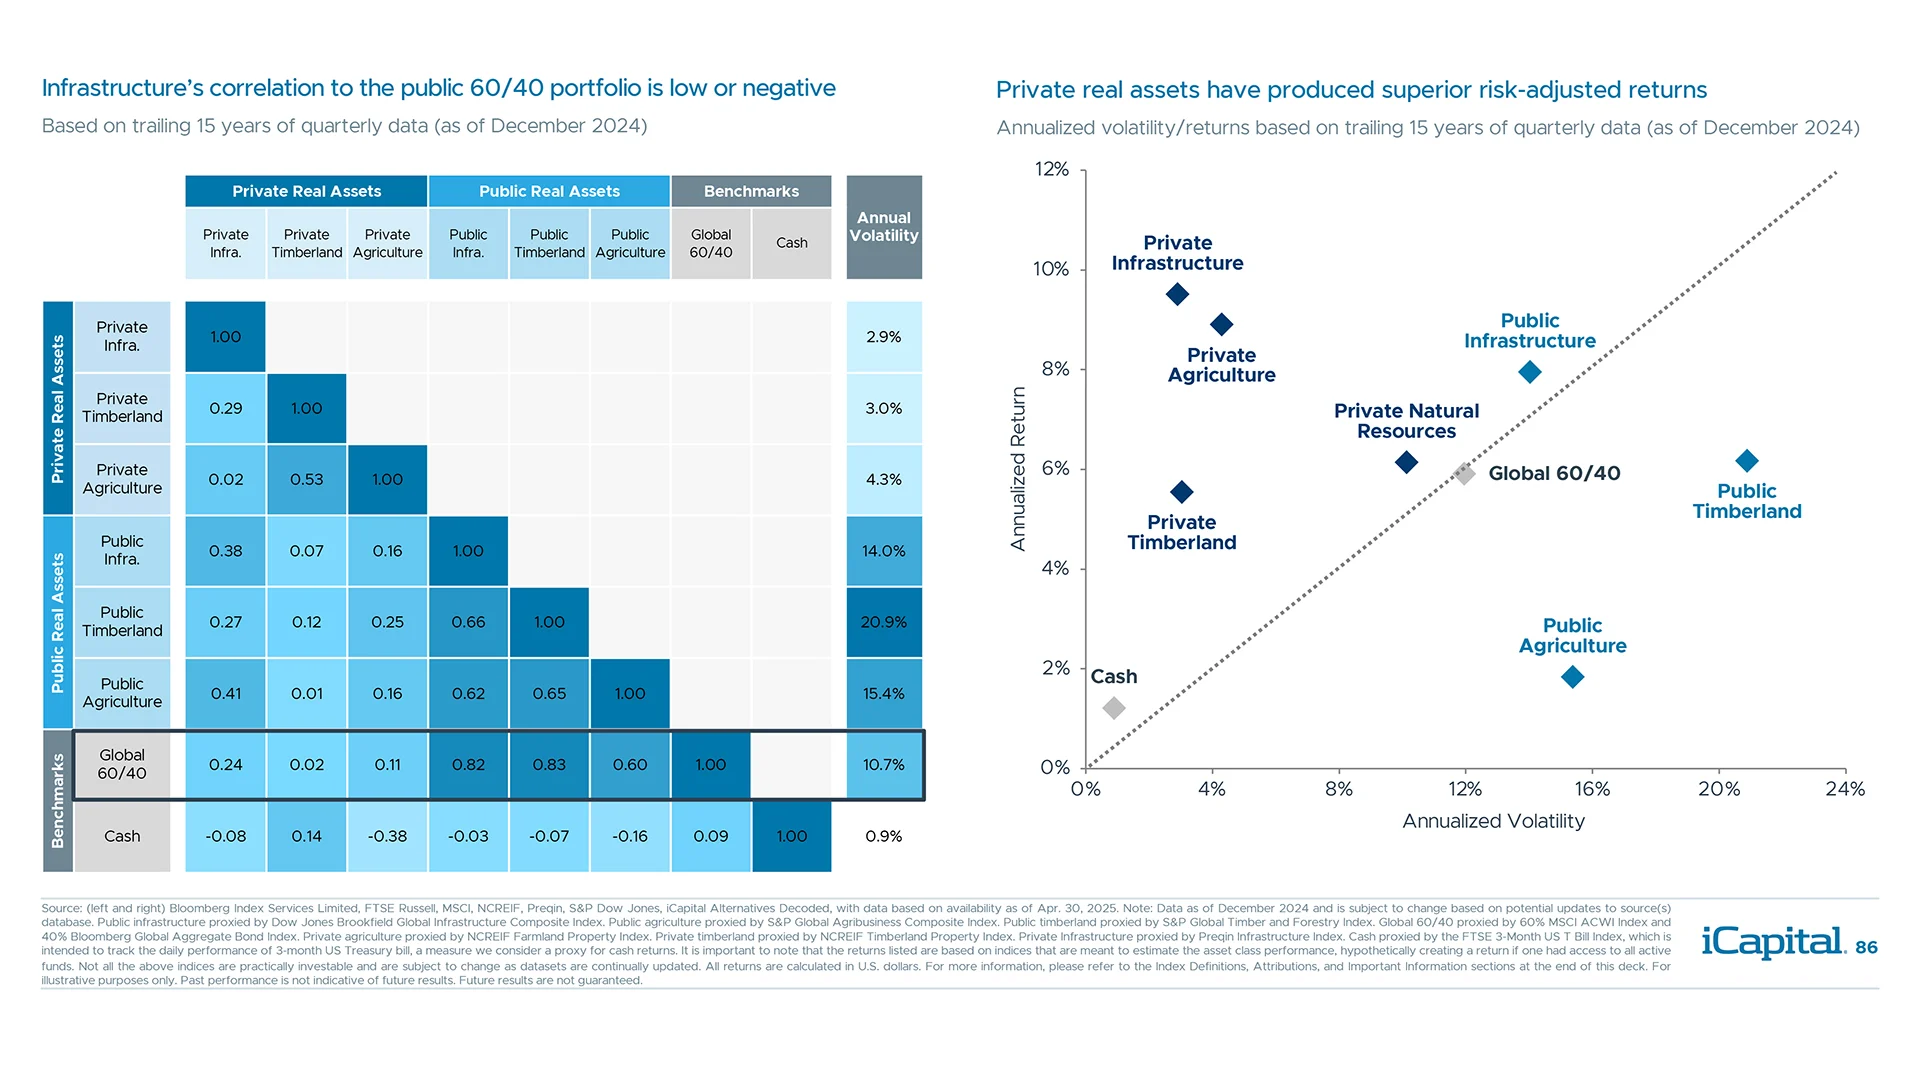
Private real assets have produced superior risk-adjusted returns with low correlation
Real assets have delivered returns outpacing developed market inflation

Real assets provided higher returns during periods of moderate to high inflation

Global economies are set to spend $3.2 trillion per year on infrastructure through 2040

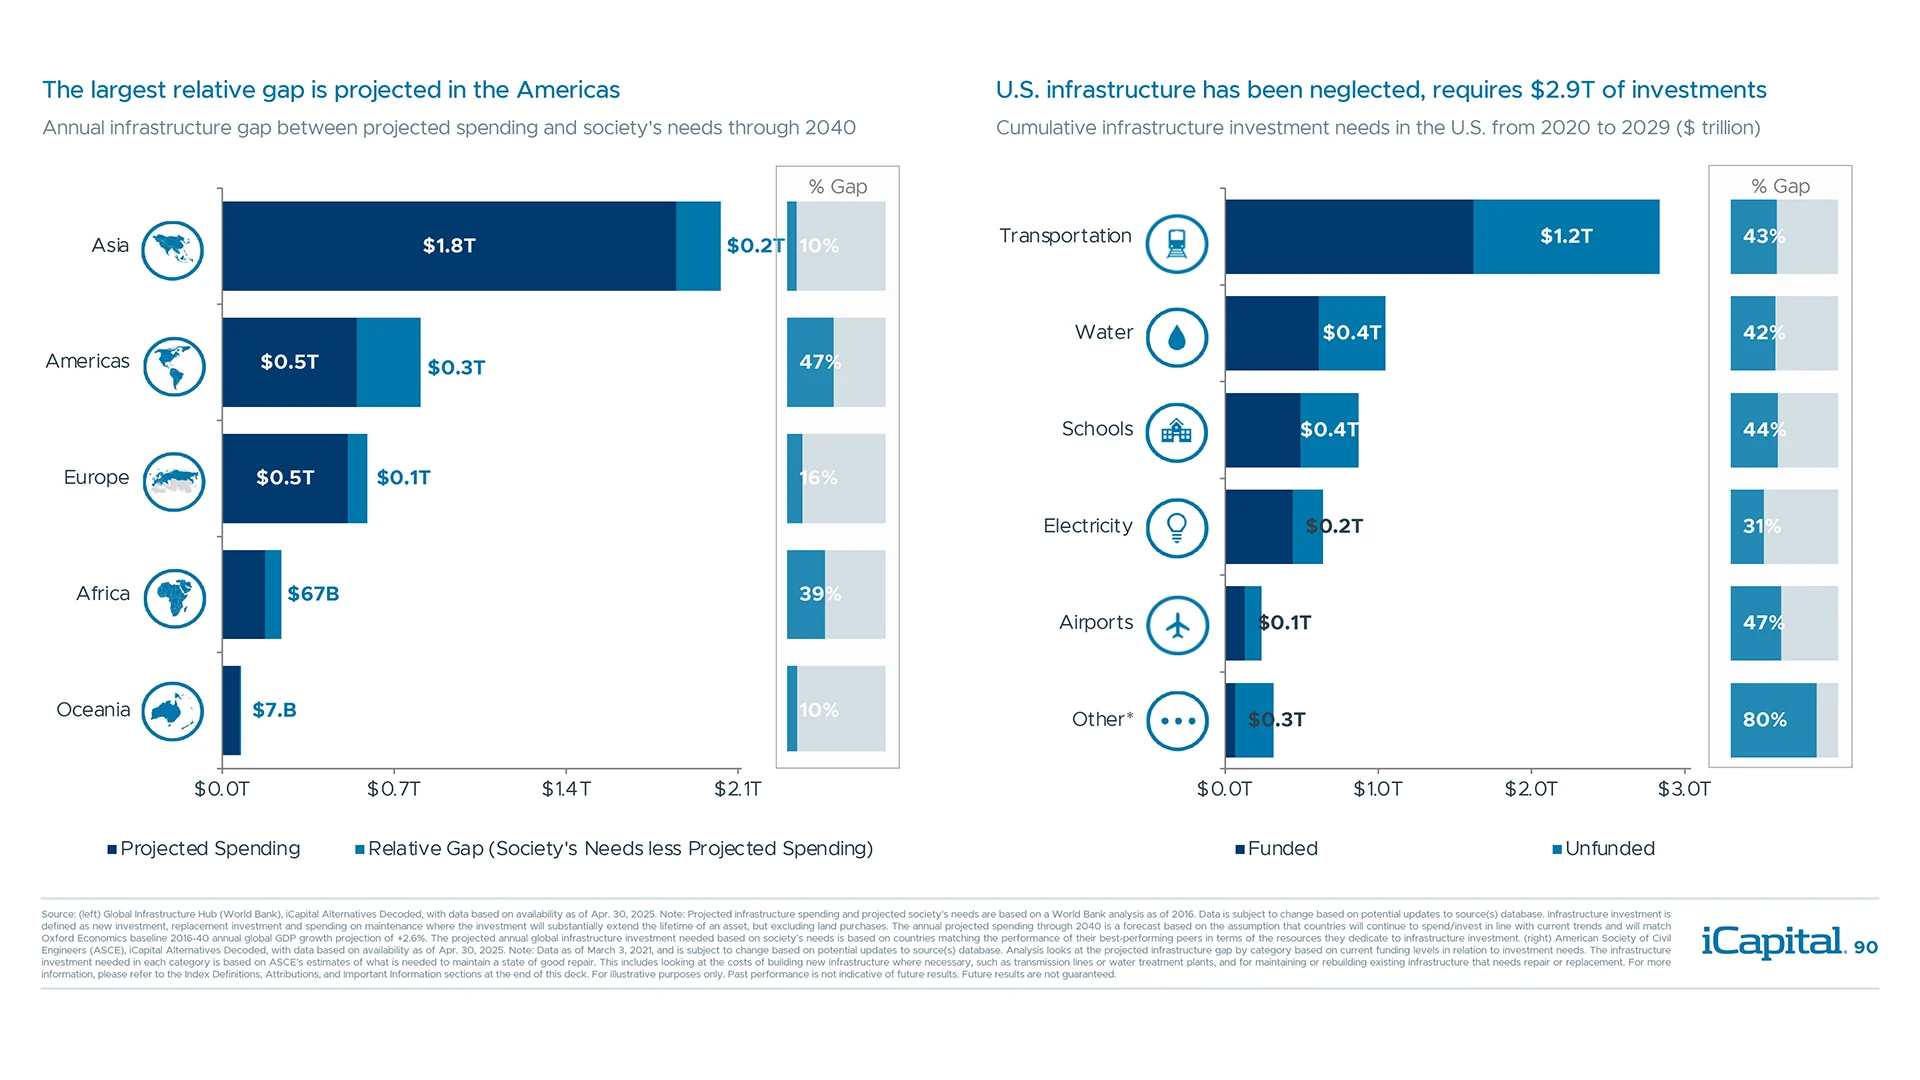
There is a widening gap between projected infrastructure spending and society’s needs
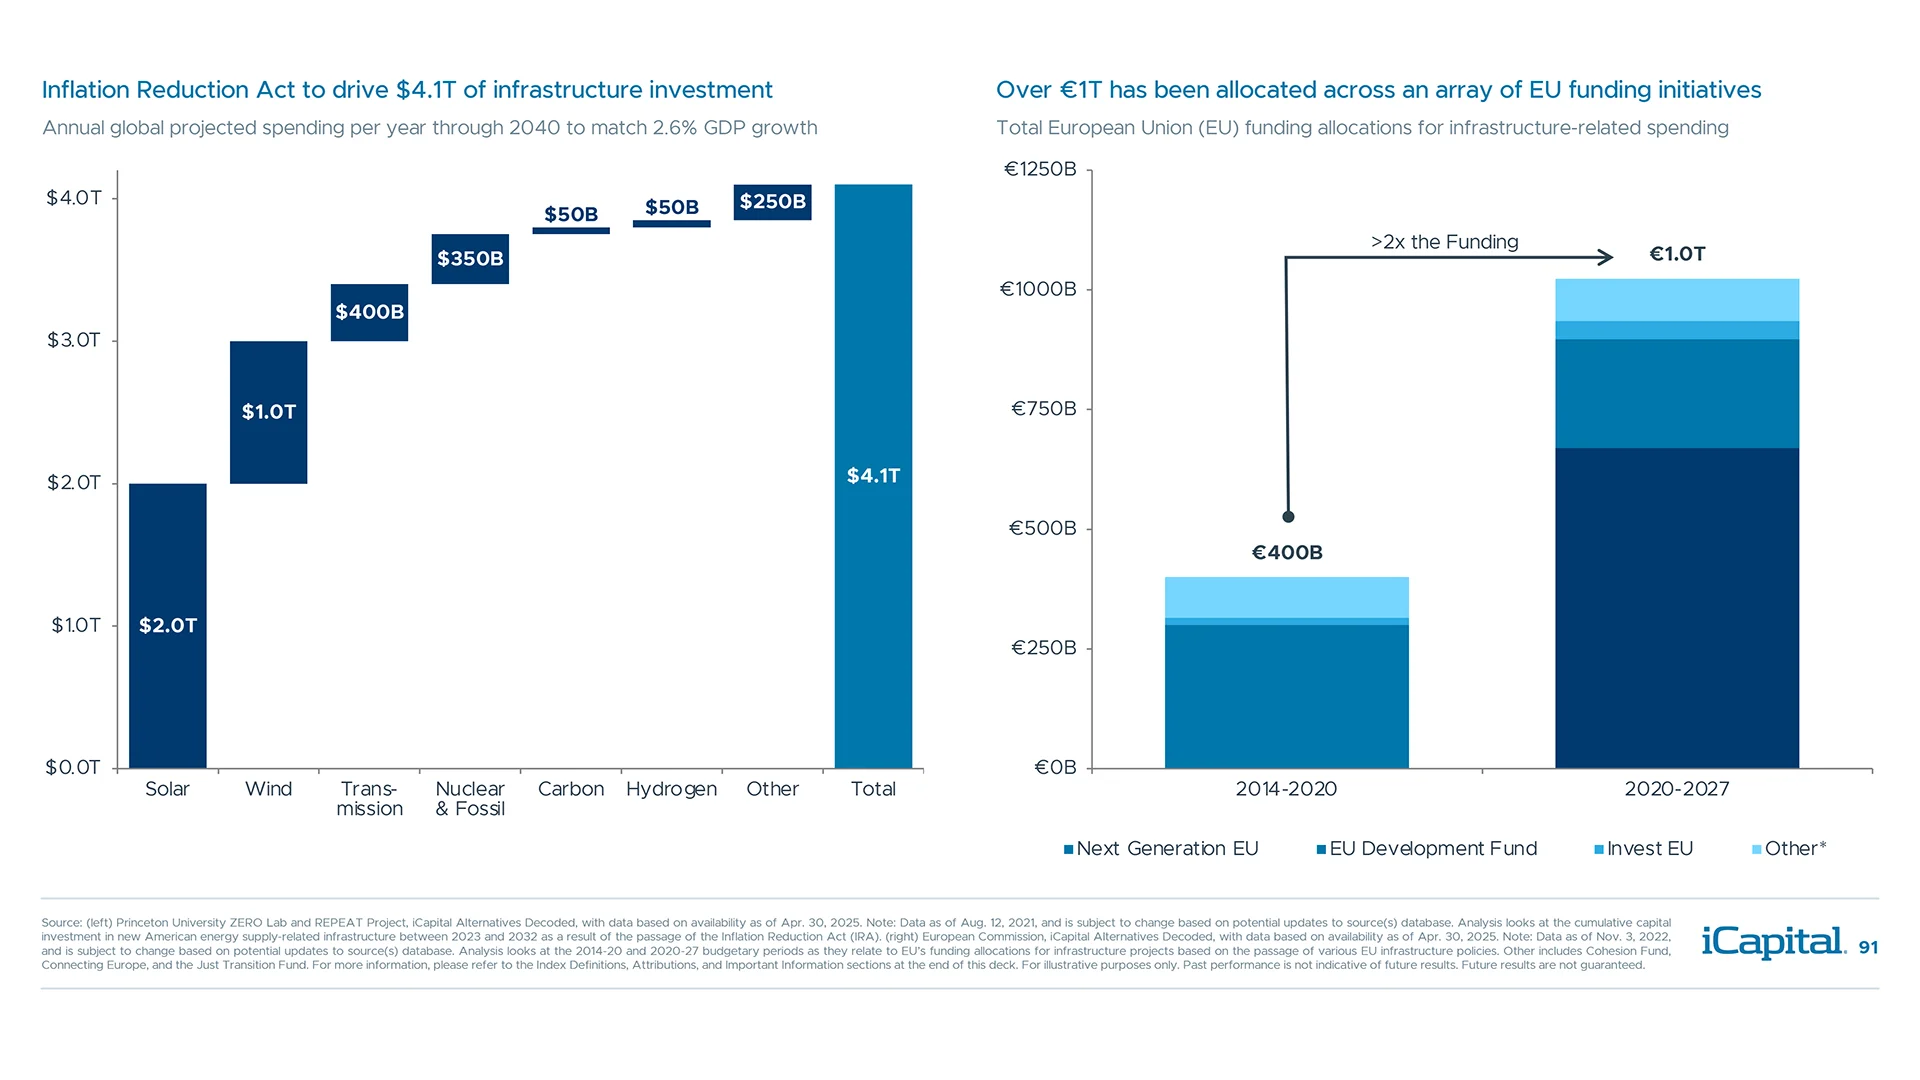
U.S. and Europe have significantly stepped up their infrastructure-related investments
Digitization and growth in data centers is one of the prominent themes in infrastructure
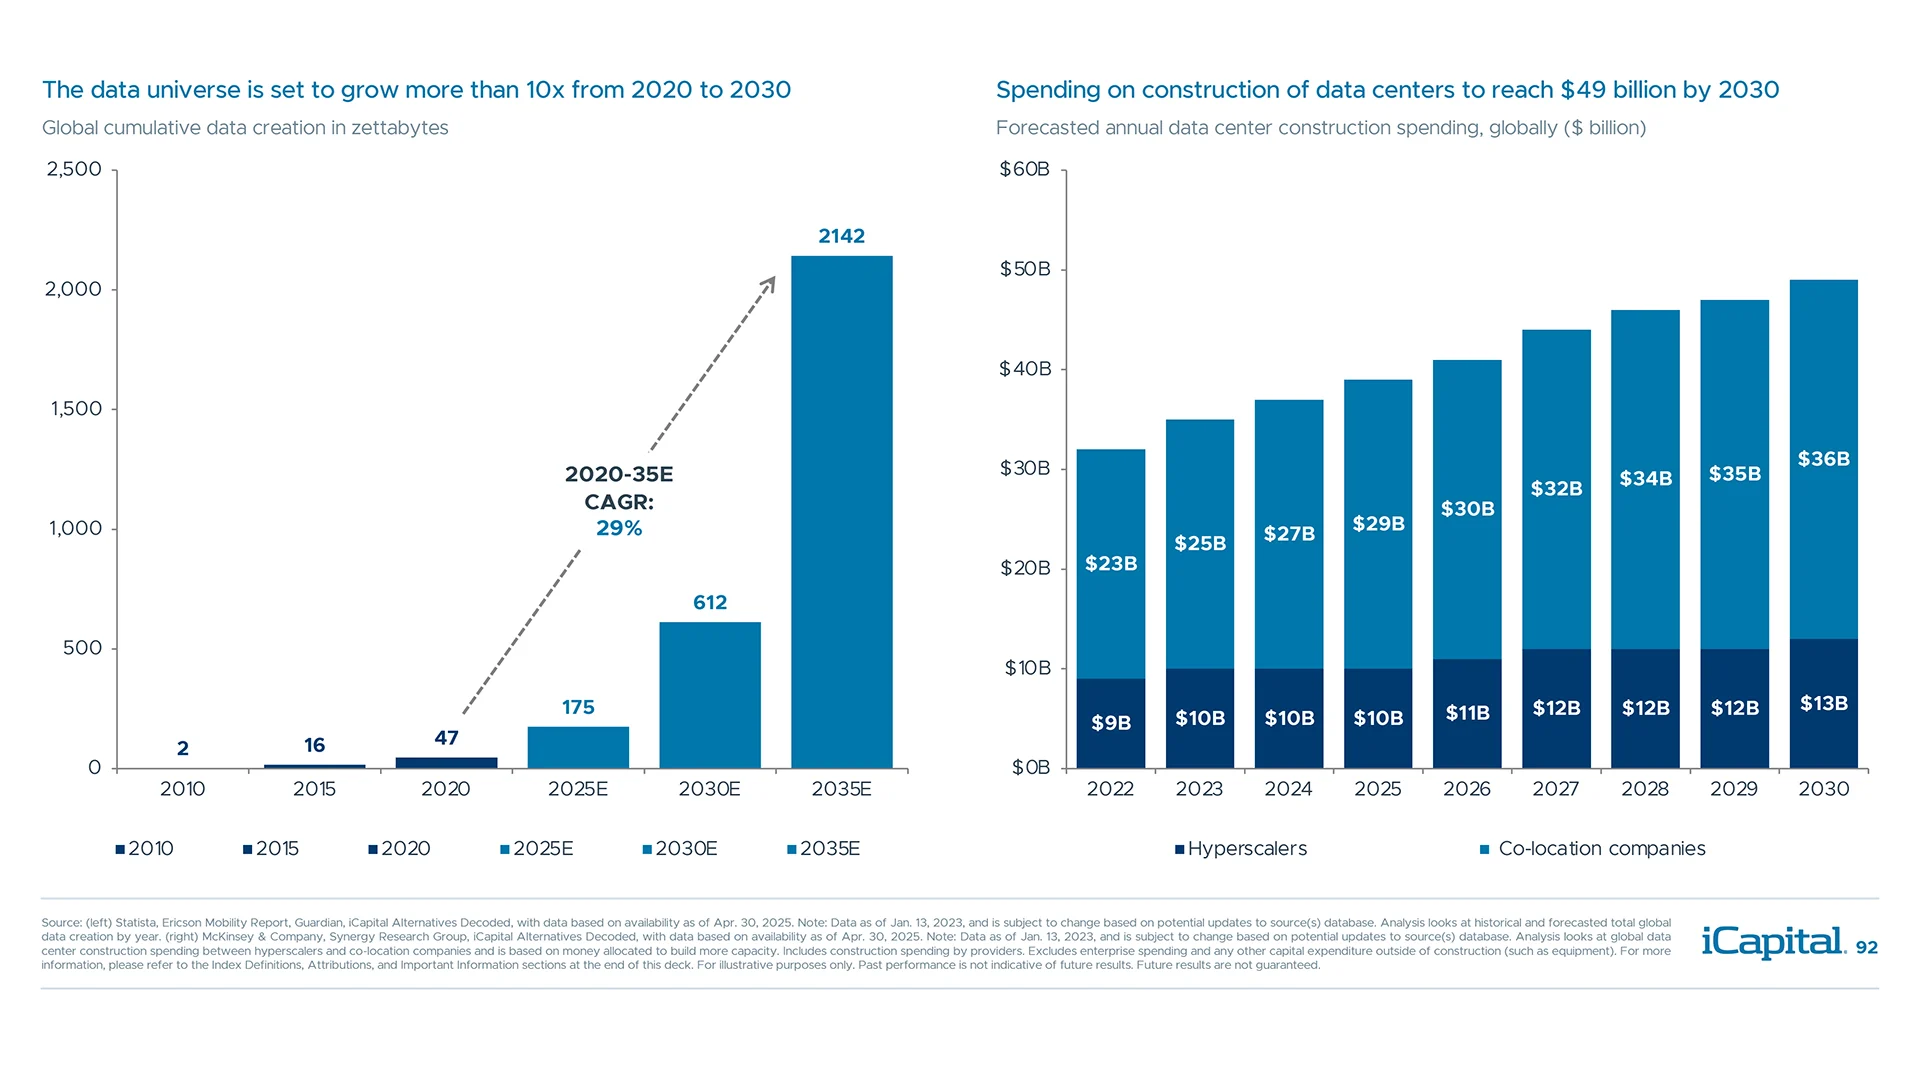
The investment need for additional decarbonized power generation is growing


Hedge fund AUM has rebounded and has hovered near record levels

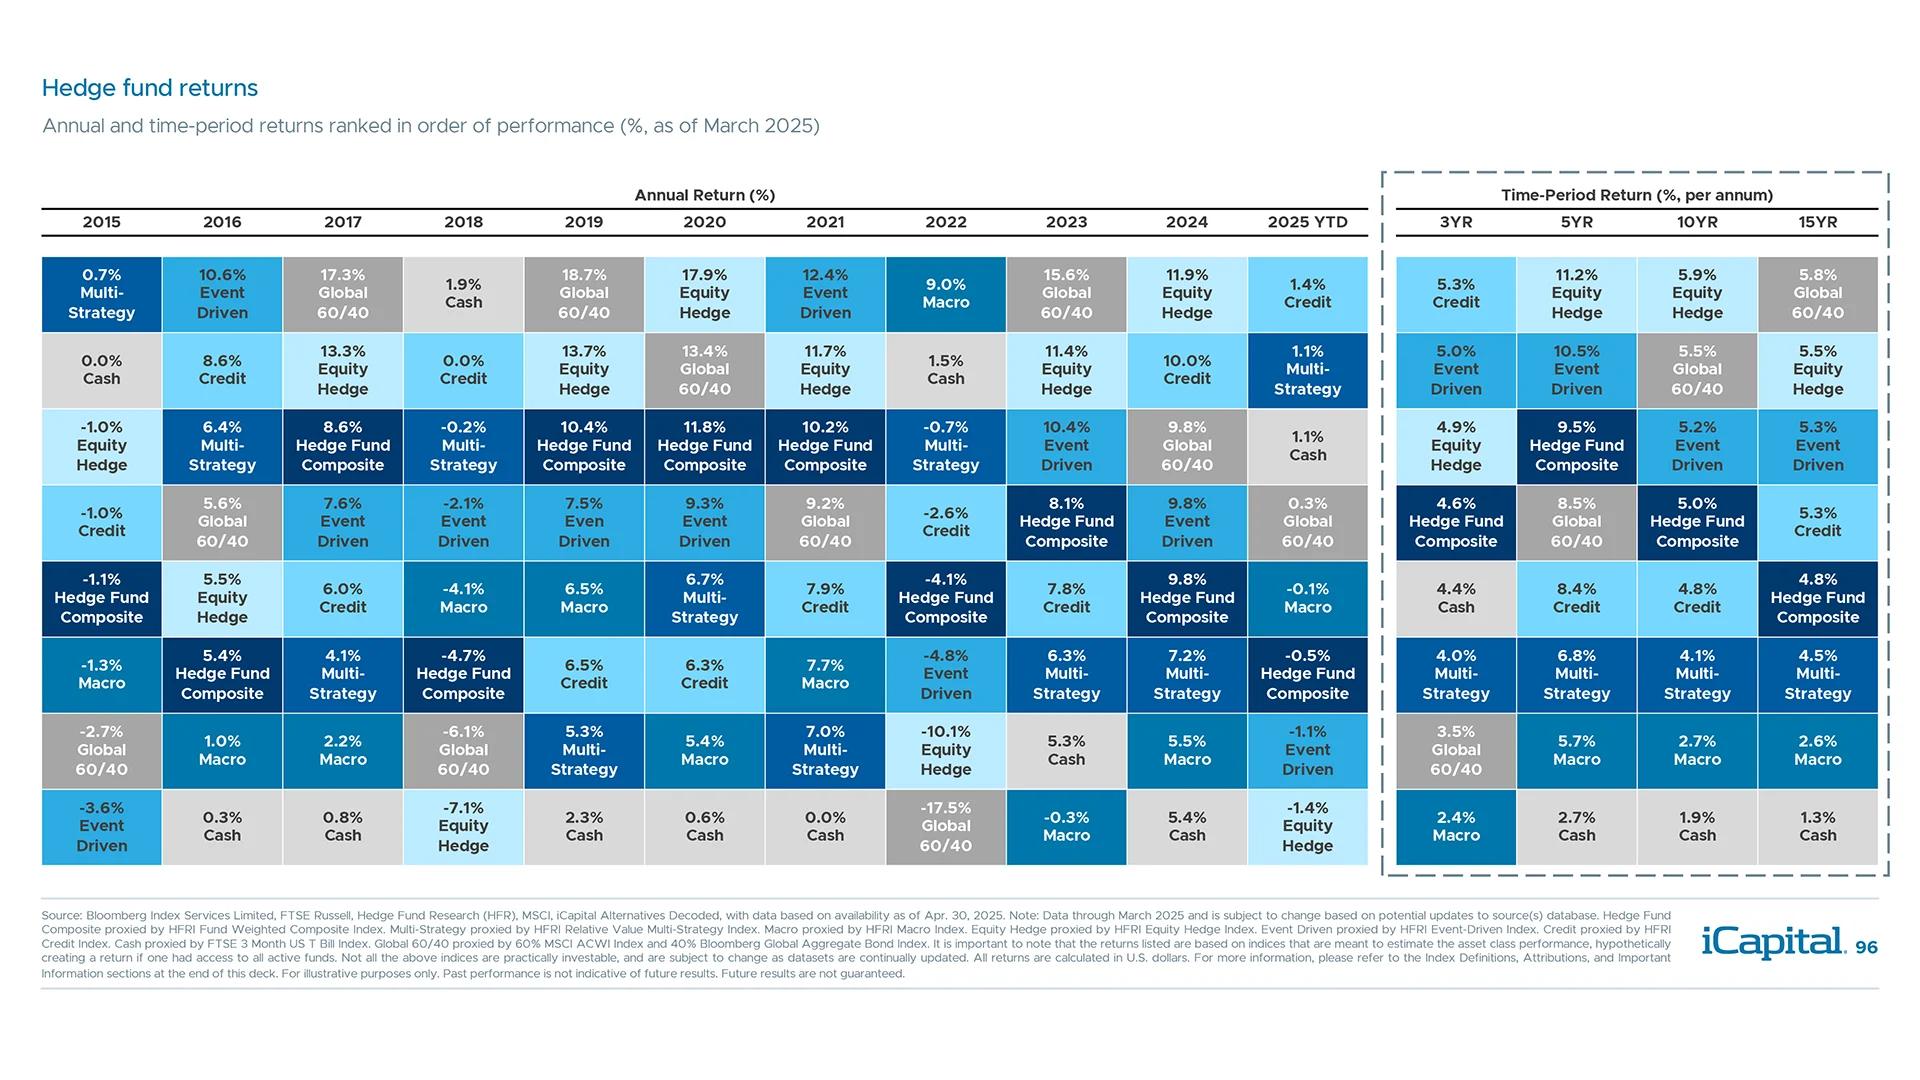
Different hedge fund strategies can help position for various market conditions
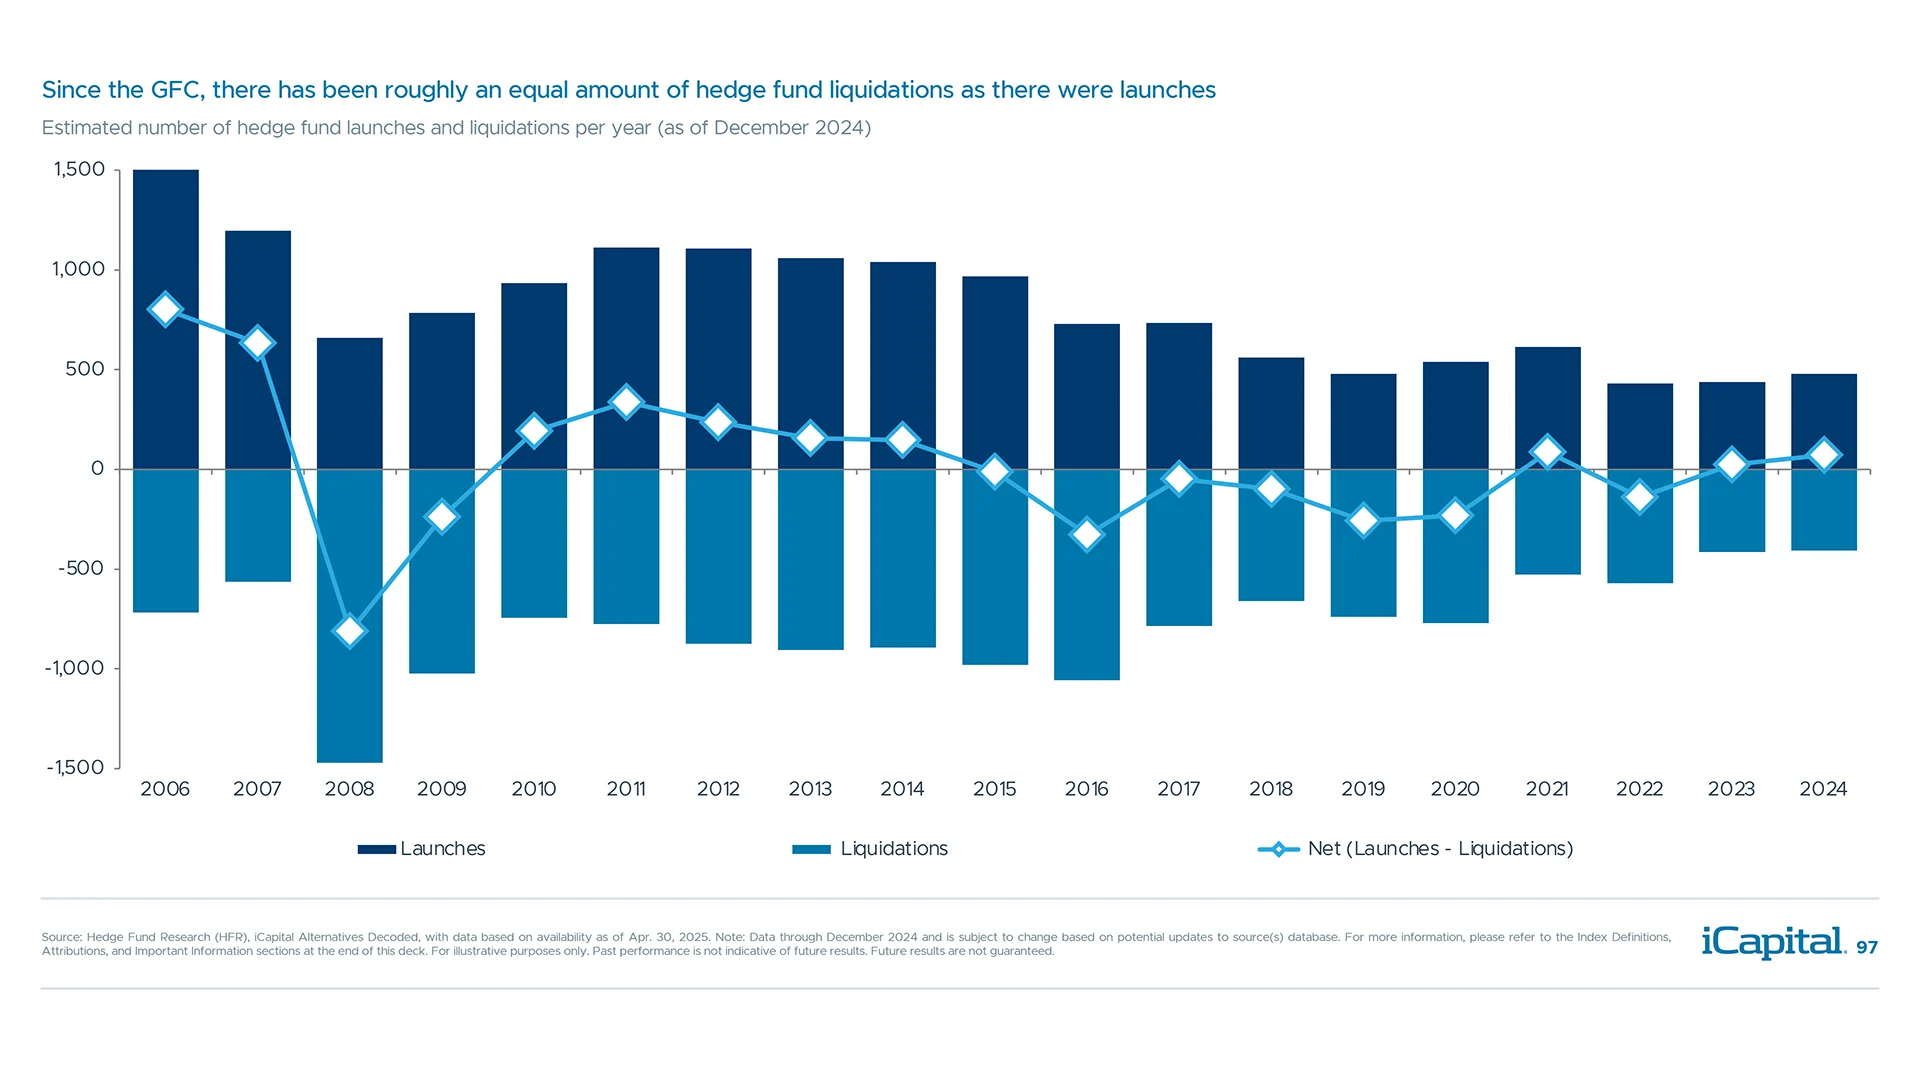
Similar number of hedge fund launches and liquidations highlight selection importance
Traditional 60/40 portfolio is not offering the “natural” diversification it use to, especially today

Historically, adding hedge funds to traditional portfolios has improved risk/return

Over time, hedge funds offer equity-like results with less downside risk

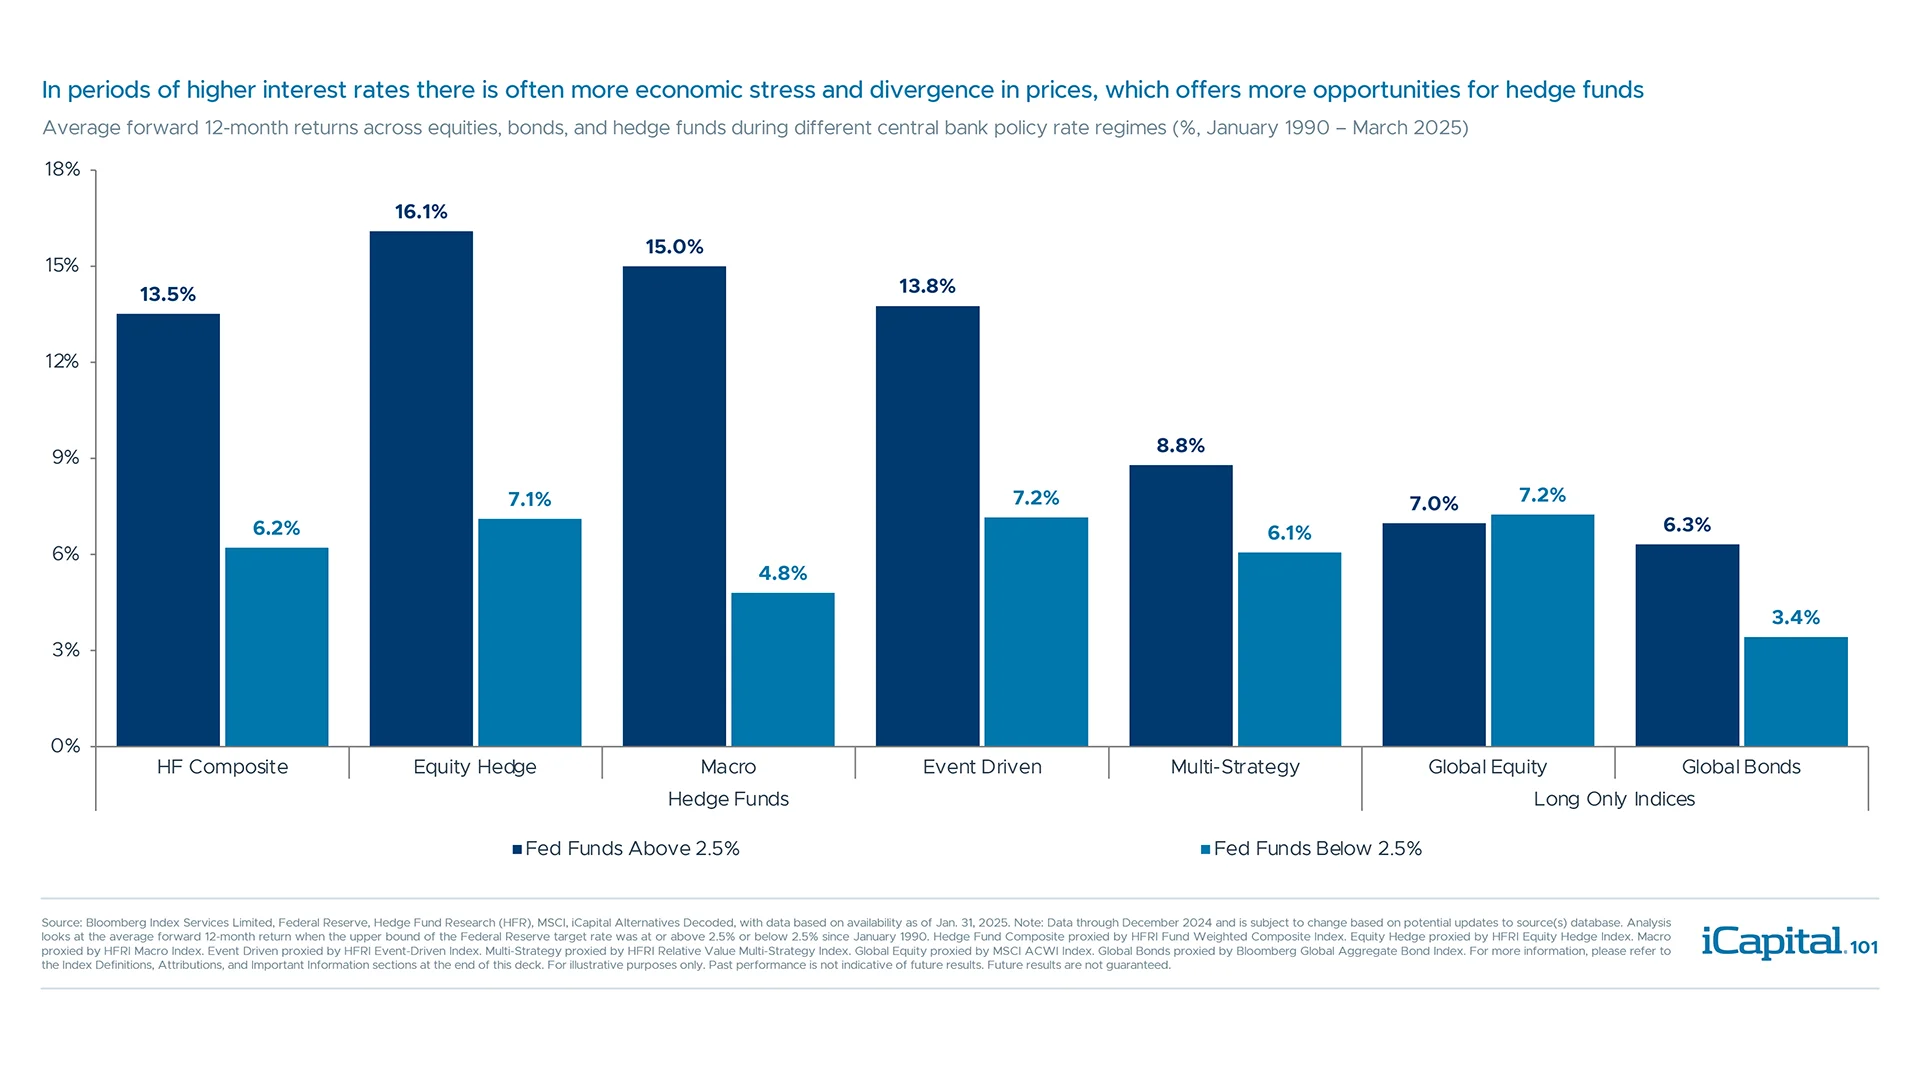
Hedge funds have generally performed better during periods of elevated rates
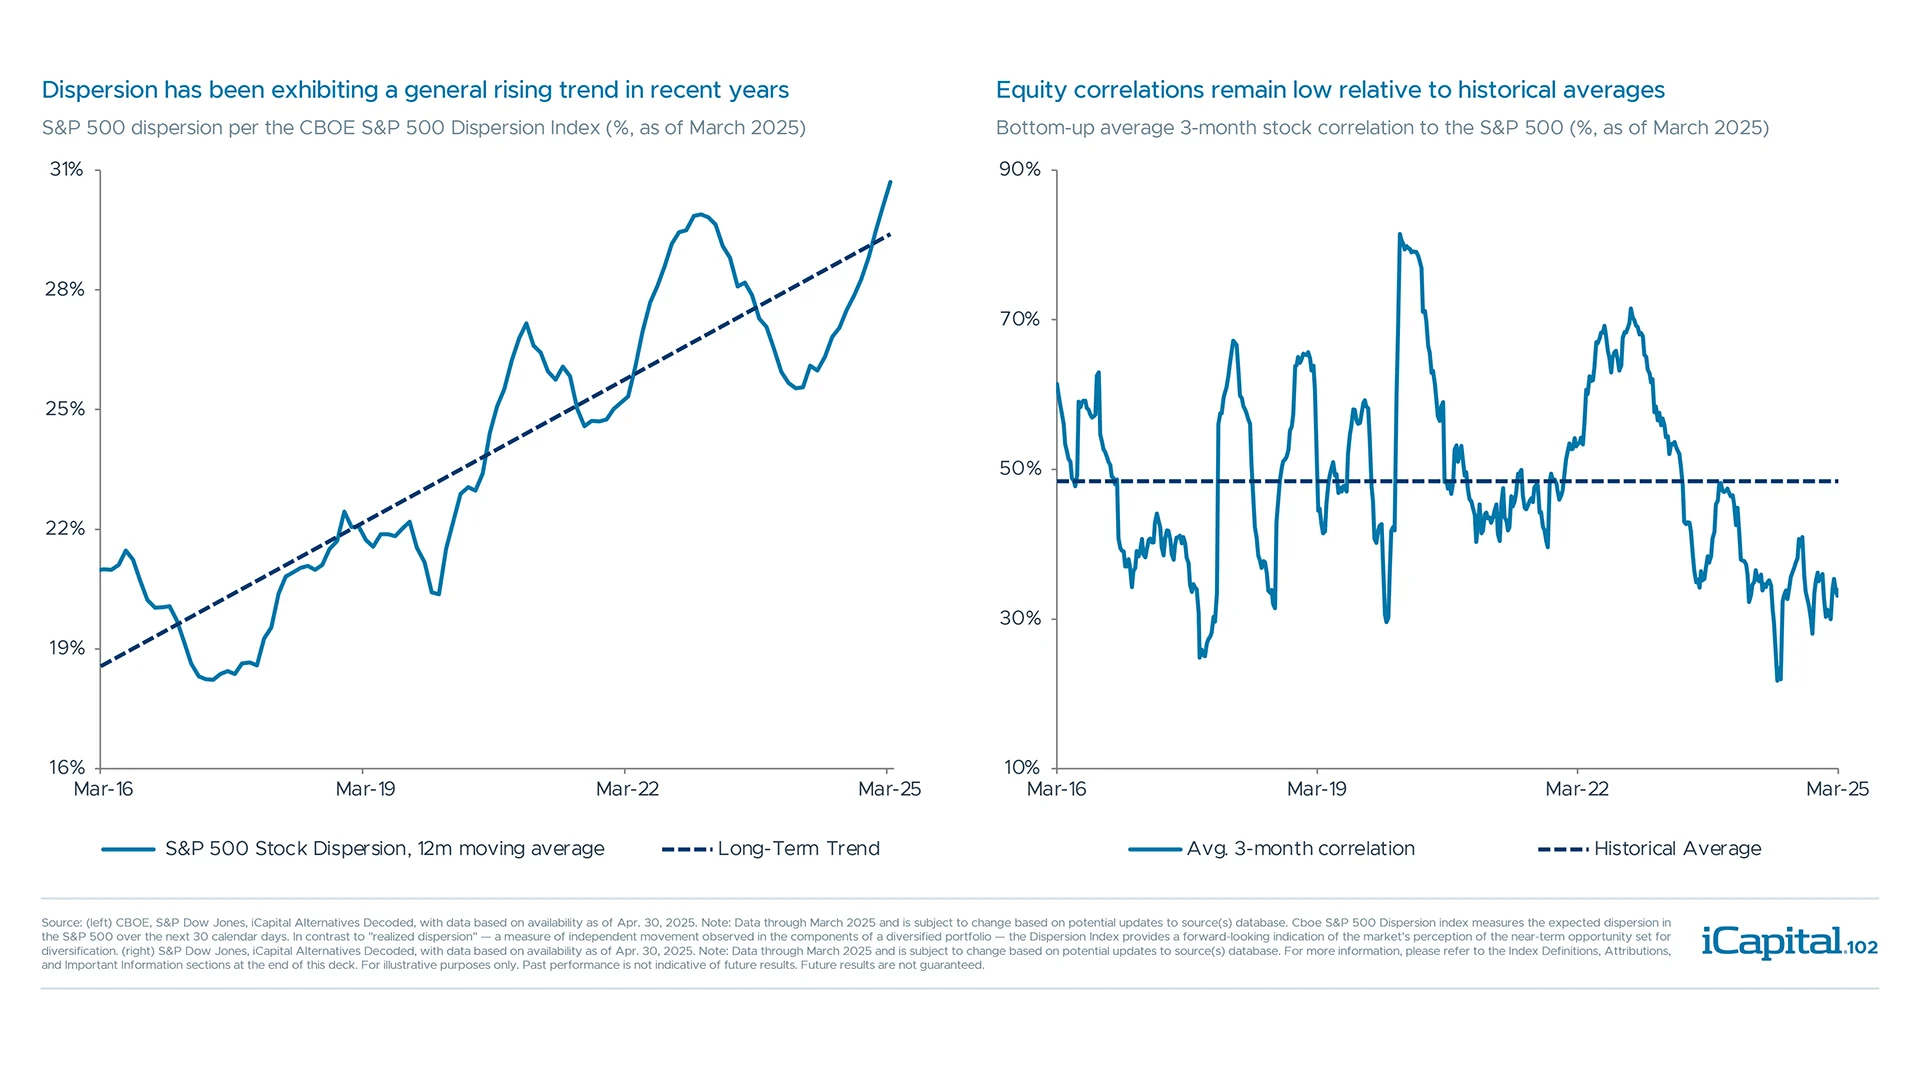
Hedge fund opportunities increase in periods of higher equity dispersion, low correlation
The recent widening in index spreads creates opportunities in distressed credit

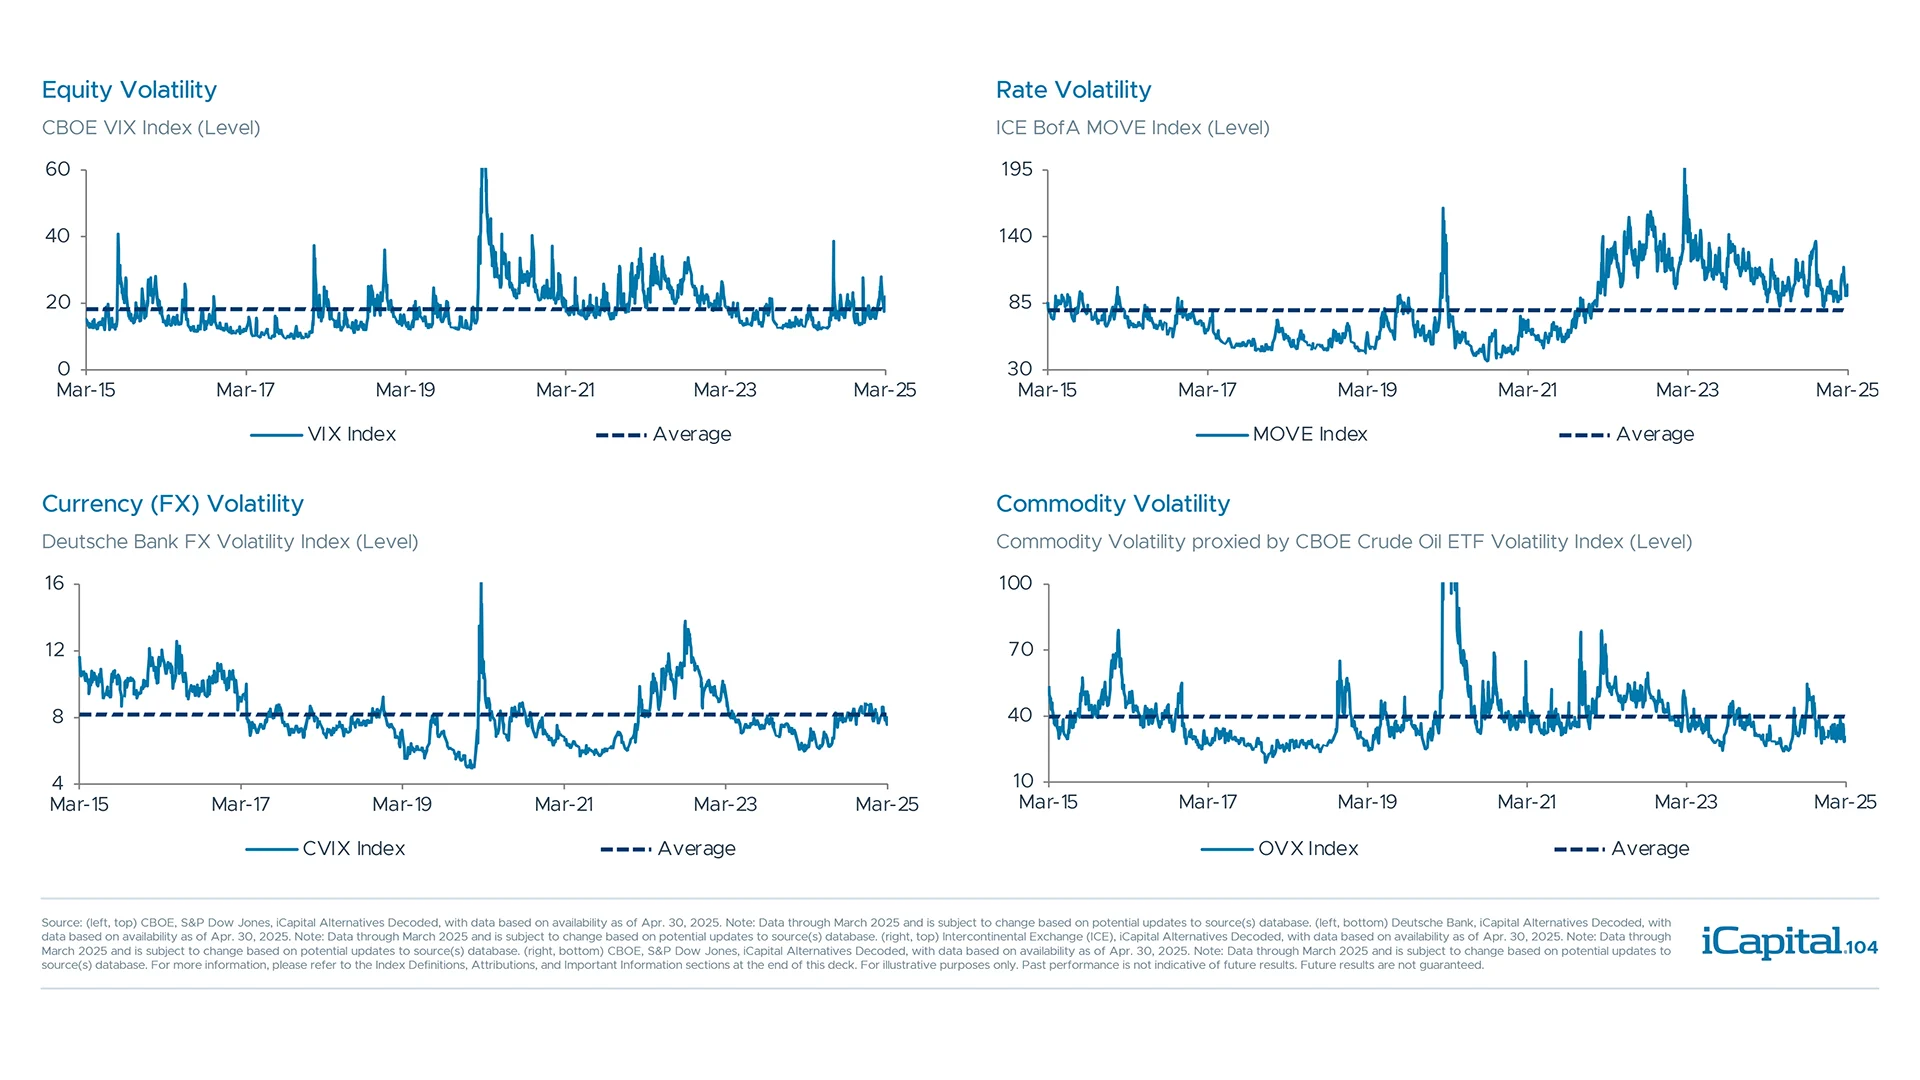
The recent spikes in volatility can be a driver of returns for hedge funds
Event Driven strategies may benefit from the expected pick-up in capital markets activity


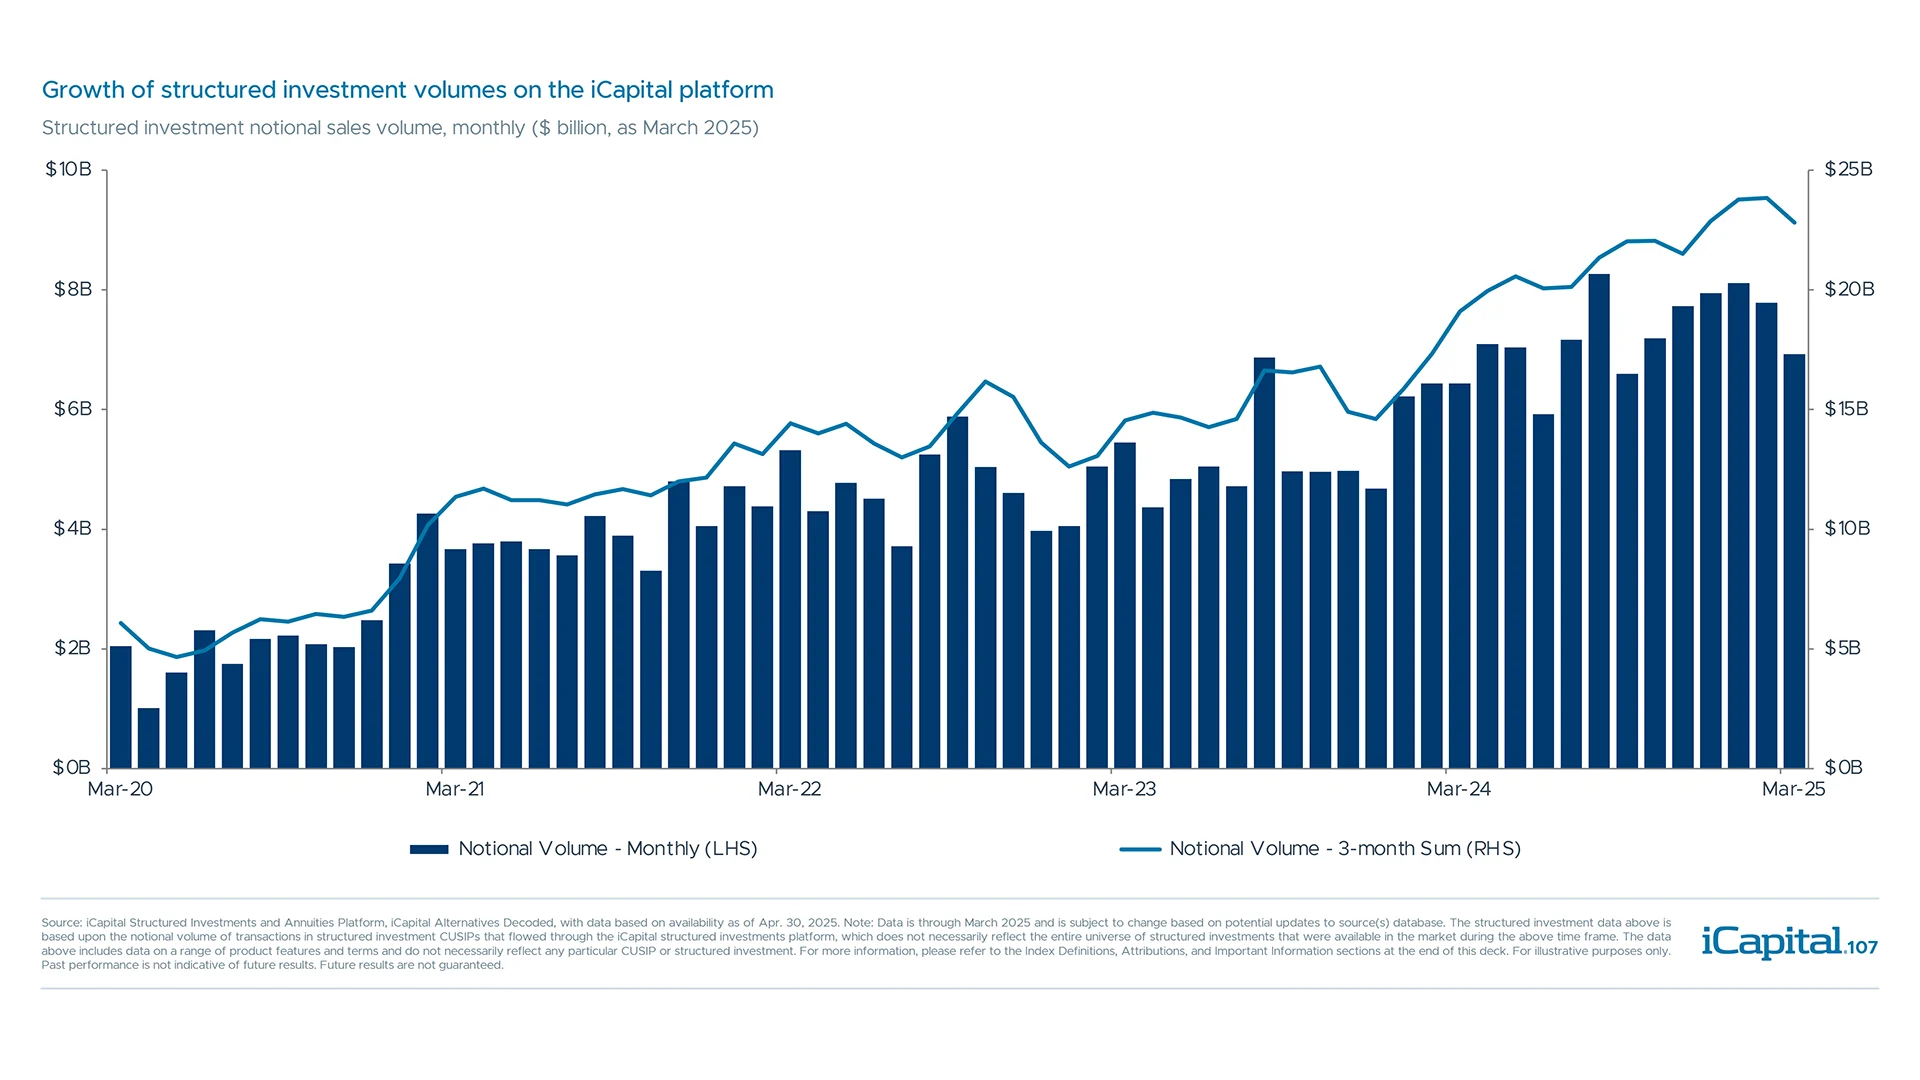
Structured investment volumes in the private wealth channel have grown over time
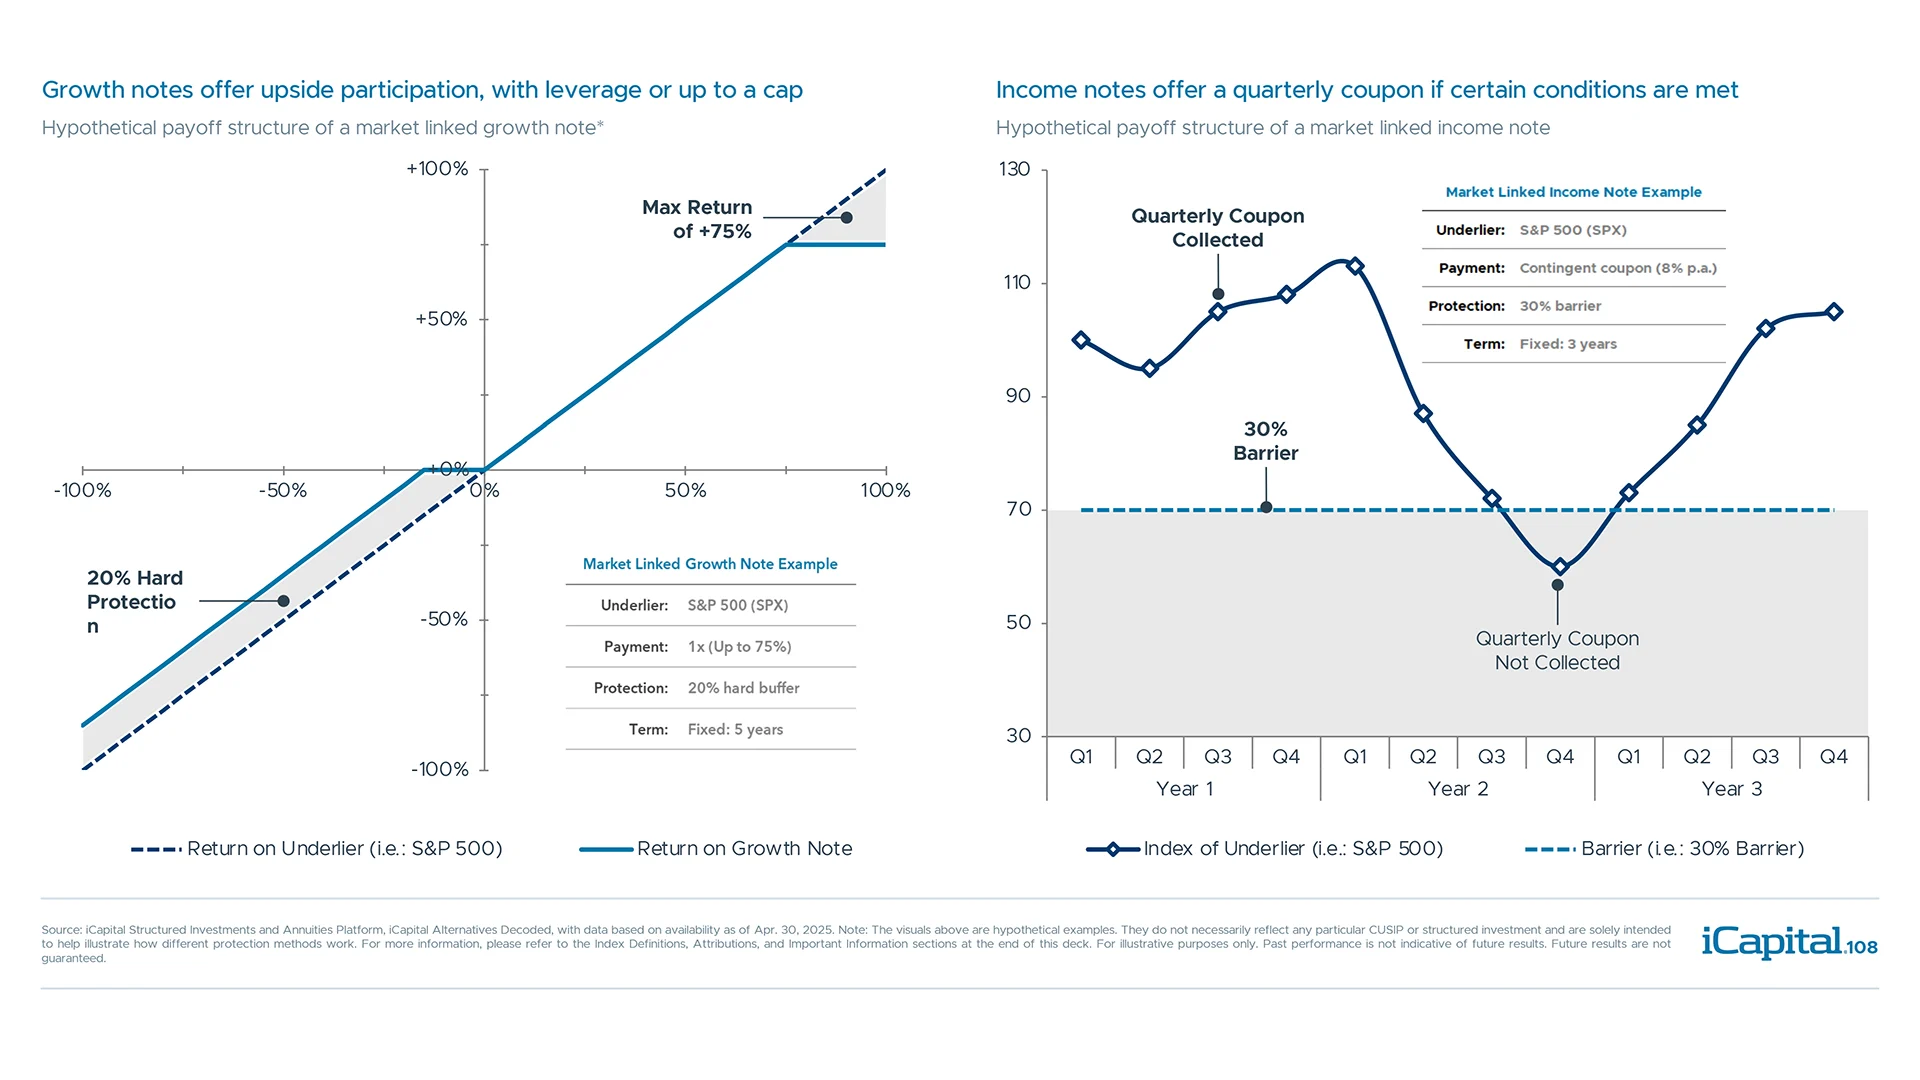
Payoff structures for market-linked growth and income notes
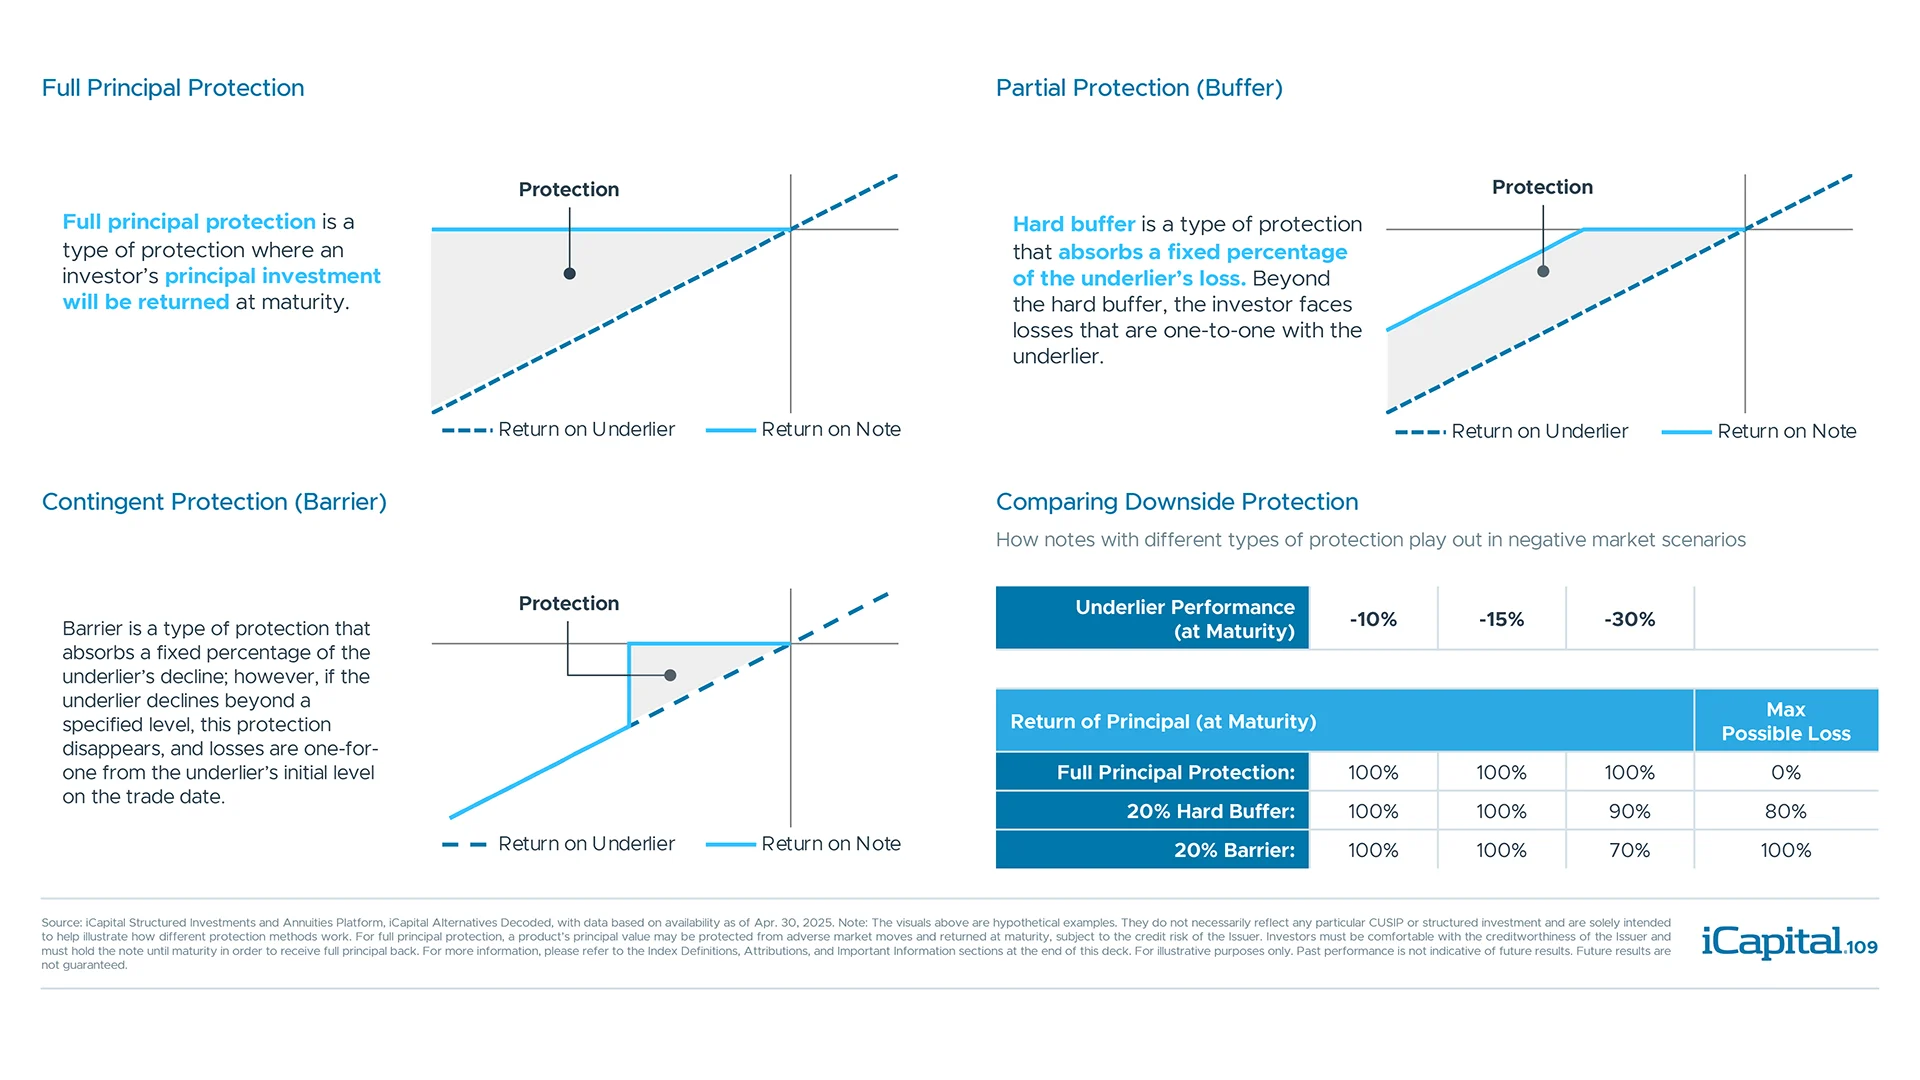
Types of protection available in structured investments
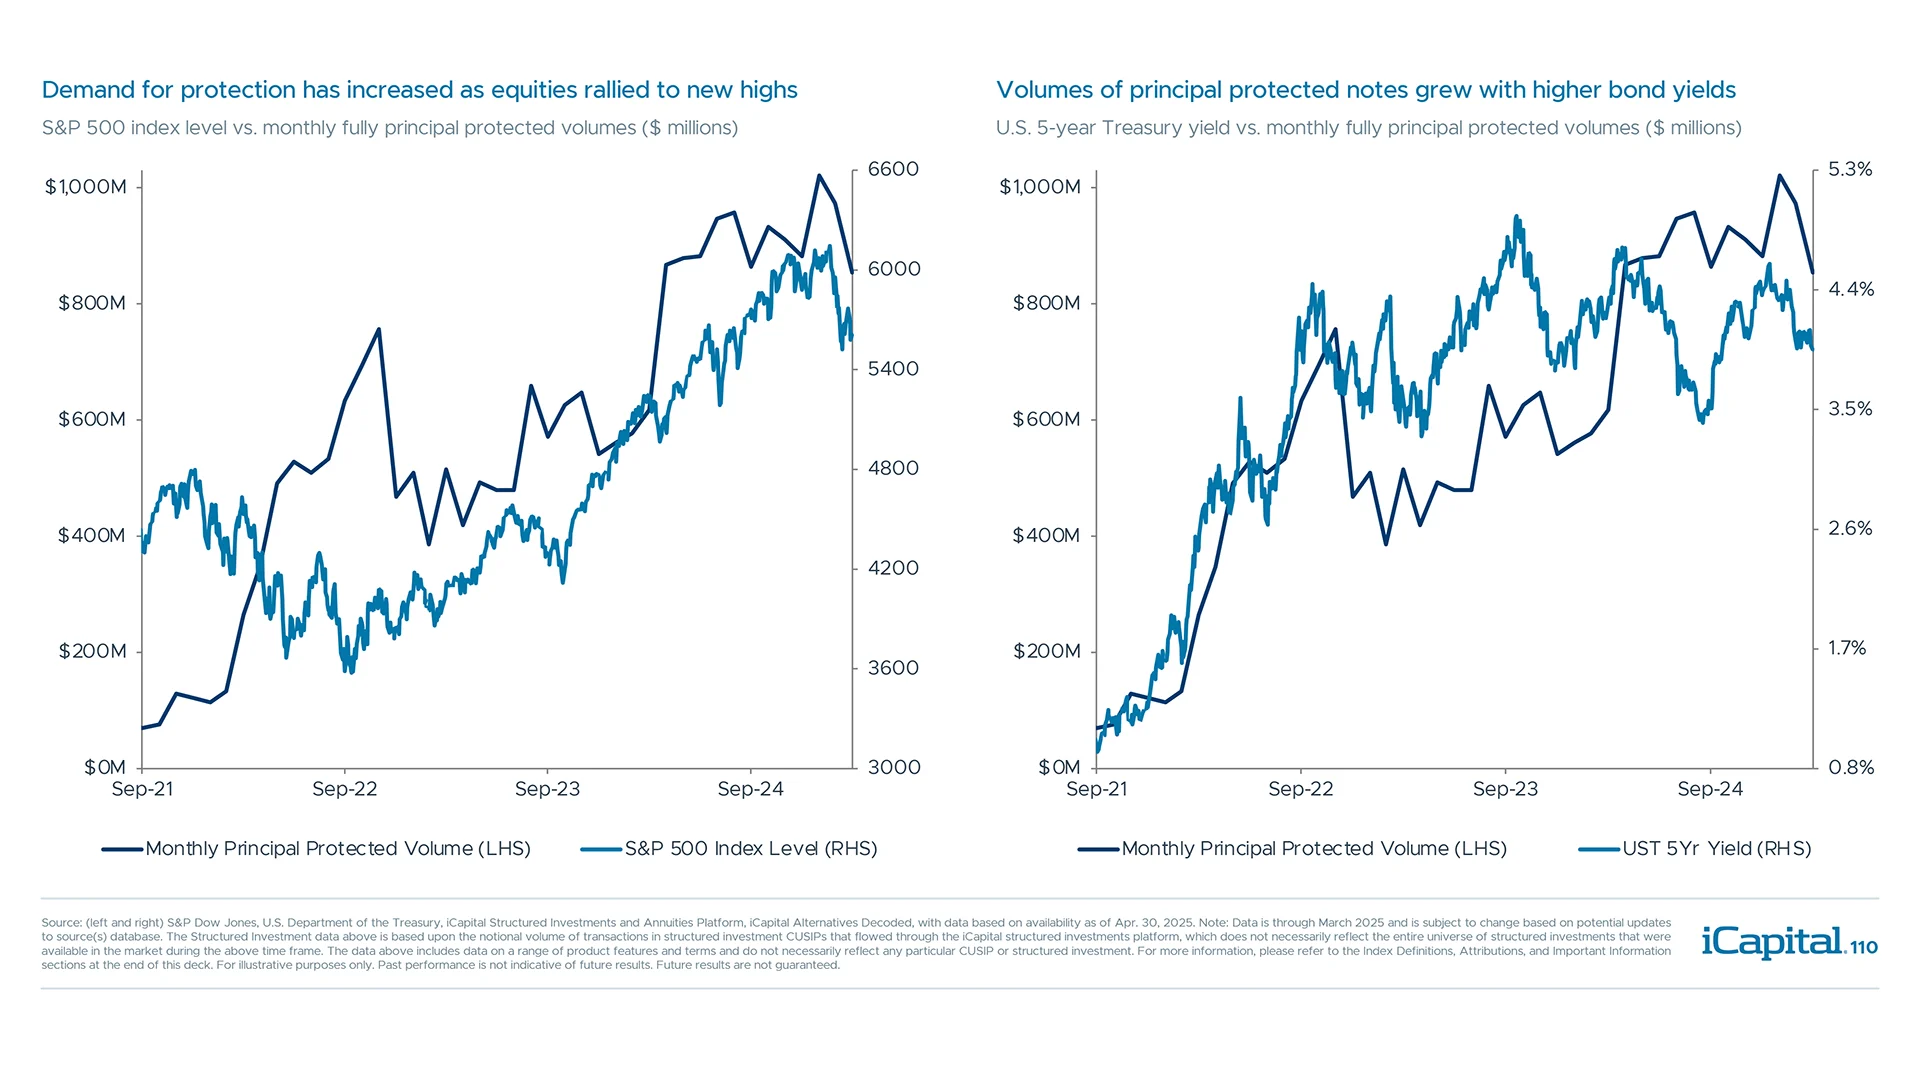
Full principal protection demand is a function of equity levels and bond yields
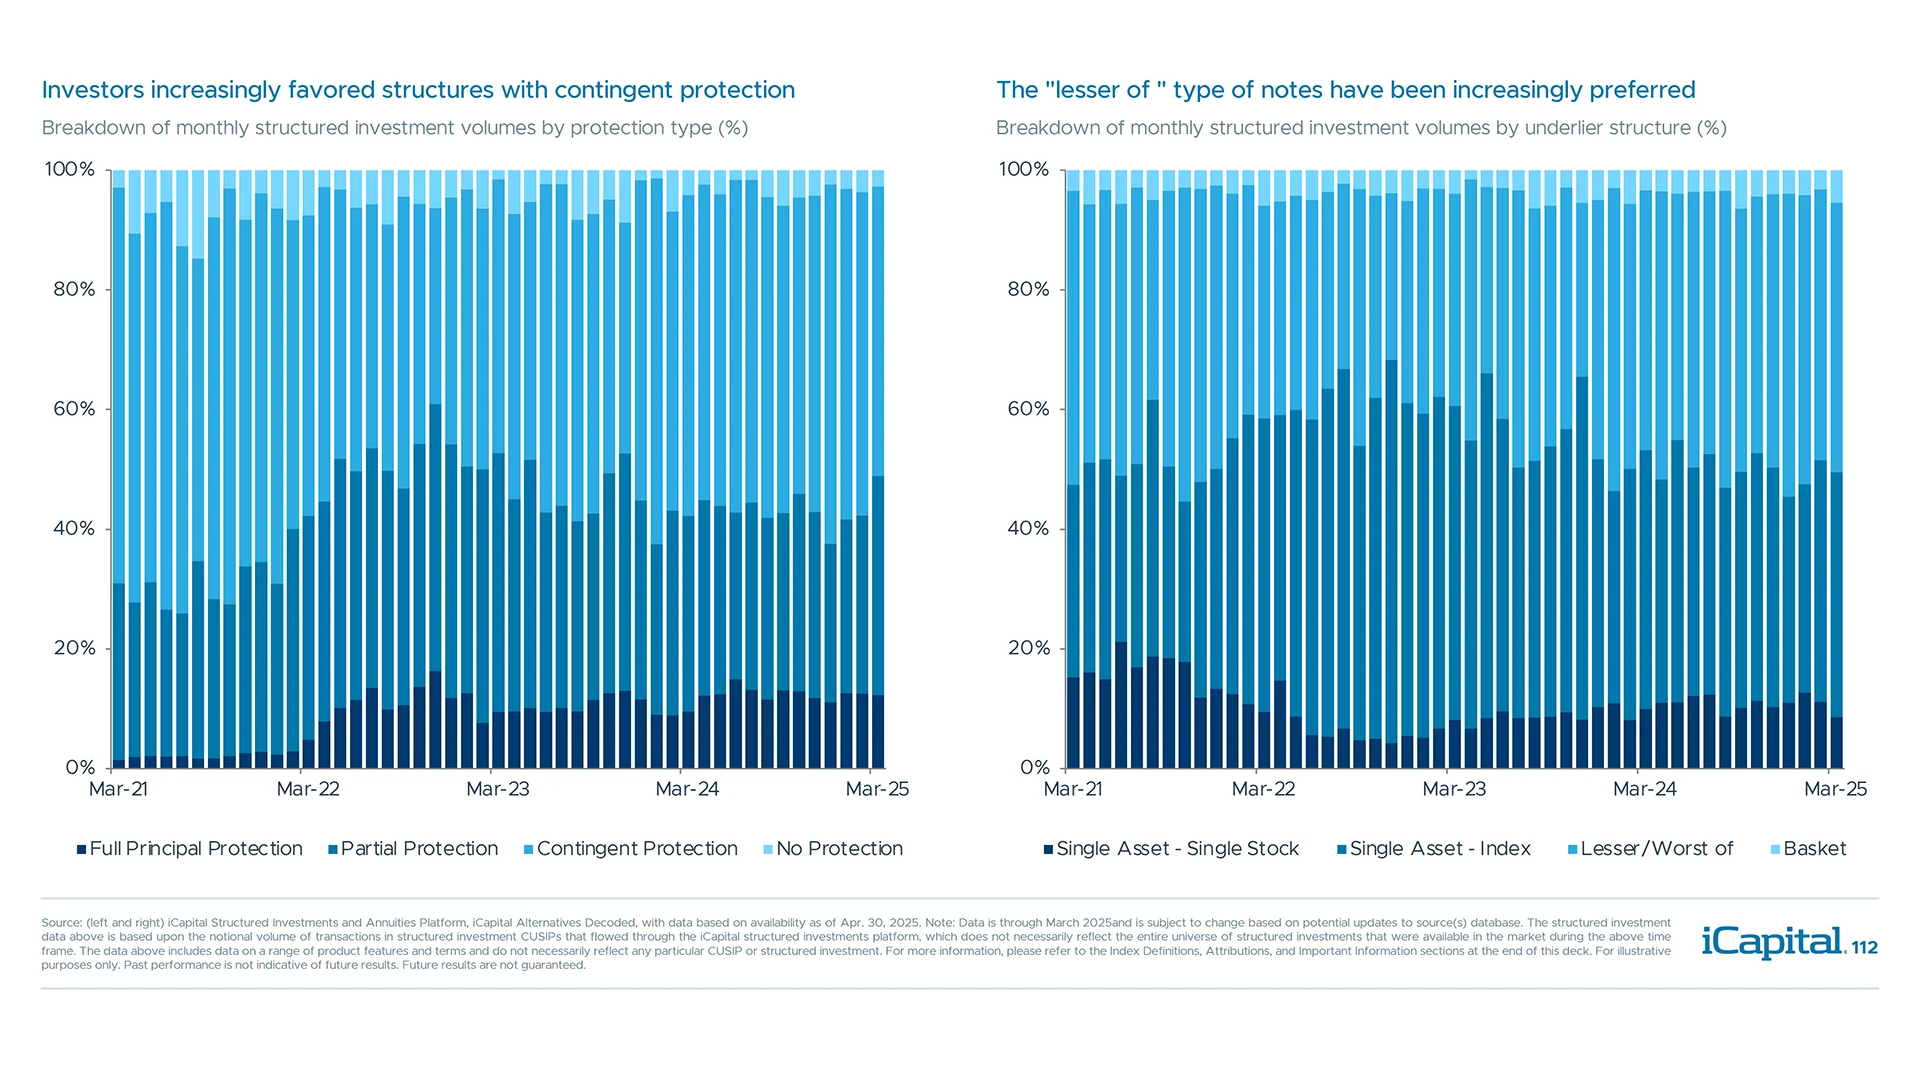
Preference for types and investment terms of structured investments varied over time

Preference for type of protection and type of underlying asset evolved over time
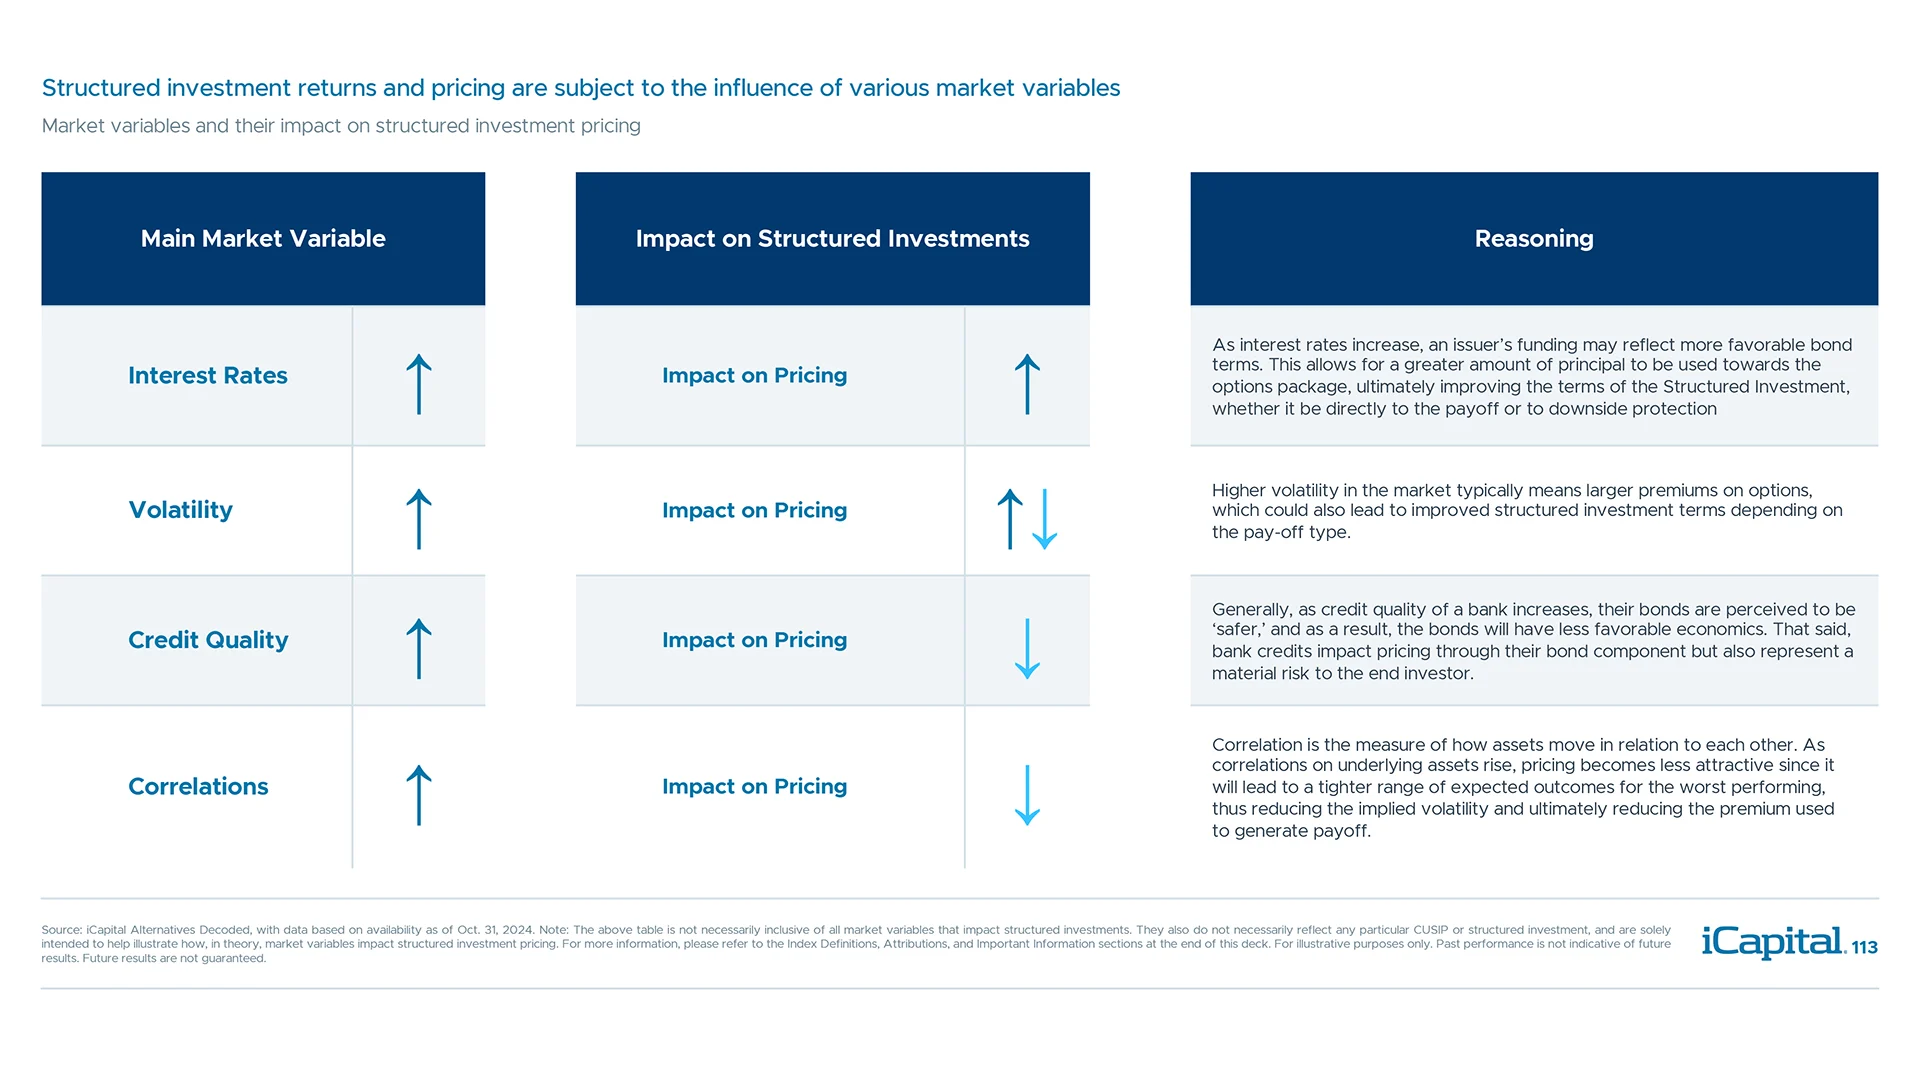
Structured investment returns and pricing are dynamic, fluctuate with market conditions
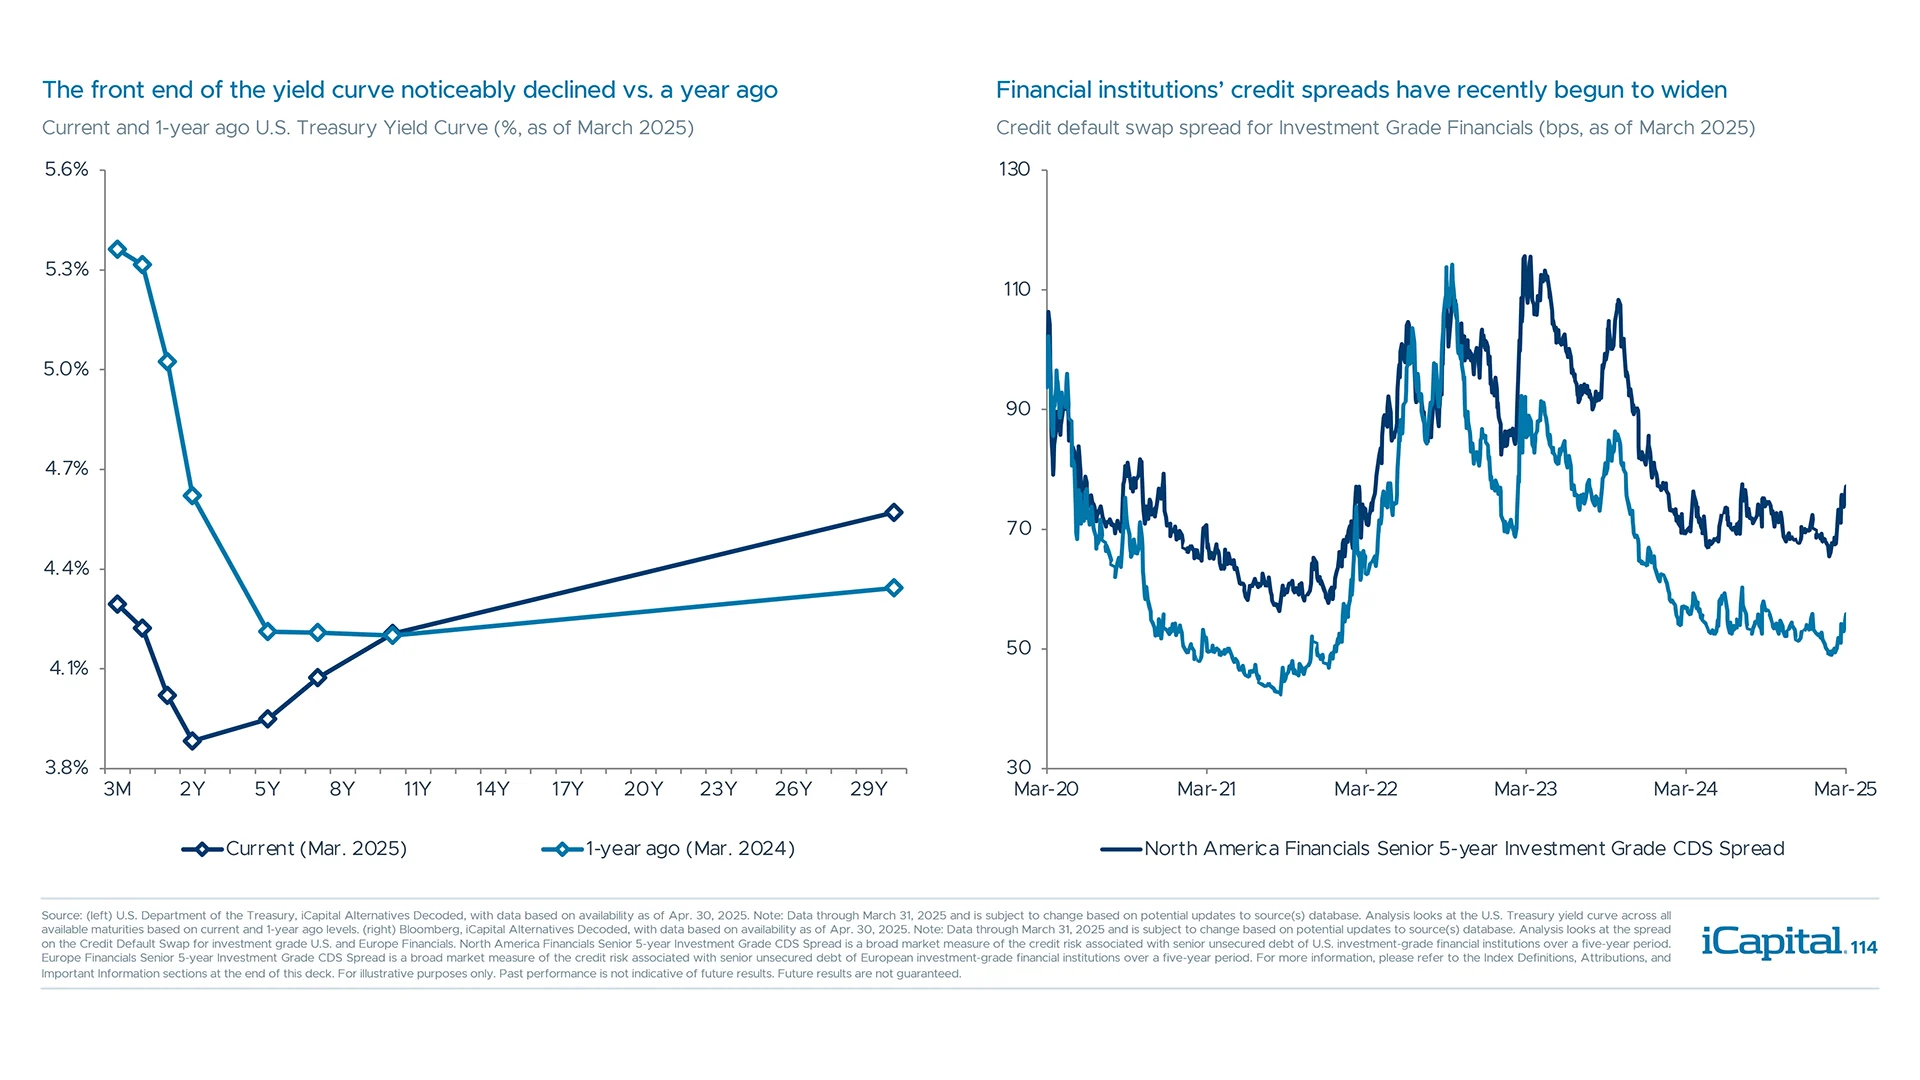
Rates have moved lower, though credit spreads have widened on the back of market jitters
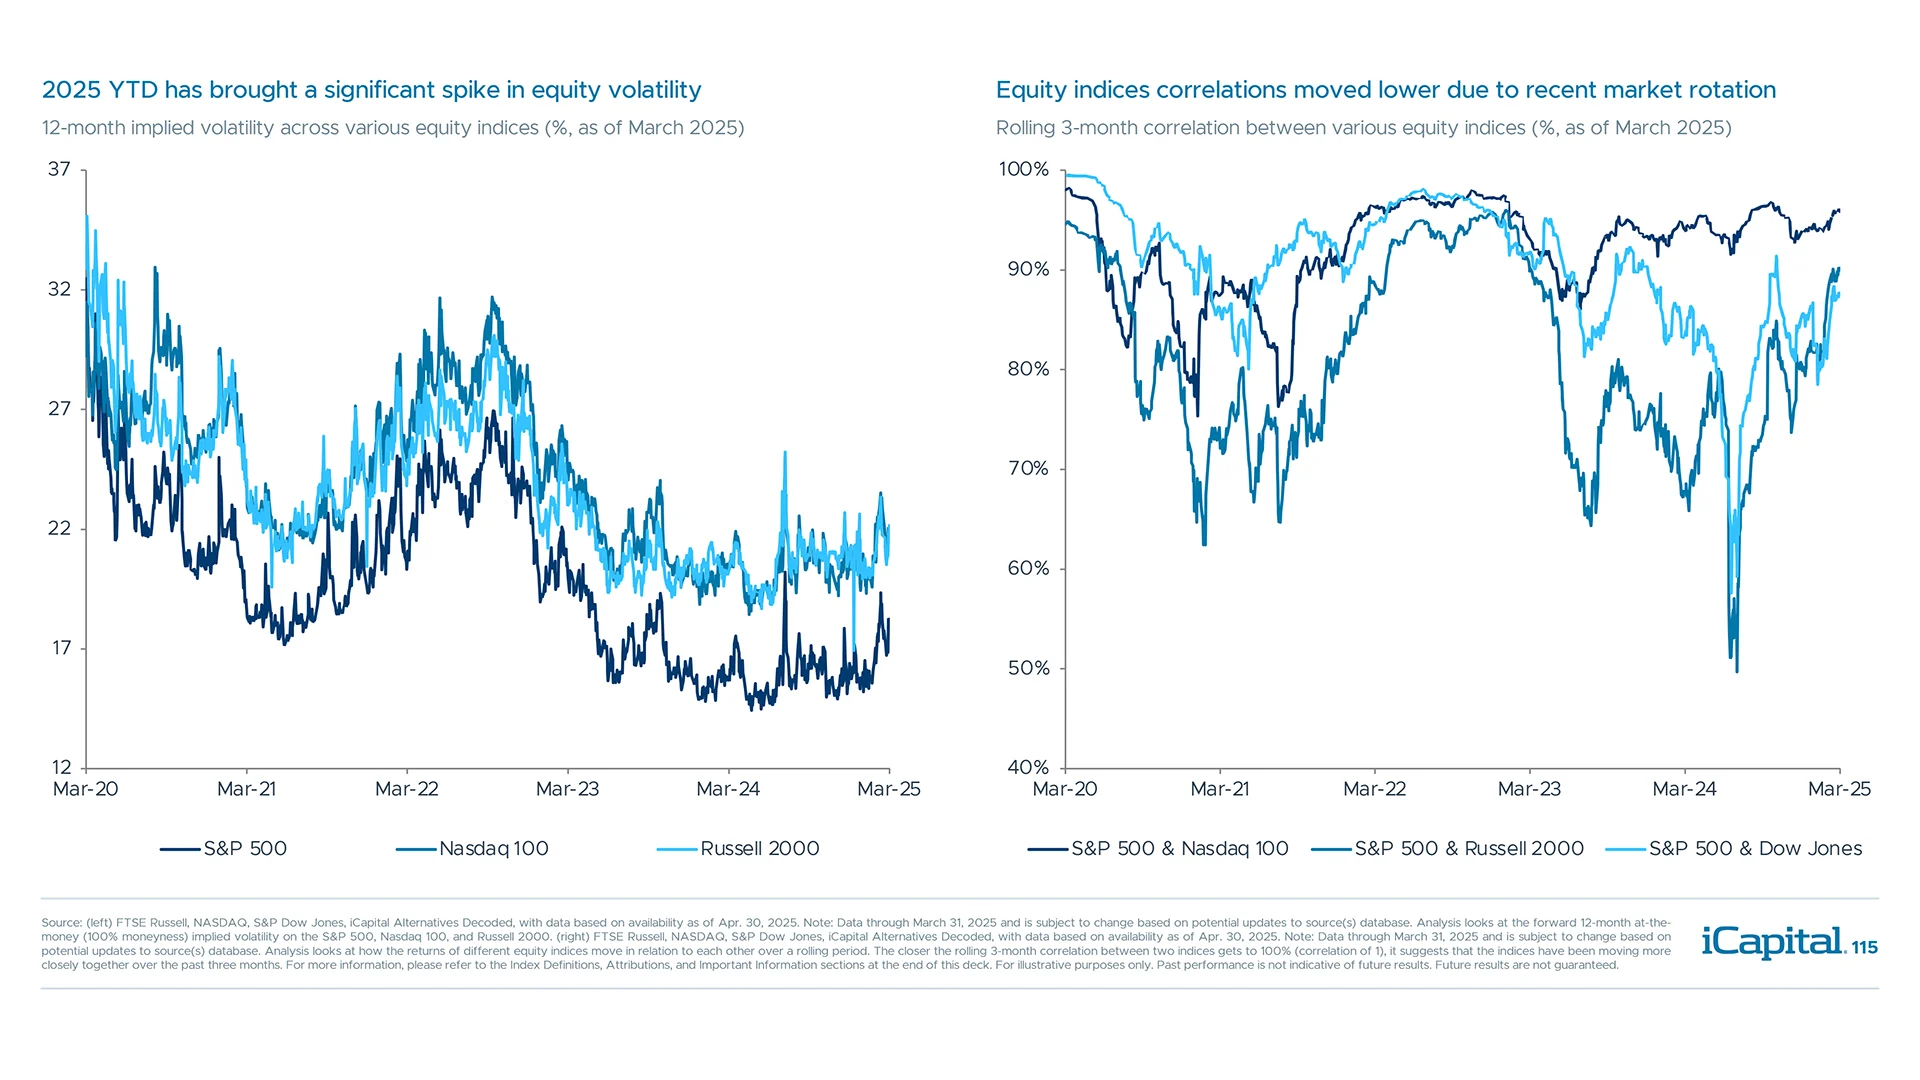
Volatility remains below 2021-22 levels but has trended higher in recent months

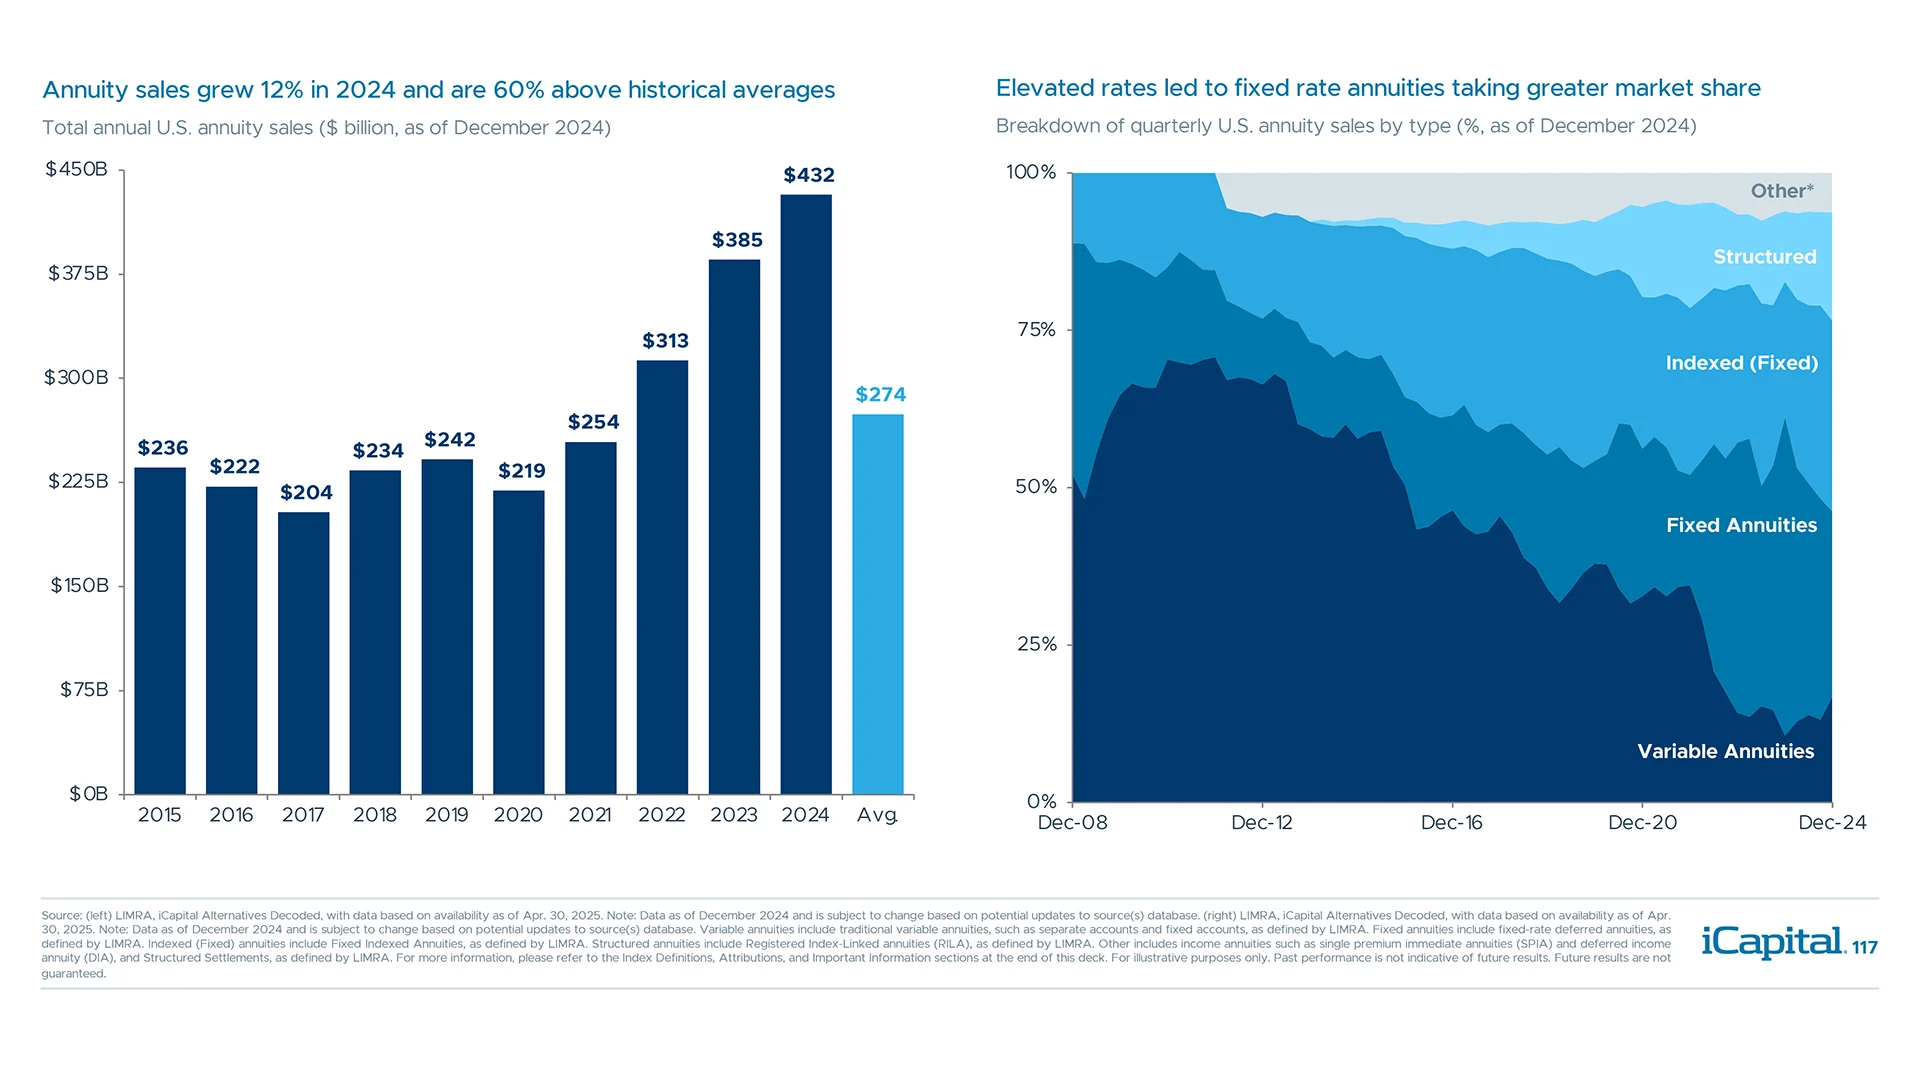
The annuity industry experienced strong growth as rates rose in recent years
Secular demand for annuities is also driven by rising population of age 65 and over

Definitions
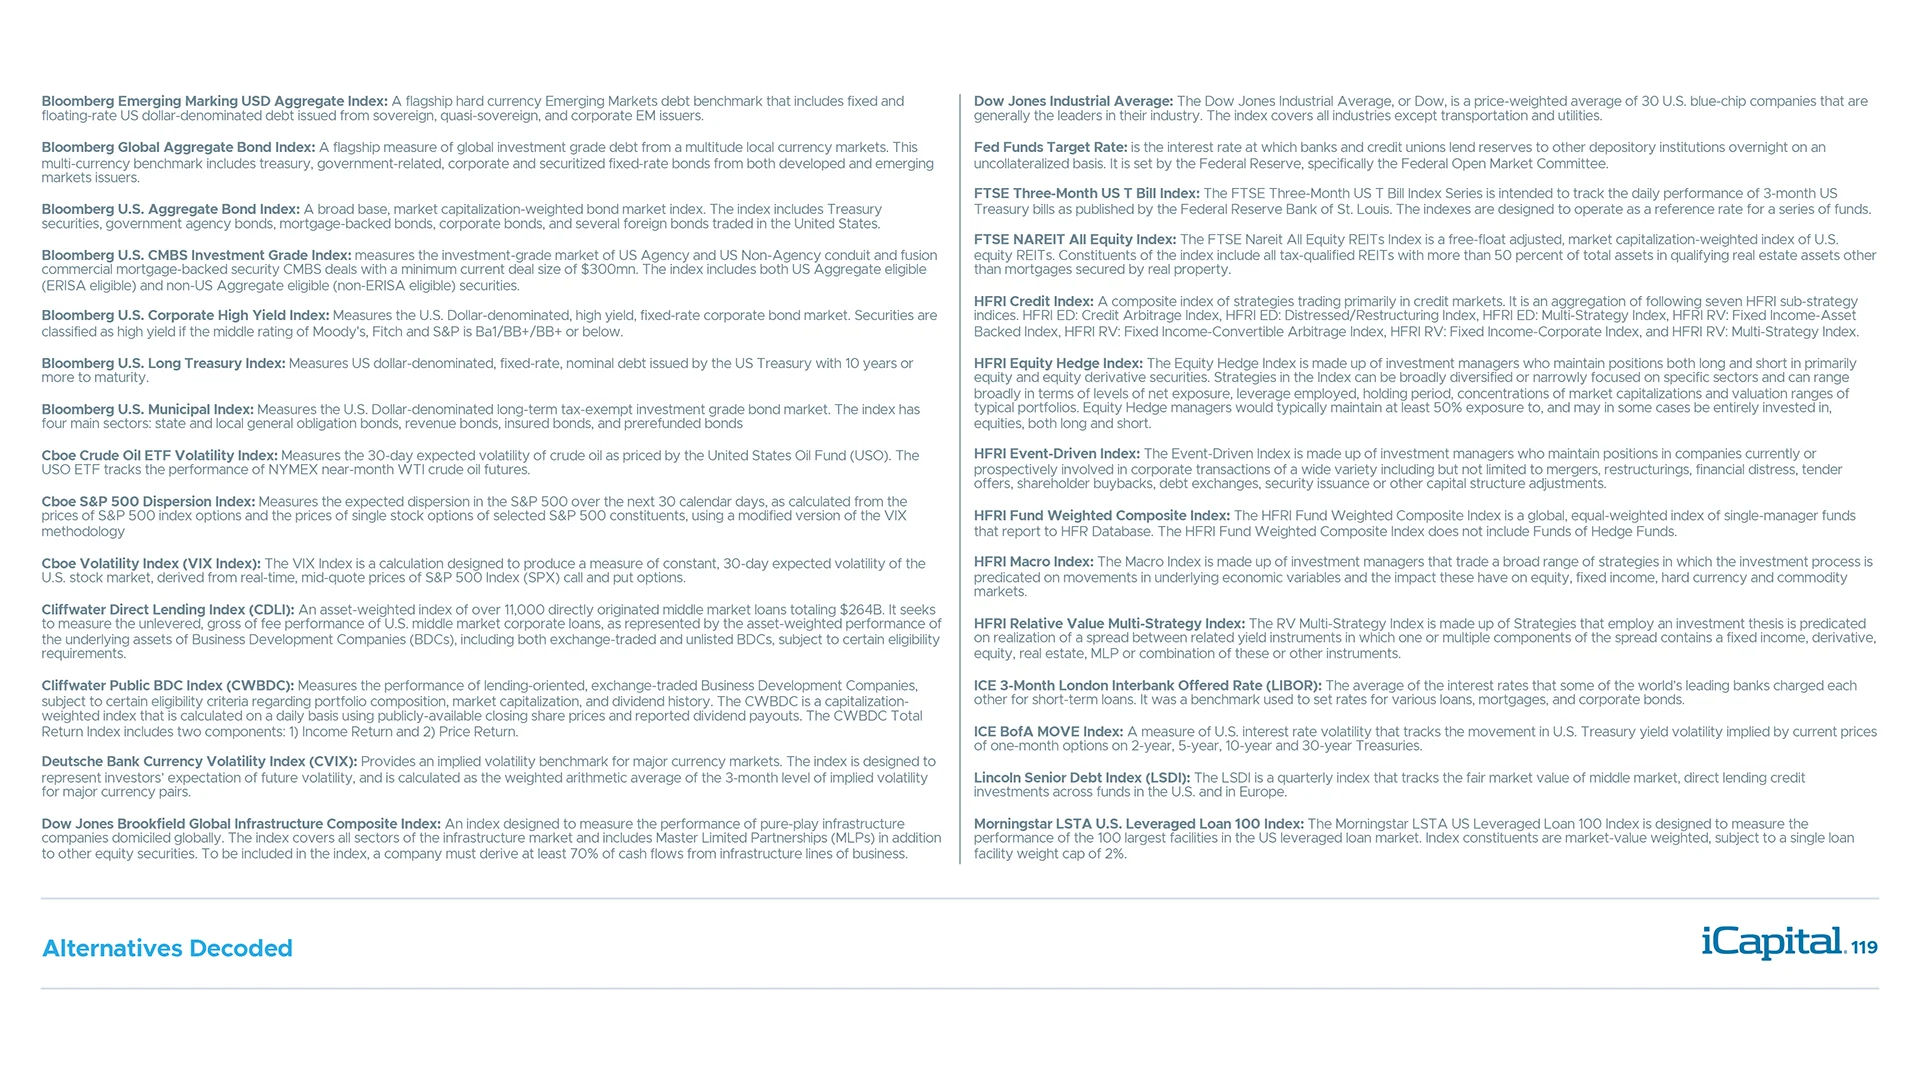
Definitions (cont’d)

Attributions
Important Information
Previous Alternatives Decoded Releases

Alternatives Decoded – Q4 2024
IMPORTANT INFORMATION
iCapital and its affiliates provide various services through a number of affiliated entities – please refer to Certain iCapital Entities for a full list of entities. iCapital entities are collectively referred to as “iCapital”, and they all are affiliated with iCapital, Inc. and Institutional Capital Network, Inc. Among these affiliates, iCapital Markets LLC (“iCapital Markets”), an SEC-registered broker-dealer, member FINRA and SIPC, offers securities products and services. The registrations and memberships listed in Certain iCapital Entities in no way imply that the SEC, FINRA, or SIPC have endorsed any of the entities, products, or services provided by iCapital. Additional information is available upon request.
This website is for informational purposes only. This website is the property of iCapital and may not be shared, reproduced in any form, or referred to in any other publication, without express written permission of iCapital.
This website and any information included on it are not intended, and may not be relied on in any manner, as legal, tax or investment advice, a recommendation, or as an offer to sell, a solicitation of an offer to purchase or a recommendation of any interest in any fund or security. Financial products, including investment funds and structured investments, are complex and may be speculative and are not suitable for all investors. You should consult your personal accounting, tax and legal advisors to understand the implications of any investment specific to your personal financial situation. This website and the information contained on it is not intended to, and does not, address the financial objectives, situation or specific needs of any specific investor.
iCapital and iCapital Network are registered trademarks of Institutional Capital Network, Inc.


