
Payment-in-kind (PIK) usage is often talked about as a problem for direct lenders, partly because PIK is viewed as a sign of portfolio stress. But there are reasons why lenders offer PIK, and there are distinctions between “good” and “bad” PIK. In fact, PIK can play a strategic role in direct lending strategies. So, it’s important not just to know if PIK is present, but to also to understand the risks and benefits of PIK, and how its usage fits in with a manager’s overall direct lending approach.
In recent years, loans making PIK payments have increased within the portfolios of business development companies (BDCs). According to S&P Global, 11.7% of loans held by BDCs made PIK payments in 2Q 2024, up nearly two points from 2Q 2023.1 Generally speaking, PIK is a loan feature that allows a borrower to defer regular interest payments by adding the interest to the principal balance of the loan (at an accrual rate). PIK is prevalent with both private market funds and BDCs, as both tend to work closely with borrowers and have flexibility to customize lending solutions. BDC’s tend to be more scrutinized in their use of PIK due to public reporting that quantifies PIK exposure.
PIK provisions are used for several reasons. Growth- oriented borrowers might want to defer interest payments to concentrate cash flow on growth initiatives, while other borrowers might need to conserve cash to withstand a difficult period. So, an important part of evaluating PIK is understanding why a borrower is using it, and if the underlying business is at risk.

One fact that shouldn’t be lost when evaluating PIK is the growth of the direct lending market. Many direct lenders incorporate PIK as part of their lending platform. Considering the market has increased six-fold over the last ten years, it’s no surprise there are some newer, more flexible financing aspects of the market, such as PIK.2 In fact, the ability to offer PIK is seen as part of the customized financing solution that direct lenders provide and can be a competitive advantage in allowing them to see more deal flow.
Terms are negotiated at origination and go through a risk-reward evaluation to justify the return premium. That said, proactive use of PIK should be viewed as lower risk. However, there are exceptions. And problematic borrowers retroactively turning to PIK can represent a concern and potentially signal future defaults.
PIK exposure has a natural upper limit in BDCs
Cliffwater CDLI data shows that PIK income has been a stable part of total income over the last four years. PIK income as a percent of total income is one measure of borrowers converting cash interest to PIK and can signal higher risk in times of sustained increases.
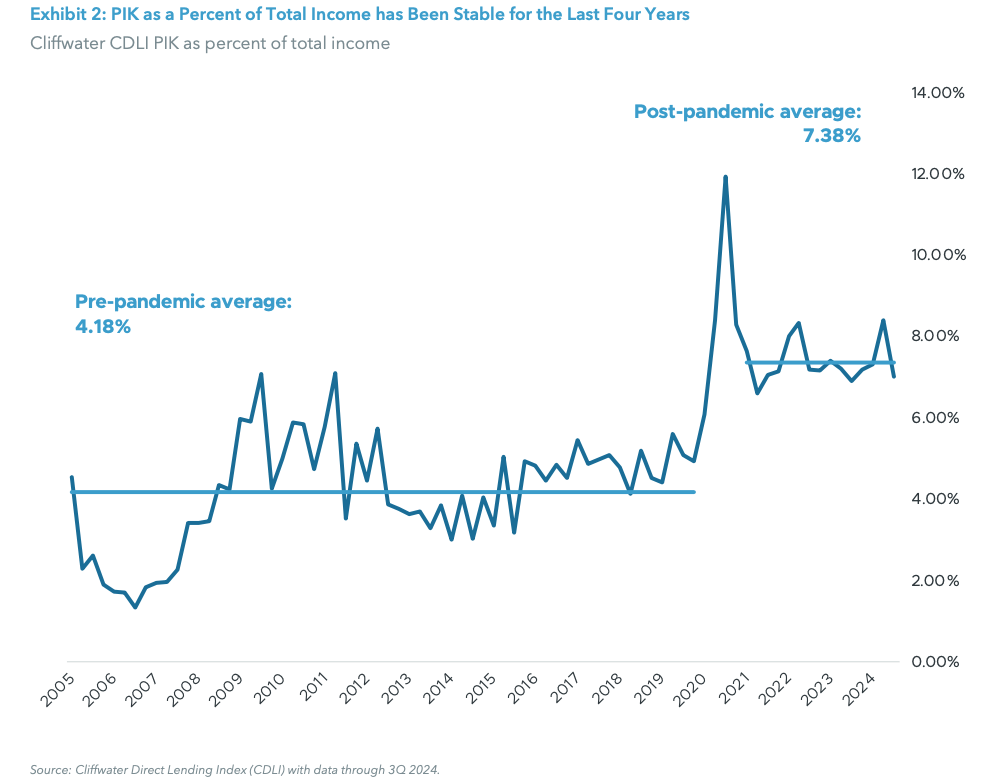
In 3Q 2024, CDLI PIK income was 7.03% of total income – roughly in line with the recent average (Exhibit 2). We expect PIK exposure to have a downward bias in the coming years based on a healthy macro environment and lower base interest rates. As interest rates decline, fewer borrowers may need to rely on the flexibility offered by PIK.
In addition to PIK exposure, the credit performance of the underlying loan is a factor. Most PIK interest has been associated with performing loans, a signal that a majority of current PIKs were negotiated at origination. Non- accruals, at less than 1.5%, have not spiked higher, which would have been indicative of more non-performing loans and stress in the portfolio (Exhibit 3).

If PIK income is a natural part of the direct lending business and here to stay, it’s natural to question where it starts to become a burden. BDCs are required to distribute 90% of income, regardless of whether that income is earned in cash or PIK. For this reason, there is a natural limiting pressure to manage PIK – if PIK income exceeds 10% of total income, the portfolio could face liquidity stress. In other words, when PIK income exceeds 10% of total income, there will be a mismatch in cash interest received and the income paid out.
For this reason we believe there’s a natural limit to how much PIK income a BDC can and should generate. It also explains why PIK income of 10% or greater should signal higher risk. Beyond the CDLI Index in Exhibit 2, which includes a mix of public, private, and non- traded BDCs, we looked at the 10 largest private/non- traded BDCs, which collectively hold over $85 billion in assets. For this group, average PIK as a percentage of total income amounts to 4.2%, or 5.2% cumulatively, suggesting there are elevated levels of PIK in publicly traded BDCs, given that the broader credit index sees 7.4% of income from PIK (Exhibit 2). The private group is likely to have a higher percentage of their portfolio made up of loans originated in the low-interest rate environment prior to the Fed’s 2022 rate-hiking cycle. In fact, of the 10 largest private BDCs, the highest PIK exposure for an individual fund is 8.2%. This comes from a technology-focused fund that has 24% exposure to the software industry, an industry that is a high user of PIK.
Keeping an eye on exposure while the market evolves
Non-banks, including direct lenders, now hold $23.2 trillion in loans compared to $12.4 trillion held by banks.3 And in 2024, several major private market firms increased their direct lending forecasts due, in part, to this public- to-private structural shift. In other words, direct lending has grown in size and stature and is now a true alternative to traditional bank lending.
At the same time, many direct lending platforms use PIK as part of their offering and borrowers will often negotiate to include PIK in the loan structure to add it post-origination. Investors should expect to see more PIK as direct lending continues to occupy a larger part of the lending markets by taking share from bank lending. We think investors should be comfortable with some PIK exposure, especially when included in loan origination, and can use a 10% threshold as a measure of higher portfolio risk. As with any asset class, there will be outliers that may suffer losses. But investors can gain comfort in experienced managers that manage PIK issuance and exposure with the same risk-return framework as any other credit decision.

Endnotes
1. S&P Global, “BDC Assets Show The Prevalence Of Payments-In-Kind Within Private Credit”, December 12, 2024.
2. Preqin, iCapital Alternatives Decoded.
3. JP Morgan; Assets and Liabilities of Commercial Banks in the United States H.8 data; Financial Accounts of the United States Z.1 data; Loans held by nonbank entities per the FRB Z.1 Financial Accounts of the United States.
Index Definitions
Cliffwater Direct Lending Index (CDLI): An asset-weighted index of over 11,000 directly originated middle market loans totaling $264B. It seeks to measure the unlevered, gross of fee performance of U.S. middle market corporate loans, as represented by the asset-weighted performance of the underlying assets of Business Development Companies (BDCs), including both exchange-traded and unlisted BDCs, subject to certain eligibility requirements.
Important Information
The material herein has been provided to you for informational purposes only by Institutional Capital Network, Inc. (“iCapital Network”) or one of its affiliates (iCapital Network together with its affiliates, “iCapital”). This material is the property of iCapital and may not be shared without the written permission of iCapital. No part of this material may be reproduced in any form, or referred to in any other publication, without express written permission of iCapital.
This material is provided for informational purposes only and is not intended as, and may not be relied on in any manner as, legal, tax or investment advice, a recommendation, or as an offer or solicitation to buy or sell any security, financial product or instrument, or otherwise to participate in any particular trading strategy. This material does not intend to address the financial objectives, situation, or specific needs of any individual investor. You should consult your personal accounting, tax, and legal advisors to understand the implications of any investment specific to your personal financial situation.
ALTERNATIVE INVESTMENTS ARE CONSIDERED COMPLEX PRODUCTS AND MAY NOT BE SUITABLE FOR ALL INVESTORS. Prospective investors should be aware that an investment in an alternative investment is speculative and involves a high degree of risk. Alternative investments often engage in leveraging and other speculative investment practices that may increase the risk of investment loss; can be highly illiquid; may not be required to provide periodic pricing or valuation information to investors; may involve complex tax structures and delays in distributing important tax information; are not subject to the same regulatory requirements as mutual funds; and often charge high fees. There is no guarantee that an alternative investment will implement its investment strategy and/or achieve its objectives, generate profits, or avoid loss. An investment should only be considered by sophisticated investors who can afford to lose all or a substantial amount of their investment.
iCapital Markets LLC operates a platform that makes available financial products to financial professionals. In operating this platform, iCapital Markets LLC generally earns revenue based on the volume of transactions that take place in these products and would benefit from an increase in sales for these products.
The information contained herein is an opinion only, as of the date indicated, and should not be relied upon as the only important information available. Any prediction, projection, or forecast on the economy, stock market, bond market, or the economic trends of the markets is not necessarily indicative of the future or likely performance. The information contained herein is subject to change, incomplete, and may include information and/or data obtained from third-party sources that iCapital believes, but does not guarantee, to be accurate. iCapital considers this third- party data reliable, but does not represent that it is accurate, complete and/or up to date, and it should not be relied on as such. iCapital makes no representation as to the accuracy or completeness of this material and accepts no liability for losses arising from the use of the material presented. No representation or warranty is made by iCapital as to the reasonableness or completeness of such forward-looking statements or to any other financial information contained herein.
Securities products and services are offered by iCapital Markets, an SEC-registered broker-dealer, member FINRA and SIPC, and an affiliate of iCapital, Inc. and Institutional Capital Network, Inc. These registrations and memberships in no way imply that the SEC, FINRA, or SIPC have endorsed any of the entities, products, or services discussed herein. Annuities and insurance services are provided by iCapital Annuities and Insurance Services LLC, an affiliate of iCapital, Inc. “iCapital” and “iCapital Network” are registered trademarks of Institutional Capital Network, Inc. Additional information is available upon request.
©2025 Institutional Capital Network, Inc. All Rights Reserved.