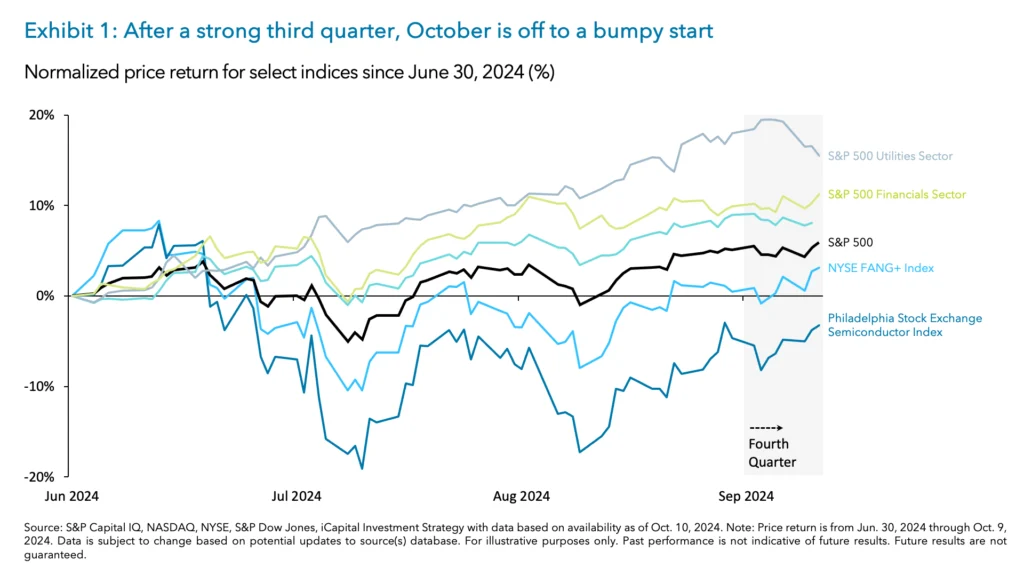
After a strong third quarter for the broader market and sectors like Utilities and Financials, October is off to a bumpy start, with the S&P 500 remaining relatively flat (Exhibit 1).1 Yes, the U.S. economy is doing fine – evident from the latest payrolls report and other economic data exceeding expectations – but the path ahead for markets may be a bumpy one through the remainder of October. Markets are being buffeted by several risks all at once – higher yields, Middle East tensions, the rising price of oil and, of course, the anticipation and uncertainty ahead of the U.S. election.
However, we still see several positives that should support stocks in the near-term. In this week’s commentary, we discuss the risks the markets need to absorb, the positives we are focused on beyond October, and some changes in positioning that could make sense, including revisiting the AI theme.
Risks on multiple fronts that need to be absorbed
The reasons why markets have struggled to make much headway since the beginning of the month (or even since the last FOMC meeting) are four-fold.
1. Higher Yields: The 10-year U.S. Treasury yield has climbed back up to 4%2, as expectations for an aggressive rate cutting cycle get pared back.
2. Middle East Tensions: Middle East tensions are ongoing with no clear resolution in sight until at least after the U.S. election. This could continue to pressure oil higher, especially given that OECD inventories are now below 5-year averages3 and demand may be supported by China policy stimulus and U.S. rate relief.
3. Rising Oil Prices: The rising price of oil due to the geopolitical premium could act as a tax on corporations and consumers by causing a spike in inflation in the coming months.
4. Election Uncertainty: With the U.S. Presidential election less than a month away, markets are historically prone to increased volatility as investors tend to become more cautious.
Aside from these factors, the market also has to contend with relatively elevated positioning and overbought conditions. The S&P 500 added +5.5% in the third quarter as many investors boosted their equity positioning while reducing cash.4 This pushed the S&P 500 close to overbought levels as we started October.5 And the upcoming earnings season will also bring corporate buyback blackouts. All of this combined could lead to more choppy price action in the near-term with these risks potentially capping upside or even causing downside if risks increase.
Still, we see positives in the background supporting stocks
Looking beyond October, however, we find ongoing support for risk assets. First, while the upcoming election may be a source of volatility, it’s worth remembering that this volatility tends to peak before the election and subsides afterward, regardless of the outcome. While we believe this pattern will hold true again this time, we will explore various election scenarios and their implications on the economy, earnings and sector impacts in our subsequent commentaries. However, our current view is that in aggregate both candidates’ grand proposals may not have an outsized impact on the economy/markets. In fact, both candidates’ policy proposals might restrain growth on the surface, but they also include positive offsets.
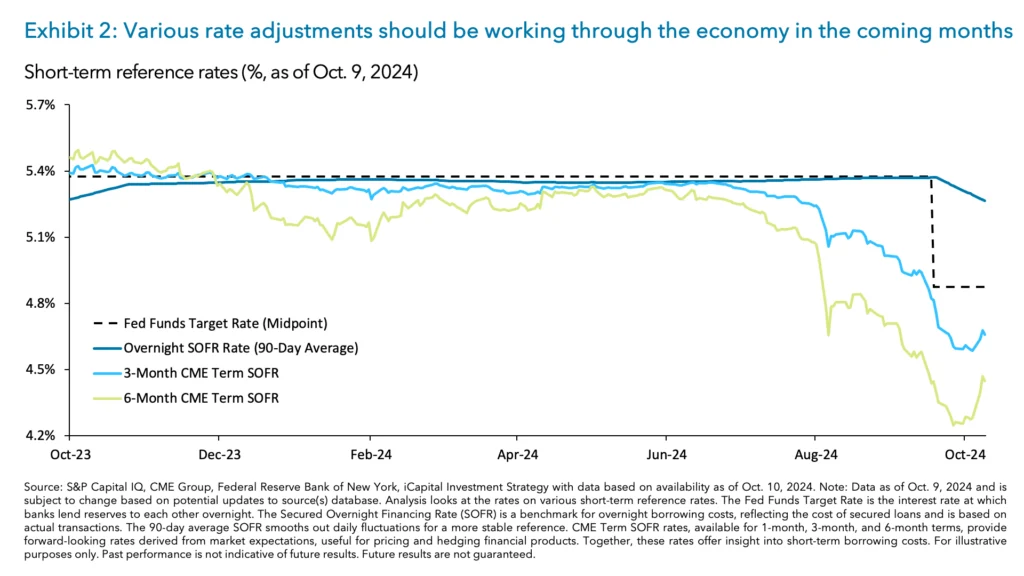
Second, the start of the Fed easing cycle in September (even if not as aggressive as was expected just a few weeks ago) has marked a new and positive beginning for the economy. Rate cuts should spell relief for various parts of the economy, including for corporations, consumers, and real estate operators. And some of that relief has already started to be felt. Indeed, while the Fed has cut rates just once so far, forward-looking measures like Term SOFR rates have already begun to adjust lower in anticipation of further cuts (Exhibit 2). This means certain types of loans tied to Term SOFR rates may already be benefiting from lower rates.
Corporate loans, private credit and publicly traded leveraged loans – some of which are tied to forward-looking Term SOFR rates – may have already seen rates reset lower on existing and new loans.
Private loans, which typically have floating rates tied to the three-month Term SOFR rate6, have been especially affected. When rates rose from 2022 to 2023, interest coverage ratios deteriorated as borrower interest costs increased by 50%.7 However, with rates now starting to fall, cash flows should start to improve as interest expenses decline. In fact, when looking at where front-end rates are expected to finish the year, the interest coverage ratio for portfolio companies is projected to improve from 1.7x to 1.9x, which should in turn boost their earnings by roughly +14%.8
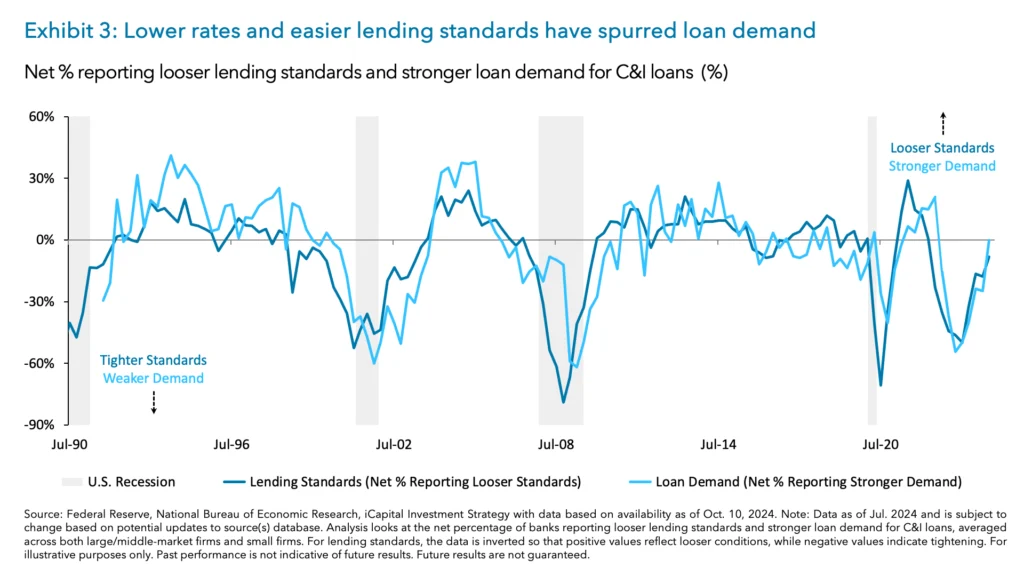
Furthermore, the decline in rates has spurred a recovery in corporate loan demand. Since the SVB crisis, lending standards for commercial & industrial (C&I) loans have tightened significantly. However, given the improvement in financial conditions from lower rates, lending standards have eased from the extreme levels witnessed in the third quarter of 2022 (Exhibit 3).9 This has led to a pick-up in demand for C&I loans. Indeed, demand across large, medium and small firms, has recovered and is now back to levels seen prior to the regional bank crisis.10 When looking at what has been driving the improvement in demand – the best levels in two years – firms noted financing needs for inventory, M&A activity and an increased investment in plant or equipment.11
Lower rates should also boost commercial real estate (CRE) prices, spur deal activity, ease debt service costs and improve demand for loans. Indeed, outside of the 2007 GFC, when the Fed enters a cutting cycle, CRE prices – proxied by the NCREIF Property Index – typically rise by +7 % over the following year, while levered private CRE funds – proxied by the NCREIF ODCE Index – also see an average return of +7% during that period.12 For borrowers with floating-rate debt, Fed easing positively impacts key CRE base rates, like SOFR. This is particularly impactful now, as the share of floating-rate debt in CMBS loans has risen from 5% in the mid-2000s to 22% today, meaning the passthrough from Fed cuts could be quicker and more impactful than in the past.13
And there’s more to consider. A further decline in base rates should also lessen the burden of the upcoming wave of CRE maturities through 2025 and 2026.14 In 2024, the average interest rate on newly originated CRE loans has been 6.2% – about 190 bps higher than maturing loans.15 However, with further Fed cuts, base rates could fall to around 4% in 2025 and closer to 3% by 2026, allowing maturing loans to refinance at relatively lower yields – assuming spreads hold steady.16
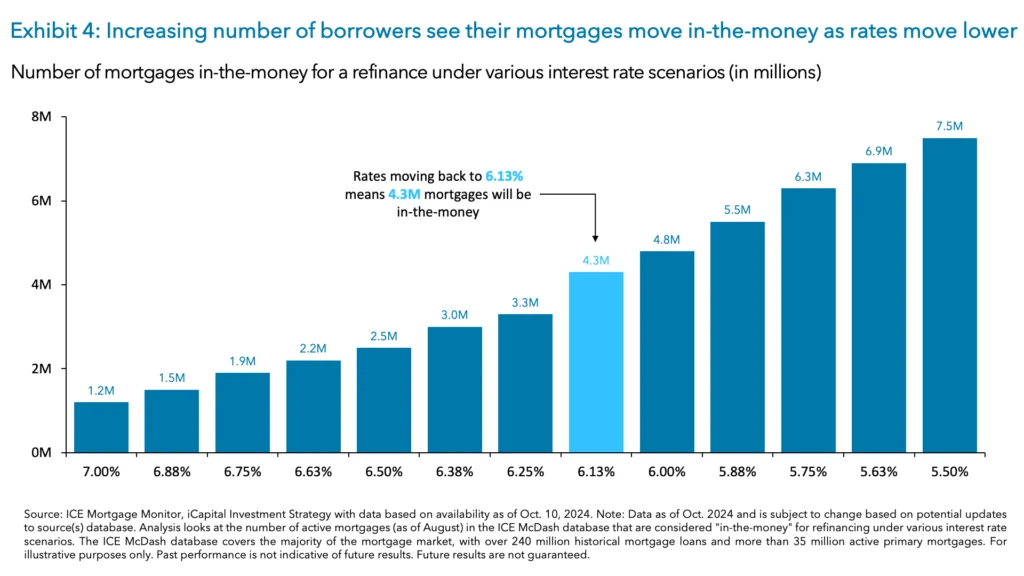
For consumers, lower interest rates could support new mortgage activity as well as refinancing. Despite the U.S. 10-year Treasury yield being up 11bps year-to-date (YTD) through October 9th, it is down roughly 70bps from its April high.17 Given the sensitivity mortgage rates have to the long end of the Treasury curve, the yield on the 30-year fixed rate mortgage has also fallen by 58bps to 6.98% over this time.18 Although mortgage rates have risen slightly in the past week, if they fall back to their late September levels of around 6%, roughly 4.3 million borrowers could lower their mortgage rate by 0.75%, freeing up $300 in monthly payments (Exhibit 4).19 With mortgage rates now more closely reflecting the path of Fed policy, further increases in Treasury yields and mortgage rates should be limited. As rates stabilize, refinancing activity, which has dropped 75% since 2020, is expected to pick up.20 Ultimately, this should free up liquidity for U.S. consumers, which would also be beneficial for the banking sector.21
Stay invested and revisit the AI theme
We believe the S&P 500 is on track towards reaching 6,000 by year-end, a level supported by a price-to-earnings ratio of 21.5x and a 2025 EPS estimate of $277.22 However, looking ahead to 2025, the upside isn’t capped at this level as the 2026 EPS estimate of $307 rolls into forward market pricing.23 To position for constructive economic and market environment, here are some ideas.
1. Rotation/Cyclicals trades in Financials and Real Estate: Stick with rotation/cyclicals trades in financials and real estate, given the favorable rate relief environment (which we discussed here), as well as recent China growth measures and the potential for pro-growth policies from either prevailing Presidential candidate.
2. Income-Producing Assets: Focus on income-producing assets like the utilities sector in equities, as well as infrastructure, commercial real estate, and private credit in private markets, given the expected lower money market yields.
3. Revisit the AI Theme: Consider semiconductors and Mag 724 stocks, as well as data centers and power generation names, all of which benefit from the buildout of AI infrastructure. Investors seemingly gave up their AI enthusiasm in the third quarter as AI beneficiary stocks were largely rangebound to down -5% in the third quarter.25 However, recent updates from NVIDIA’s AI Summit, Mobile World Congress in Las Vegas, and AMD Advancing AI event may reignite interest and enthusiasm.
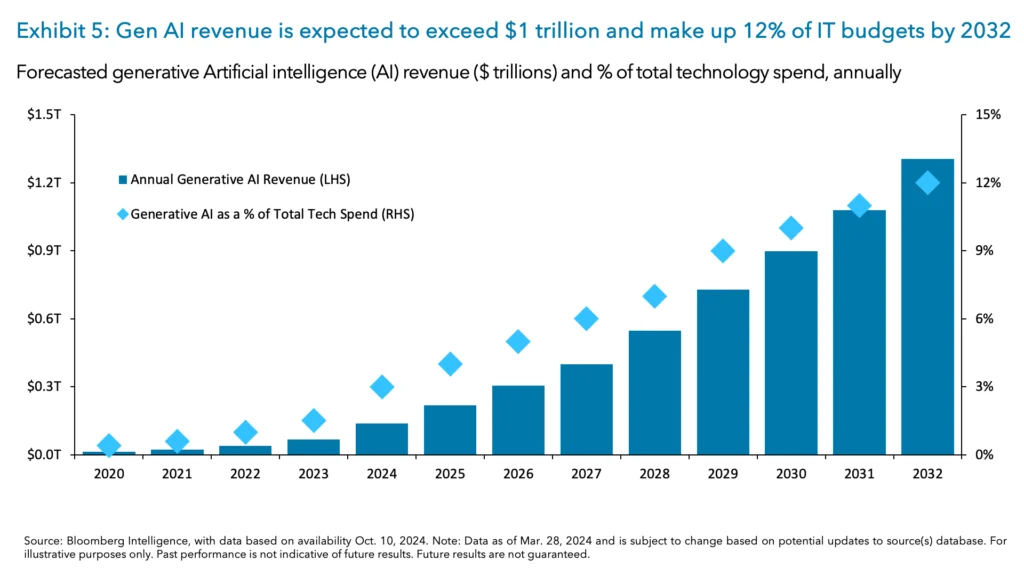
In our view AI investment momentum remains robust. Yes, investors and CIOs expect a great deal from AI including productivity increases, cost savings and enhanced customer experience, but they must be seeing the results because AI capital expenditures (capex) continue to increase. For example, spending on GenAI software, hardware, and services is expected to grow from roughly $140 billion today to $1.3 trillion by 2032 (Exhibit 5).26 More specifically, GenAI spending as a % of global IT budgets, is expected to rise from 3% today to 12% by 2032.27
Select semiconductor stocks have benefitted from this AI capex. Importantly, following a down quarter, valuations in the Semiconductors/AI sector have reset lower while EPS expectations have continued to rise.28 You can see this by looking at the price-to-earnings-growth (PEG) ratio, which is now below one, highlighting that semiconductor valuations appear to be undervalued relative to long-run earnings growth expectations.29 This is an attractive setup.
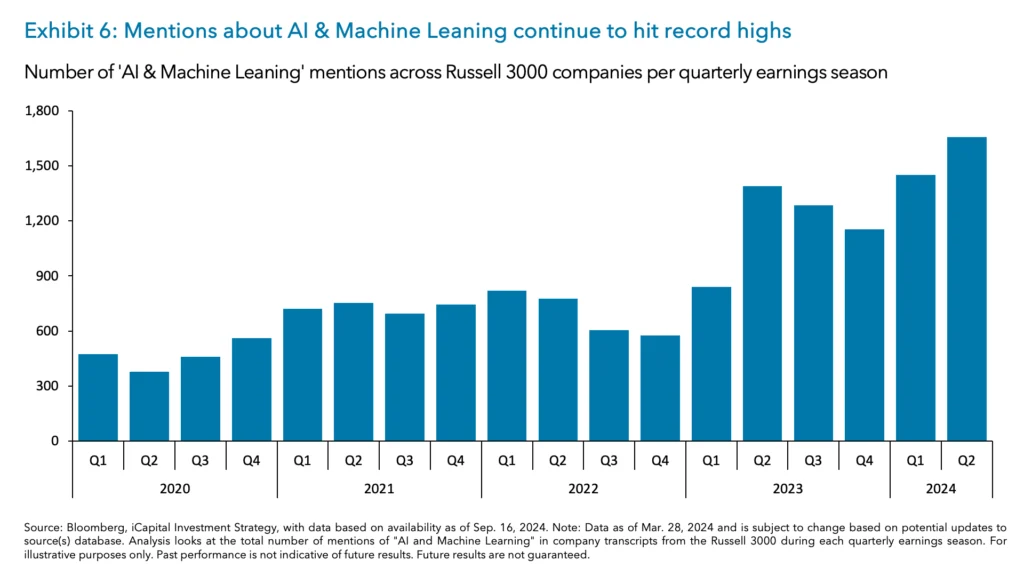
Likewise, some Mag 7 stocks tied to AI have lagged as concerns surfaced about the return on their AI capex investment. Indeed, these AI hyperscalers are likely experiencing their greatest AI spending growth this year, with growth rates forecast to taper off from 41% today to 11% in 2025 and 6% in 2026.30 Thus, these hyperscalers may be moving from a period of investment to a period of monetization. However, we don’t think the deceleration in AI capex growth should be a concern to semis, as mentions of “AI and machine learning” by Russell 3000 companies have hit a record high (over half) and are not slowing (Exhibit 6).31 And so neither should their AI capex, all of which should benefit the semiconductor sector.
1. S&P Capital IQ, New York Stock Exchange, Philadelphia Semiconductor Index, as of Oct. 8, 2024.
2. U.S. Department of the Treasury, as of Oct. 9,2024.
3. JPMorgan, as of Oct. 4, 2024.
4. S&P Capital IQ, Goldman Sachs, as of Oct. 2, 2024.
5. S&P Capital IQ, as of Oct. 8, 2024.
6. Valuation Research Corporation, as of Mar. 2024. Note: 3-month Term SOFR is the private credit market’s preferred base rate benchmark
7. Valuation & Advisory Services, as of Mar. 2024.
8. iCapital Investment Strategy Analysis, Pitchbook | LCD, as of Oct. 9, 2024.
9. Federal Reserve, as of Aug. 5, 2024.
10. Ibid.
11. Ibid.
12. NCREIF, Bureau of Economic Analysis, iCapital Investment Strategy, as of
13. Trepp, Goldman Sachs, as of Sep. 30, 2024.
14. Mortgage Bankers Association, iCapital Investment Strategy
15. S&P Global, as of Sep. 5, 2024.
16. Bloomberg, Federal Reserve, iCapital Investment Strategy, as of Oct. 9, 2024.
17. S&P Capital IQ, Federal Reserve, iCapital Investment Strategy, as of Oct. 9, 2024.
18. Bankrate.com, as of Oct. 8, 2024.
19. ICE Mortgage Monitor, iCapital Investment Strategy, as of Oct. 7, 2024.
20. Mortgage Bankers Association, iCapital Investment Strategy, as of Oct. 9as of Oct. 4, 2024.
21. Fannie Mae, Wall Street Journal, iCapital Investment Strategy, as of Sep. 19, 2024.
22. FactSet Earnings Insight, iCapital Investment Strategy, as of Oct. 4, 2024.
23. Ibid.
24. Mag 7 stand for the magnificent 7 companies in the S&P 500, which include Apple, Amazon, Alphabet, Telsa, Nvidia, Meta and Microsoft.
25. Philadelphia Semiconductor Index and New York Stock Exchange, as of Oct. 8, 2024.
26. Bloomberg Intelligence, as of Mar. 26, 2024.
27. Ibid.
28. S&P Capital IQ, as of Sep. 11, 2024.
29. Ibid.
30. S&P Capital IQ, as of Sep. 16, 2024.
31. Bloomberg, iCapital Investment Strategy, as of Sep. 16, 2024.
INDEX DEFINITIONS
NYSE FANG+ Index: The NYSE FANG+ Index is an equal-dollar weighted index designed to represent a segment of the technology and consumer discretionary sectors consisting of highly-traded growth stocks of technology and tech-enabled companies such as Facebook, Apple, Amazon, Netflix, and Alphabet's Google.
NCREIF Open End Diversified Core Equity (NFI-ODCE) Index: The ODCE is a capitalization-weighted, gross of fee, time-weighted return index of investment returns reporting on both a historical and current basis the results of 38 open-end commingled funds pursuing a core investment strategy.
NCREIF National Property Index (NPI): The NCREIF National Property Index (NPI) is a quarterly, unlevered, appraisal-based CPPI that measures the total return for private commercial real estate properties held for investment purposes only. All properties in the NPI have been acquired, at least in part, on behalf of tax-exempt institutional investors and held in a fiduciary environment.
Philadelphia Stock Exchange Semiconductor Index (SOX): The Philadelphia Stock Exchange Semiconductor Index (SOX) is a modified market capitalization-weighted index composed of companies primarily involved in the design, distribution, manufacture, and sale of semiconductors.
S&P 500 Index: The S&P 500 is widely regarded as the best single gauge of large-cap U.S. equities. The index includes 500 of the top companies in leading industries of the U.S. economy and covers approximately 80% of available market capitalization.
S&P 500 Equal Weight Index: The S&P 500 Equal Weight Index is the equal-weight version of the widely-used S&P 500. The index includes the same constituents as the capitalization weighted S&P 500, but each company in the S&P 500 EWI is allocated a fixed weight - or 0.2% of the index total at each quarterly rebalance.
S&P 500 Utilities Index: Standard and Poor's 500 Utilities Index is a capitalization-weighted index that tracks the performance of utility companies within the S&P 500, providing a view of energy, water, and electric service providers.
S&P 500 Financials Index: Standard and Poor's 500 Financials Index is a capitalization-weighted index that tracks the performance of financial companies within the S&P 500, including banks, insurers, and asset managers.
IMPORTANT INFORMATION
The material herein has been provided to you for informational purposes only by Institutional Capital Network, Inc. (“iCapital Network”) or one of its affiliates (iCapital Network together with its affiliates, “iCapital”). This material is the property of iCapital and may not be shared without the written permission of iCapital. No part of this material may be reproduced in any form, or referred to in any other publication, without express written permission of iCapital.
This material is provided for informational purposes only and is not intended as, and may not be relied on in any manner as, legal, tax or investment advice, a recommendation, or as an offer or solicitation to buy or sell any security, financial product or instrument, or otherwise to participate in any particular trading strategy. This material does not intend to address the financial objectives, situation, or specific needs of any individual investor. You should consult your personal accounting, tax and legal advisors to understand the implications of any investment specific to your personal financial situation.
ALTERNATIVE INVESTMENTS ARE CONSIDERED COMPLEX PRODUCTS AND MAY NOT BE SUITABLE FOR ALL INVESTORS. Prospective investors should be aware that an investment in an alternative investment is speculative and involves a high degree of risk. Alternative Investments often engage in leveraging and other speculative investment practices that may increase the risk of investment loss; can be highly illiquid; may not be required to provide periodic pricing or valuation information to investors; may involve complex tax structures and delays in distributing important tax information; are not subject to the same regulatory requirements as mutual funds; and often charge high fees. There is no guarantee that an alternative investment will implement its investment strategy and/or achieve its objectives, generate profits, or avoid loss. An investment should only be considered by sophisticated investors who can afford to lose all or a substantial amount of their investment.
iCapital Markets LLC operates a platform that makes available financial products to financial professionals. In operating this platform, iCapital Markets LLC generally earns revenue based on the volume of transactions that take place in these products and would benefit by an increase in sales for these products.
The information contained herein is an opinion only, as of the date indicated, and should not be relied upon as the only important information available. Any prediction, projection or forecast on the economy, stock market, bond market or the economic trends of the markets is not necessarily indicative of the future or likely performance. The information contained herein is subject to change, incomplete, and may include information and/or data obtained from third party sources that iCapital believes, but does not guarantee, to be accurate. iCapital considers this third-party data reliable, but does not represent that it is accurate, complete and/or up to date, and it should not be relied on as such. iCapital makes no representation as to the accuracy or completeness of this material and accepts no liability for losses arising from the use of the material presented. No representation or warranty is made by iCapital as to the reasonableness or completeness of such forward-looking statements or to any other financial information contained herein.
Securities products and services are offered by iCapital Markets, an SEC-registered broker-dealer, member FINRA and SIPC, and an affiliate of iCapital, Inc. and Institutional Capital Network, Inc. These registrations and memberships in no way imply that the SEC, FINRA, or SIPC have endorsed any of the entities, products, or services discussed herein. Annuities and insurance services are provided by iCapital Annuities and Insurance Services LLC, an affiliate of iCapital, Inc. “iCapital” and “iCapital Network” are registered trademarks of Institutional Capital Network, Inc. Additional information is available upon request.
©2024 Institutional Capital Network, Inc. All Rights Reserved.


