One of the more compelling ideas for investors this year, in our view, has been the idea that you can get paid while waiting for the equity markets to find their footing and volatility to subside. Fortunately, as we wrote back in May, there are many ways for investors to earn a respectable income stream. And with the major correction in most parts of the fixed income markets, the entry levels are now a lot better than at the start of the year.
One area of the fixed income markets that warrants attention right now is municipal bonds, or “munis”. In this week’s commentary, we discuss why lower future rate hike expectations, favorable net supply dynamics, and the likely return of fund flows into the muni space mean we see any weakness as an opportunity to add to municipal bonds exposure over the coming quarter.
Three factors should be more favorable for municipal bonds
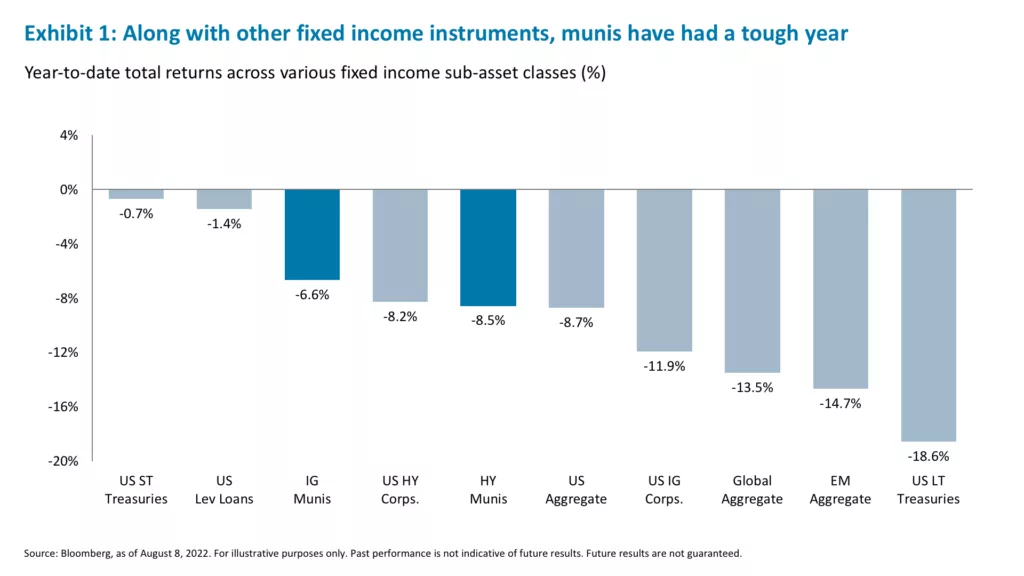
Like most fixed income investments (and equities), municipal bonds had a tough start to the year. The investment grade (IG) muni index is down 6.6% year-to-date, while high yield munis are down 8.5% (See Exhibit 1).1 This underperformance occurred as U.S. Treasury yields surged and credit spreads to IG munis widened.2
However, going forward we expect three factors to support improved muni bond performance:
1) U.S. Treasury rates. After another rock-solid payrolls report last week, most rate analysts moved to bake in another 75 basis point (bp) rate hike in September.3 We think that conclusion is premature – we are still two Consumer Price Index reports away from the September Federal Open Markets Committee meeting. The year-end 2022 consensus expectation for the two-year treasury yield has risen 30 bps since mid-July, from 3.11% to 3.41% as of August 8.4 Notably, however, the estimates for 10-year and 30-year U.S. Treasurys did not move nearly as much. For example, the consensus expectation for the year-end rate on the 10-year has only risen 13 bps.5 While both are still expected to rise between now and the end of September, yields are then expected to return to current levels by the second quarter of 2023.6 Yields are more broadly expected to remain within a range. Logically, this makes a lot of sense – markets are being forced to choose between elevated inflation and stalling growth. So, while fears of inflation being too hot (and the U.S. Federal Reserve [Fed] too hawkish) could continue to push yields higher, counteracting that are recessionary fears, which should act to push yields down. This rangebound yield environment is not a recipe for great fixed income performance but is still a much better environment than that faced in the first half of 2022 when yields only seems to move in one direction – higher.
2) Net supply. As muni yields rise and buyers return to the market (more on this below), supply dynamics will matter more. After a blockbuster gross issuance year in the muni markets in 2020 and 2021, investors expect issuance to decline 10% year-over-year in 2022.7 Importantly, net supply in munis is seasonal – it has tended to be net negative in the January to February period and from June to August, but positive from March to May and September to October when more issuers come to market.8 It will soon be September, the strong technicals of the summer months could potentially turn less supportive, and the Fed might adopt a more hawkish approach to rate rises than markets expect, all of which could push up yields (and push down prices) again. However, given the overall lower supply this year, typically net negative supply in November and December, and attractive muni yields, we would see any future rise as an opportunity to add exposure.9
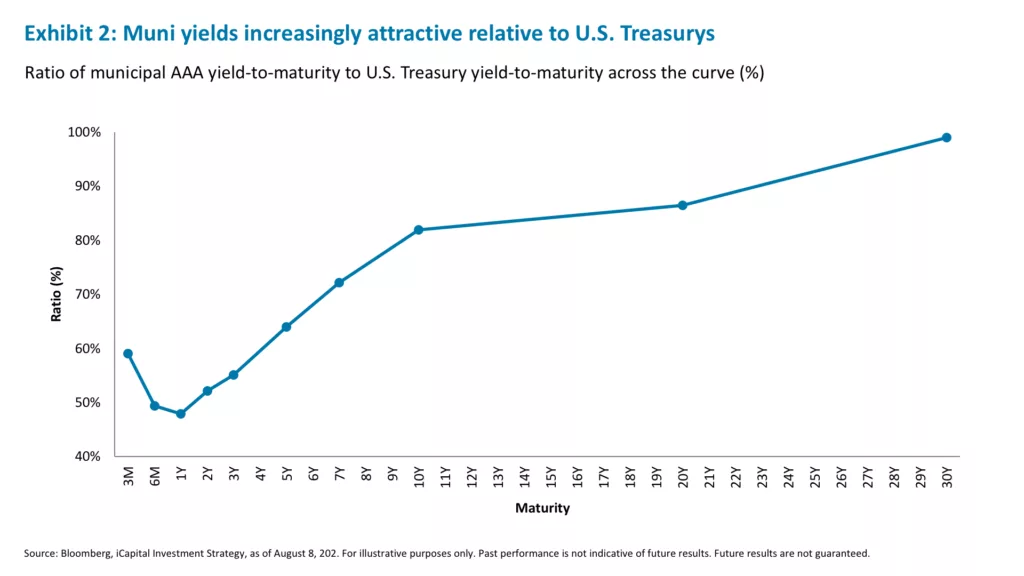
3) Fund flows. Investors have fled the muni bond market so far this year, with outflows of $81.9 billion to June 24.10 This outpaced outflows of $69.7 billion during the 2013 “taper tantrum” and the COVID-triggered outflows of $48.1 billion in 2020.11 However, in recent weeks investors have been willing to re-enter the muni markets, albeit modestly, with two weeks of inflows recorded in July.12 With the absolute and relative attractiveness of muni yields improving, particularly at the long end of the curve, and with rates hopefully stabilizing, we would expect inflows to resume.13 The 30-year AA Muni/Corporate yield-to-maturity ratio is near 86%, a level last seen in March 2020 and before that in late 2013.14 Relative to Treasurys, the AAA muni ratio is above 80% for all maturities above 10 years (See Exhibit 2), up from January 2022, when the ratio was around 65% for 10-year maturities.15 Finally, not only are munis attractive to individuals but banks and insurers are finding pockets of value based on taxable equivalent yields in longer date tax-exempt munis.
Default concerns minimal with state finances in solid shape
It is commonplace to worry about the public finances of state and local governments. However, by some metrics they are as healthy as they have been in years. For example, state and local tax revenue is growing strongly, rising 13.2% year-over-year in the trailing four-quarter period ending March 2022.16 Additionally, strong tax revenues (across personal income, corporate income, sales, and property) have allowed many states to accumulate respectable reserve funds, with the median state balance as a share of general spending at a record level of 11.6%, well above the 20-year average median level of 4.7% (See Exhibit 3).17
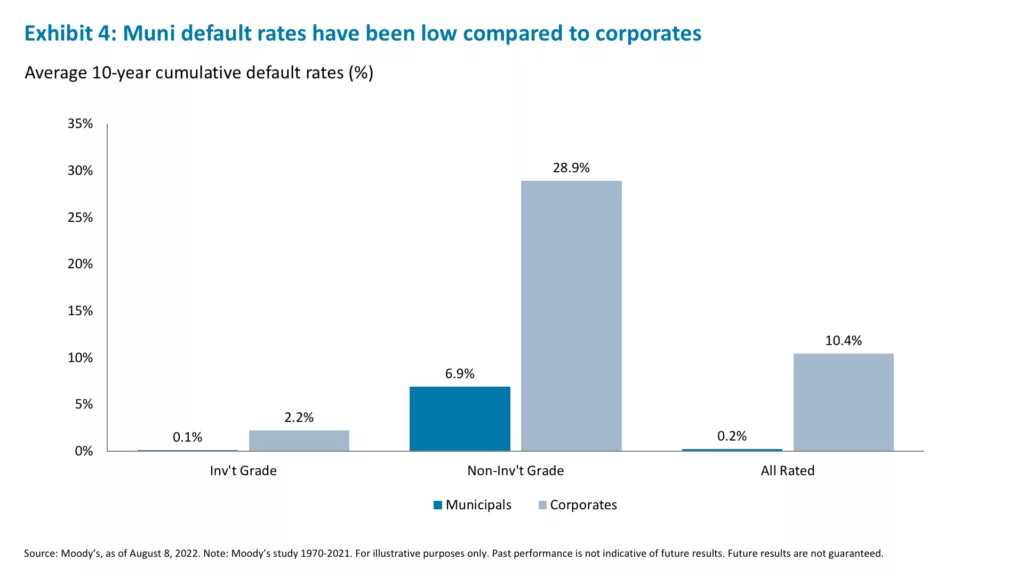
Of course, not all states are in equally solid financial shape. States like Alaska, Connecticut, Hawaii, and New Jersey, for example, stand out for their elevated proportion of net pension and debt liabilities as a percentage of GDP, while a state like Mississippi, reliant on sales tax as a major source of revenue, reported a 50% year-over-year decline in 12-month trailing tax collections (an outlier) and has a total reserve balance of only 6% of revenues.18 Still, despite the variability in states’ finances over the years, default rates for municipal bonds have been remarkably low relative to corporates: The average 10-year cumulative default rate on IG munis is a mere 0.1%, compared with 2.2% for IG corporates (See Exhibit 4).19 There is an even larger gap for high yield bonds, with a high yield muni default rate of 6.9%, versus 28.9% for corporates.20 The ability to raise taxes, restructure debt, and/or have specific revenue streams earmarked for certain bonds can help municipalities limit defaults.
Munis an increasingly attractive portfolio income provider
In a market as uncertain as the one investors currently face, income-producing assets such as munis are increasingly attractive. Their lower historical default profile relative to corporate bonds, increasingly attractive pricing, and favorable taxable equivalent yields make them a compelling option today for investors looking to add income to their portfolio.
1. Bloomberg, as of August 8, 2022.
2. Ibid.
3. Ibid.
4. Bloomberg, iCapital Investment Strategy, as of August 8, 2022.
5. Ibid.
6. Ibid.
7. Bloomberg, JPMorgan Fixed Income Strategy, as of June 24, 2022.
8. Bloomberg, iCapital Investment Strategy, as of August 8, 2022.
9. Ibid.
10. Refinitiv Lipper US Flow, JPMorgan, as of June 24, 2022.
11. Ibid.
12. ICI, as of July 27, 2022.
13. Bloomberg, iCapital Investment Strategy, as of August 8, 2022.
14. Ibid.
15. Bloomberg, iCapital Investment Strategy, as of August 8, 2022. Note: AAA muni ratio is calculated by taking the yield-to-maturity (YTM) on a AAA-rated muni and the YTM on a Treasury with the corresponding maturity.
16. Bloomberg, U.S. Census Bureau, iCapital Investment Strategy, as of August 8, 2022.
17. National Association of State Budget Officers, iCapital Investment Strategy, as of June 16, 2022.
18. Bloomberg, U.S. Census Bureau, JPMorgan, iCapital Investment Strategy, as of August 8, 2022.
19. Moody’s, as of August 8, 2022. Note: Moody’s study 1970-2021.
20. Ibid.
IMPORTANT INFORMATION
The material herein has been provided to you for informational purposes only by iCapital, Inc. (“iCapital”). This material is the property of iCapital and may not be shared without the written permission of iCapital. No part of this material may be reproduced in any form, or referred to in any other publication, without express written permission of iCapital.
This material is provided for informational purposes only and is not intended as, and may not be relied on in any manner as, legal, tax or investment advice, a recommendation, or as an offer to sell, a solicitation of an offer to purchase or a recommendation of any interest in any fund or security. You should consult your personal accounting, tax and legal advisors to understand the implications of any investment specific to your personal financial situation. This material does not intend to address the financial objectives, situation or specific needs of any individual investor. Alternative investments are complex, speculative investment vehicles and are not suitable for all investors.
The information contained herein is an opinion only, as of the date indicated, and should not be relied upon as the only important information available. Any prediction, projection or forecast on the economy, stock market, bond market or the economic trends of the markets is not necessarily indicative of the future or likely performance. The information contained herein is subject to change, incomplete, and may include information and/or data obtained from third party sources that iCapital believes, but does not guarantee, to be accurate. iCapital considers this third-party data reliable, but does not represent that it is accurate, complete and/or up to date, and it should not be relied on as such. iCapital makes no representation as to the accuracy or completeness of this material and accepts no liability for losses arising from the use of the material presented. No representation or warranty is made by iCapital as to the reasonableness or completeness of such forward-looking statements or to any other financial information contained herein.
Securities products and services are offered by iCapital Markets, an SEC-registered broker-dealer, member FINRA and SIPC, and an affiliate of iCapital, Inc. and Institutional Capital Network, Inc. These registrations and memberships in no way imply that the SEC, FINRA, or SIPC have endorsed any of the entities, products, or services discussed herein. Annuities and insurance services are provided by iCapital Annuities and Insurance Services LLC, an affiliate of iCapital, Inc. “iCapital” and “iCapital Network” are registered trademarks of Institutional Capital Network, Inc. Additional information is available upon request.
© 2023 Institutional Capital Network, Inc. All Rights Reserved.


