
With the S&P 500 only 4% away from its all-time high, economic growth, particularly in soft data, starting to rebound, and trade policy moving in the right direction, it appears the worst-case scenario may be avoided. But now, the question is, can this trend continue? Yes, we think because of some positive second half of the year tailwinds that could support the economy, including the extension of the Tax Cuts and Jobs Act (TCJA), as well as a resilient U.S. consumer.
While the outlook has clearly improved since Liberation Day, there are still some risks to the economy and markets. Specifically, we are watching the sharp rise in yields, which could continue given ongoing budget deficit concerns.
As the outlook has evolved since early April, we find ourselves asking whether it is time to rotate into cyclical assets. We think the answer is yes but would do so selectively. In this environment we would favor sectors such as financials and industrials. However, we still think defensive sectors such as utilities can perform well given the supportive fundamentals of the AI Power theme. And in alternatives, we would continue to favor infrastructure, specifically digital infrastructure which should also benefit from AI and the build-out of data centers.
The worst-case scenario is likely avoided – for now
With the Trump administration having paused the implementation of reciprocal tariff rates, reaching a trade agreement with the UK and lowering the tariff rates on China and announcing a 90-day pause, it seems that at least for now the worst-case scenario of a recession and a supply shock has been avoided.
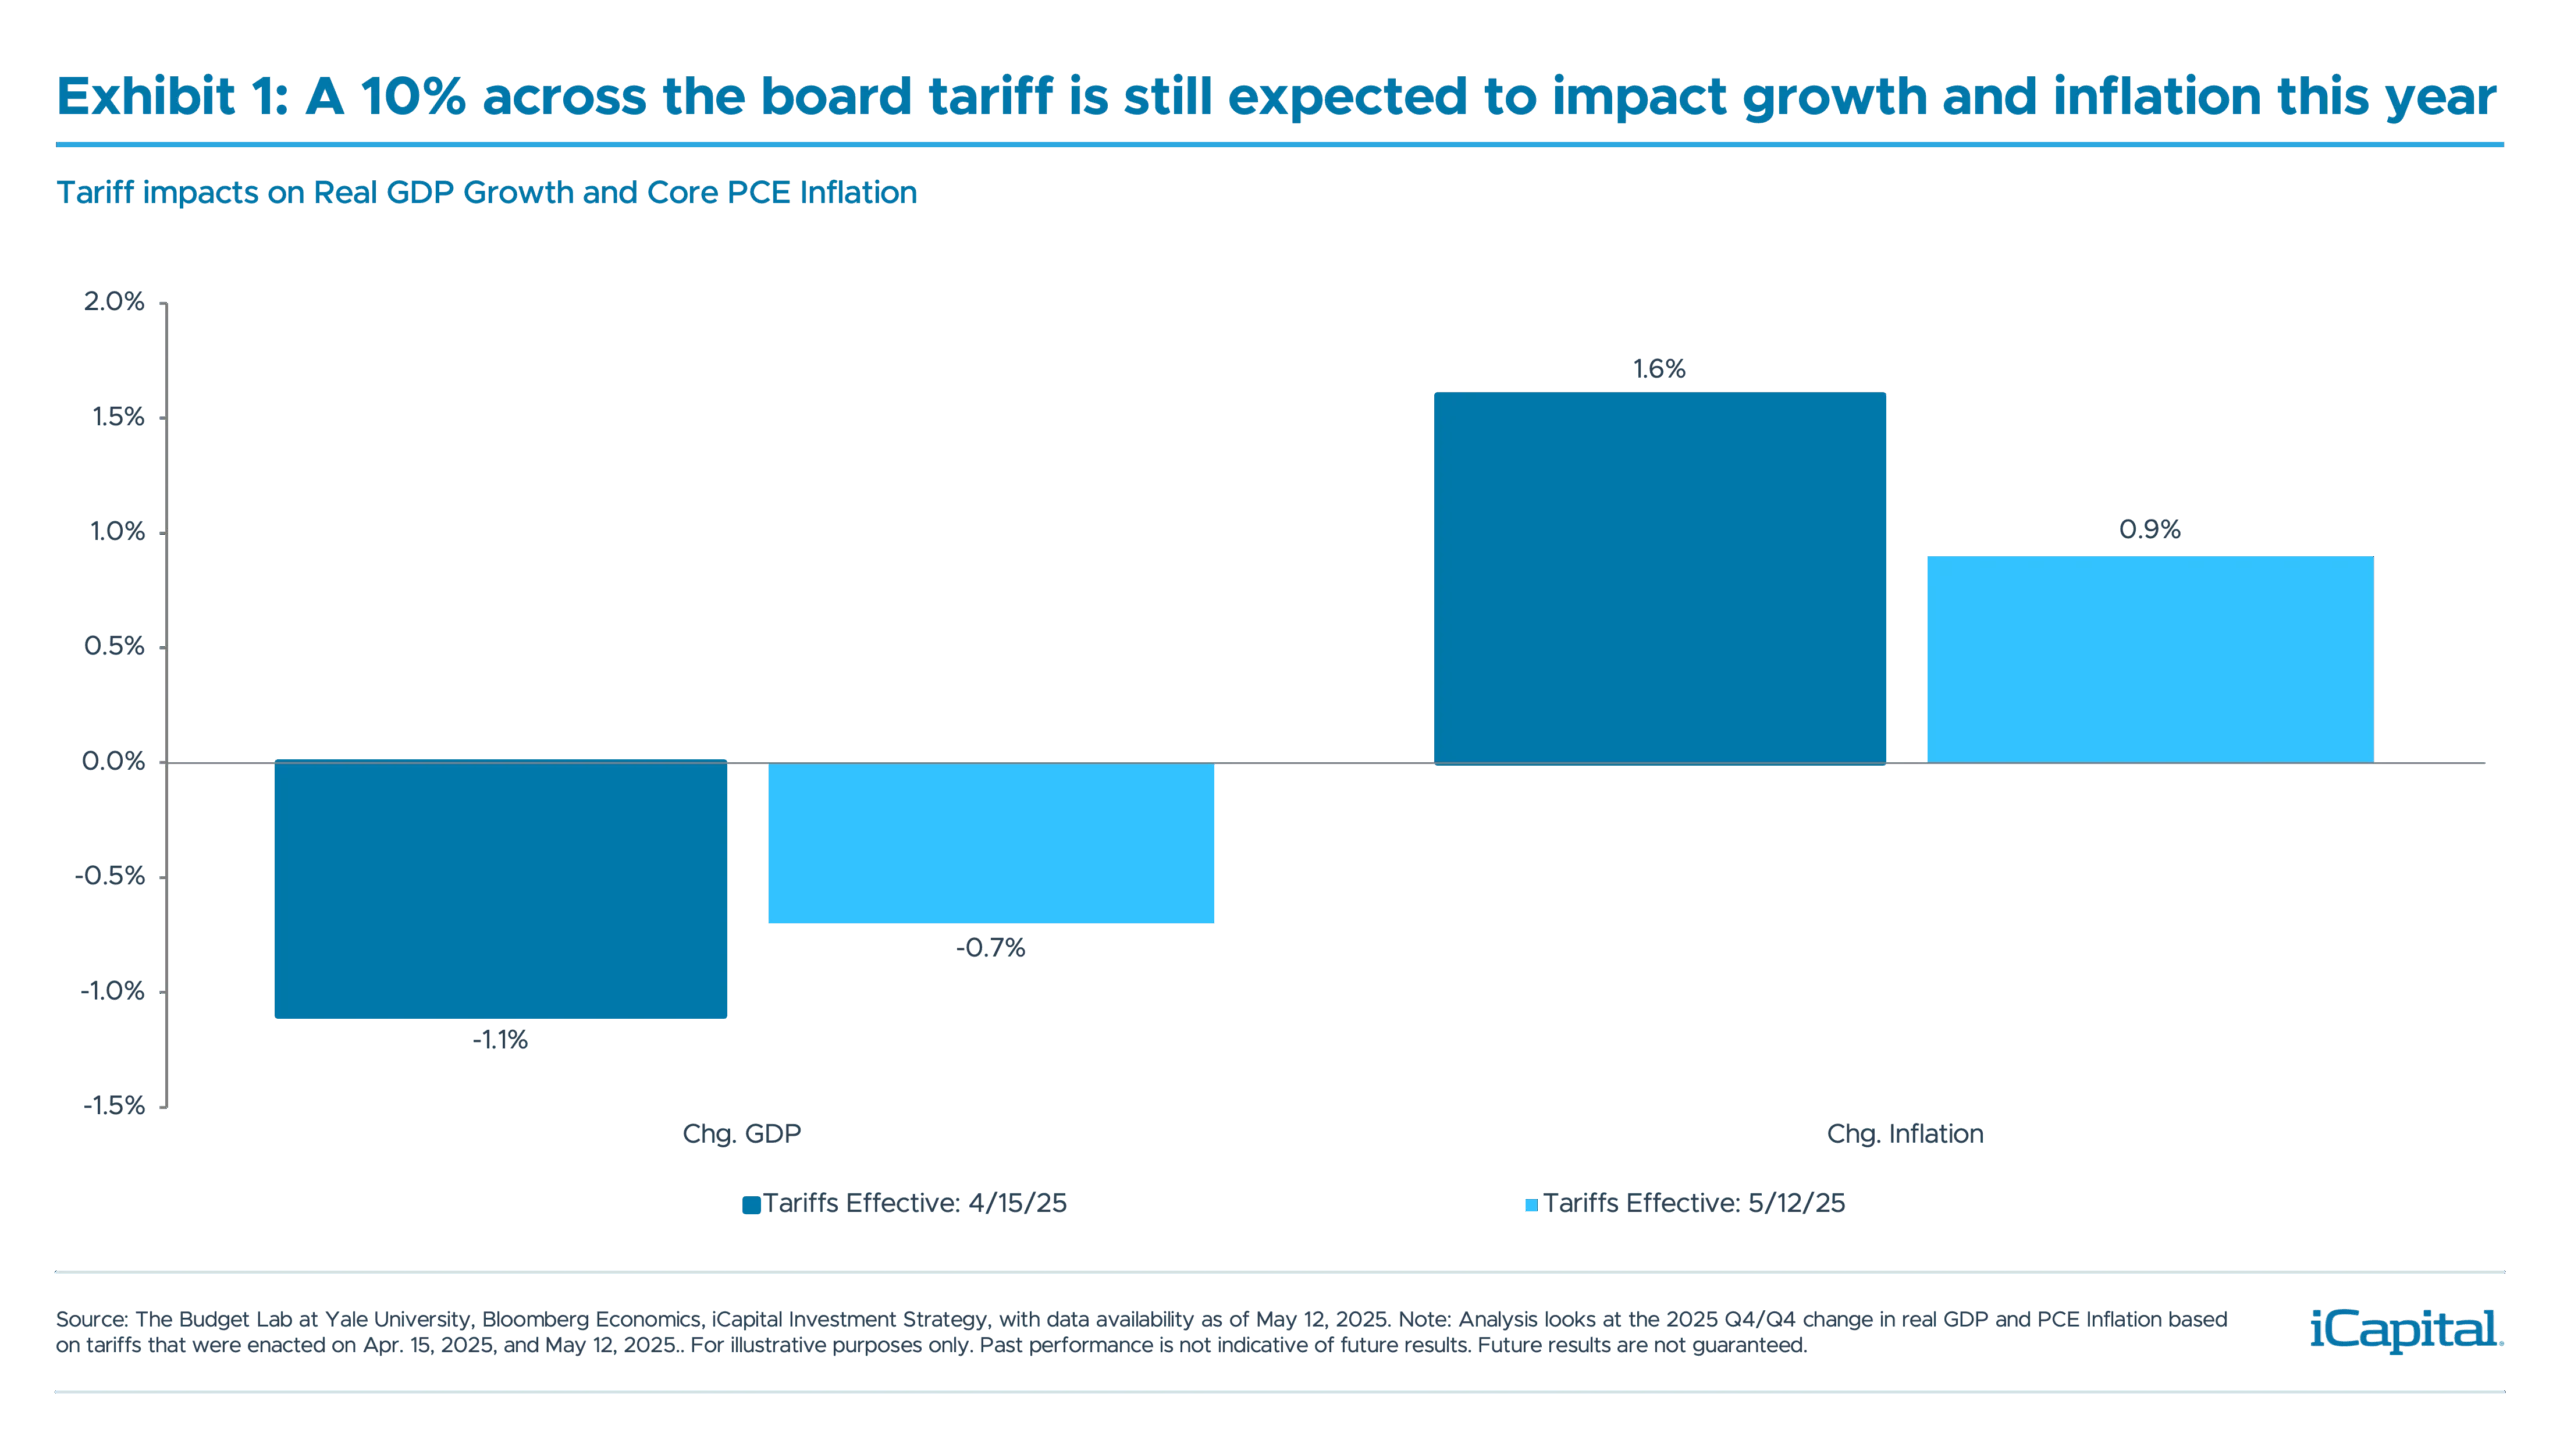
After the 90-day pause and lowering the reciprocal rates, the effective tariff rate has fallen from roughly 25% to 11%, which is a more manageable level for the markets and the economy.1 While a 10% across the board tariff could still impact growth and inflation this year, it will be less severe than what was expected after the Liberation Day announcement, as seen in Exhibit 1.
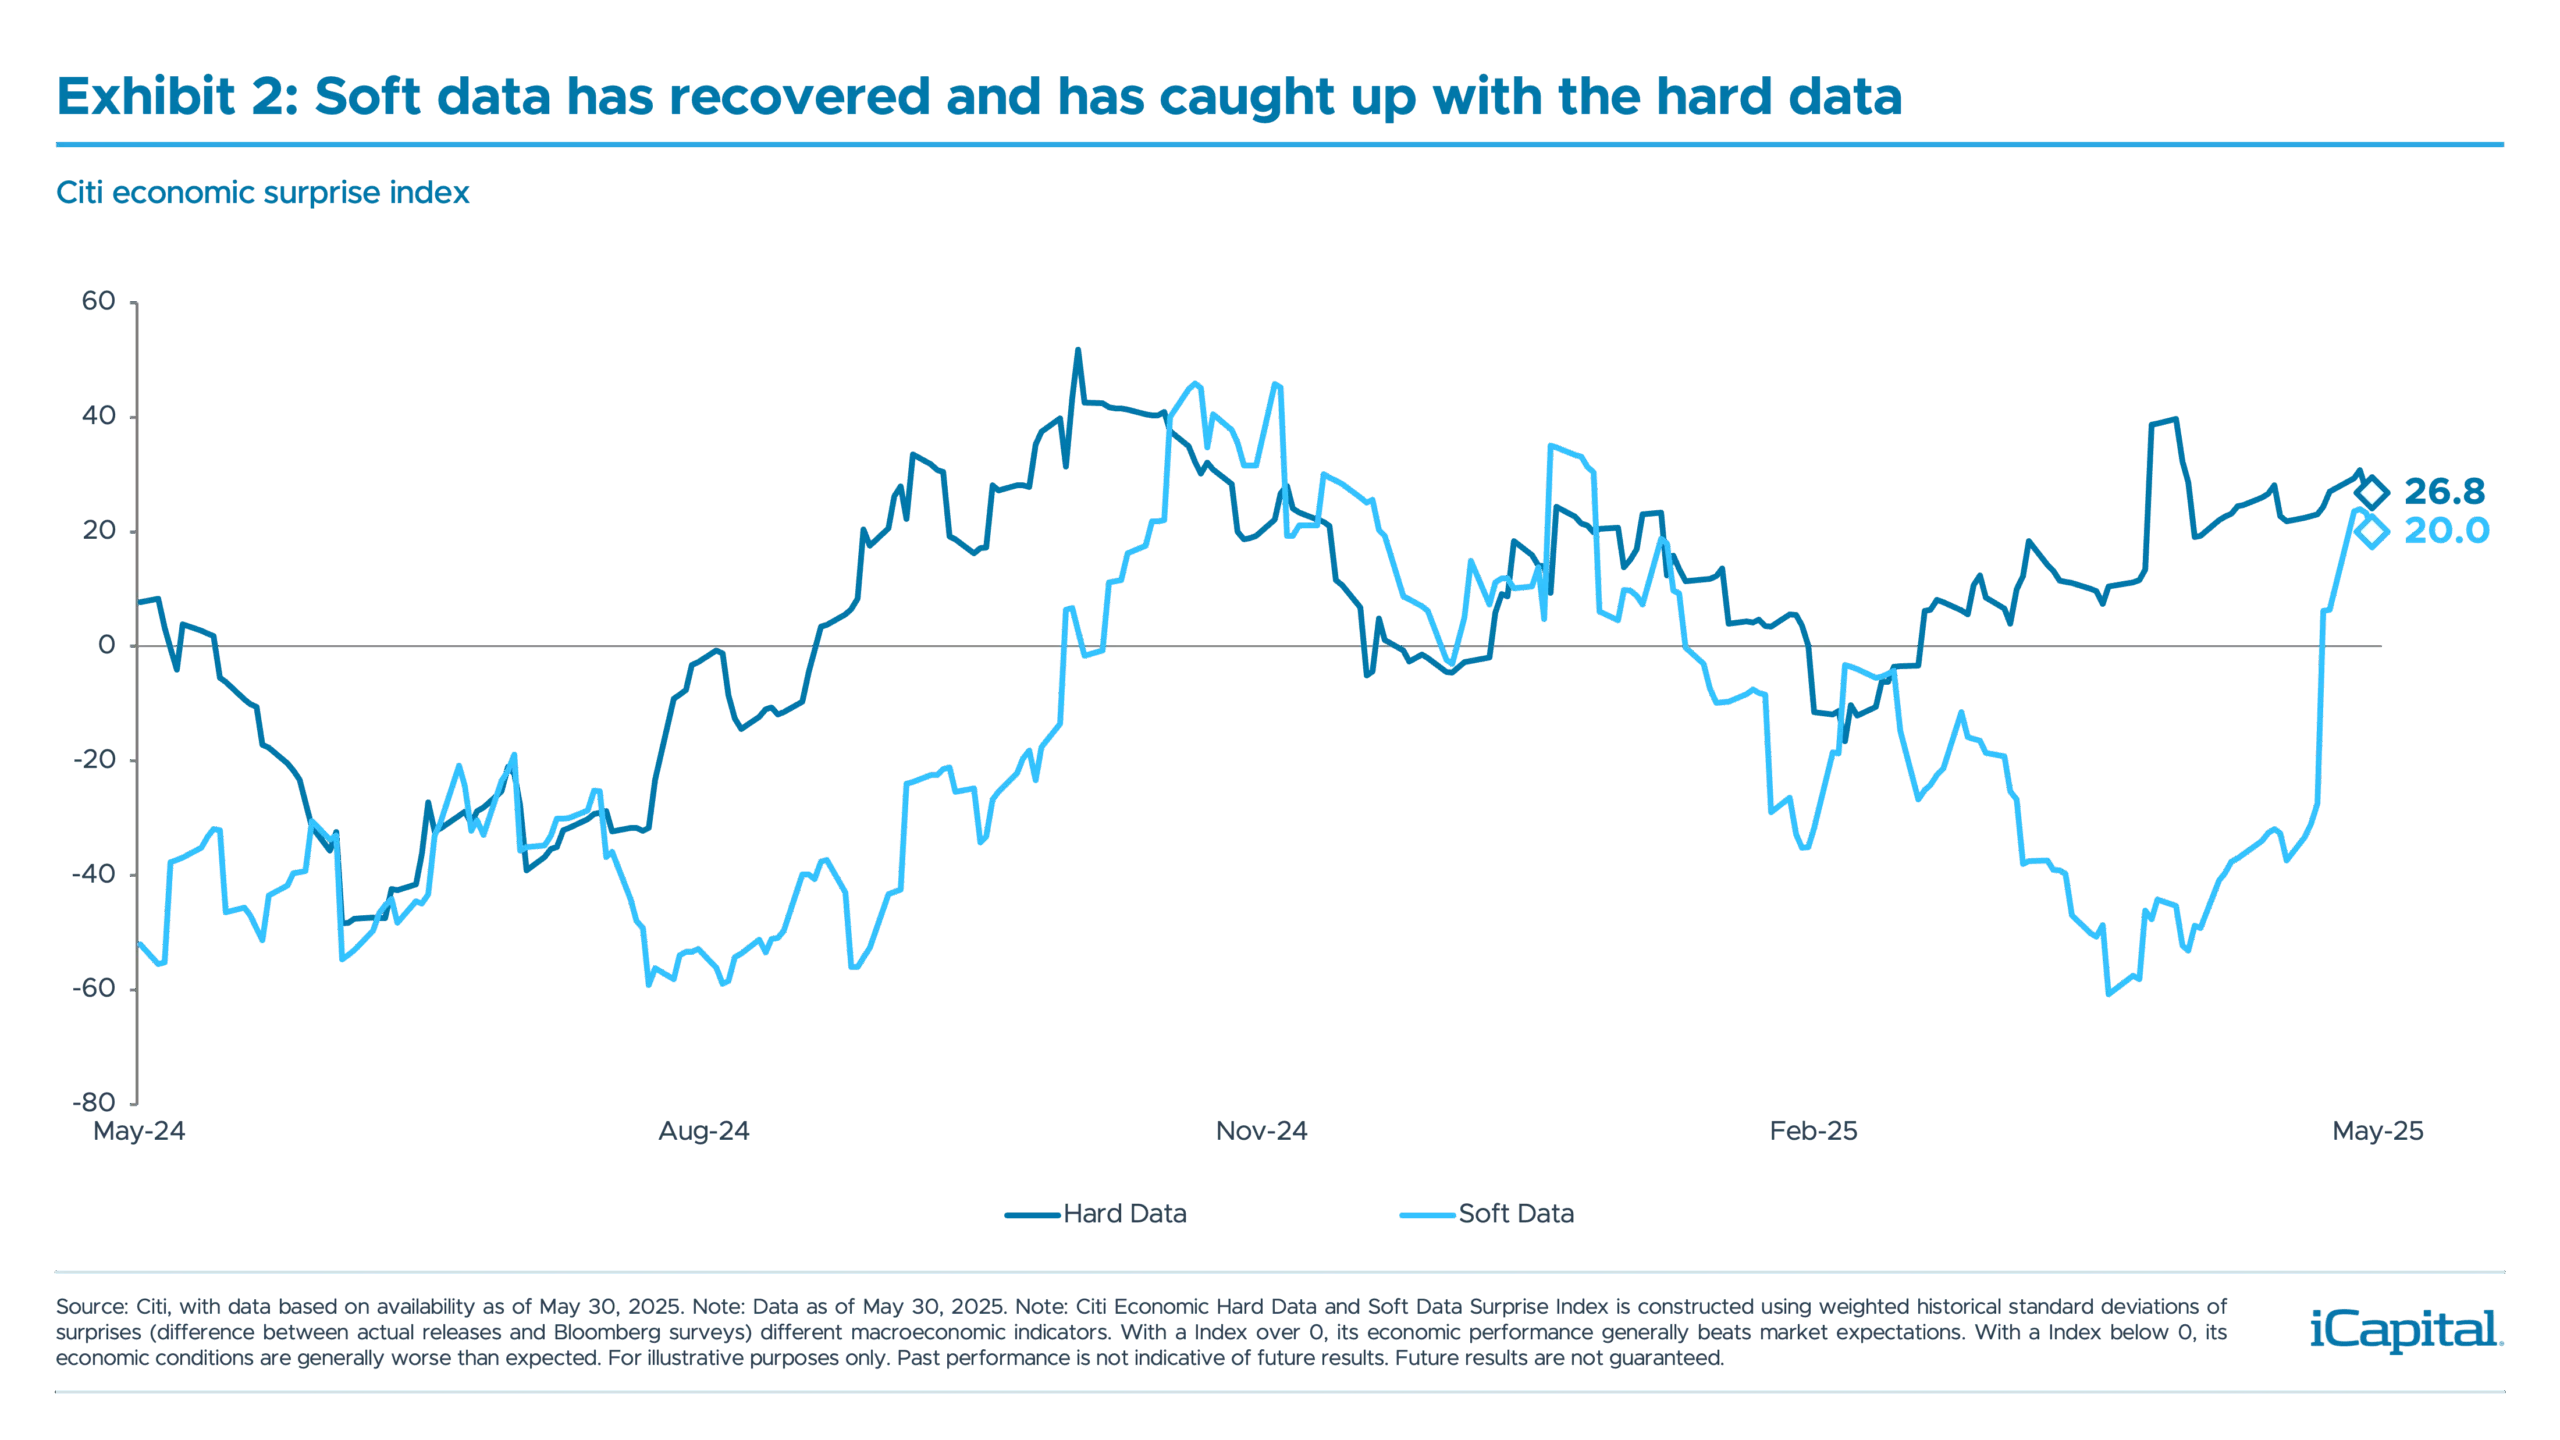
 While the administration’s tariffs led to a wide divergence in hard data vs. soft data, since the positive trade announcements, soft data has started to recover. Indeed, the soft data economic surprise index has largely caught up with the hard data, as seen in Exhibit 2. The recovery in soft data has been driven by a handful of economic data points over the last week, including the Conference Board Consumer Confidence Expectations measure and the Dallas Fed regional PMI – both saw their largest monthly increases going back to June 2009 and May 2020, respectively.2 Although soft data can be volatile, we still think there is some signal in this data, as the survey period occurred after the announcements on the 90-day pause, the UK trade agreement and the preliminary agreement with China.
 The consumer remains very focused on tariffs, as they are often cited as the primary concern in these surveys. Therefore, if trade deals continue to get cut – the administration keeps mentioning how they are close to reaching more deals – this should further support the uptick in soft data, and by extension the hard data.
Factors that can continue to support economic growth for the remainder of the year
While the 10% universal tariff – if it remains in place – is still likely to weigh on growth this year, the extension of the TCJA could offset some of this drag. With the House passing the bill, and sending it to the Senate for a mark-up, it appears the timeline of events are moving more quickly than anticipated, as we discussed here. In fact, the bill could potentially be passed into law as soon as mid-July. The sooner this extension gets passed, the more likely it can support growth this year. Indeed, it is currently estimated to boost GDP growth by 20bps in 2025.3 Importantly, the extension is not just expected to boost growth in the near-term, but it could also boost long-run GDP growth by 1.1%.4
In addition, a resilient consumer could also support growth in the second half of the year. Despite the deterioration in consumer sentiment since the start of the year, consumption has held up. In fact, Q1 personal consumption expanded at a 1.2% quarter-over-quarter (QoQ)seasonally annualized rate, even though headline GDP contracted.5 While credit card data has cooled since the start of May, credit card spending has grown by 2.1% since last year.6 Finally, a number of banks also confirmed on their Q1 earnings calls that the consumer remained resilient and that spending had either remained stable, or increased from current levels.7
We think this trend should continue, especially as gasoline prices have fallen by 3% from their April high and food prices declined by -0.1% month-over-month (MoM) in the last CPI report.8 With gas and food accounting for approximately 18% of the consumer’s wallet, lower prices could serve as an economic tailwind, allowing the consumer to reallocate the savings elsewhere.9
But there are still headwinds to the outlook
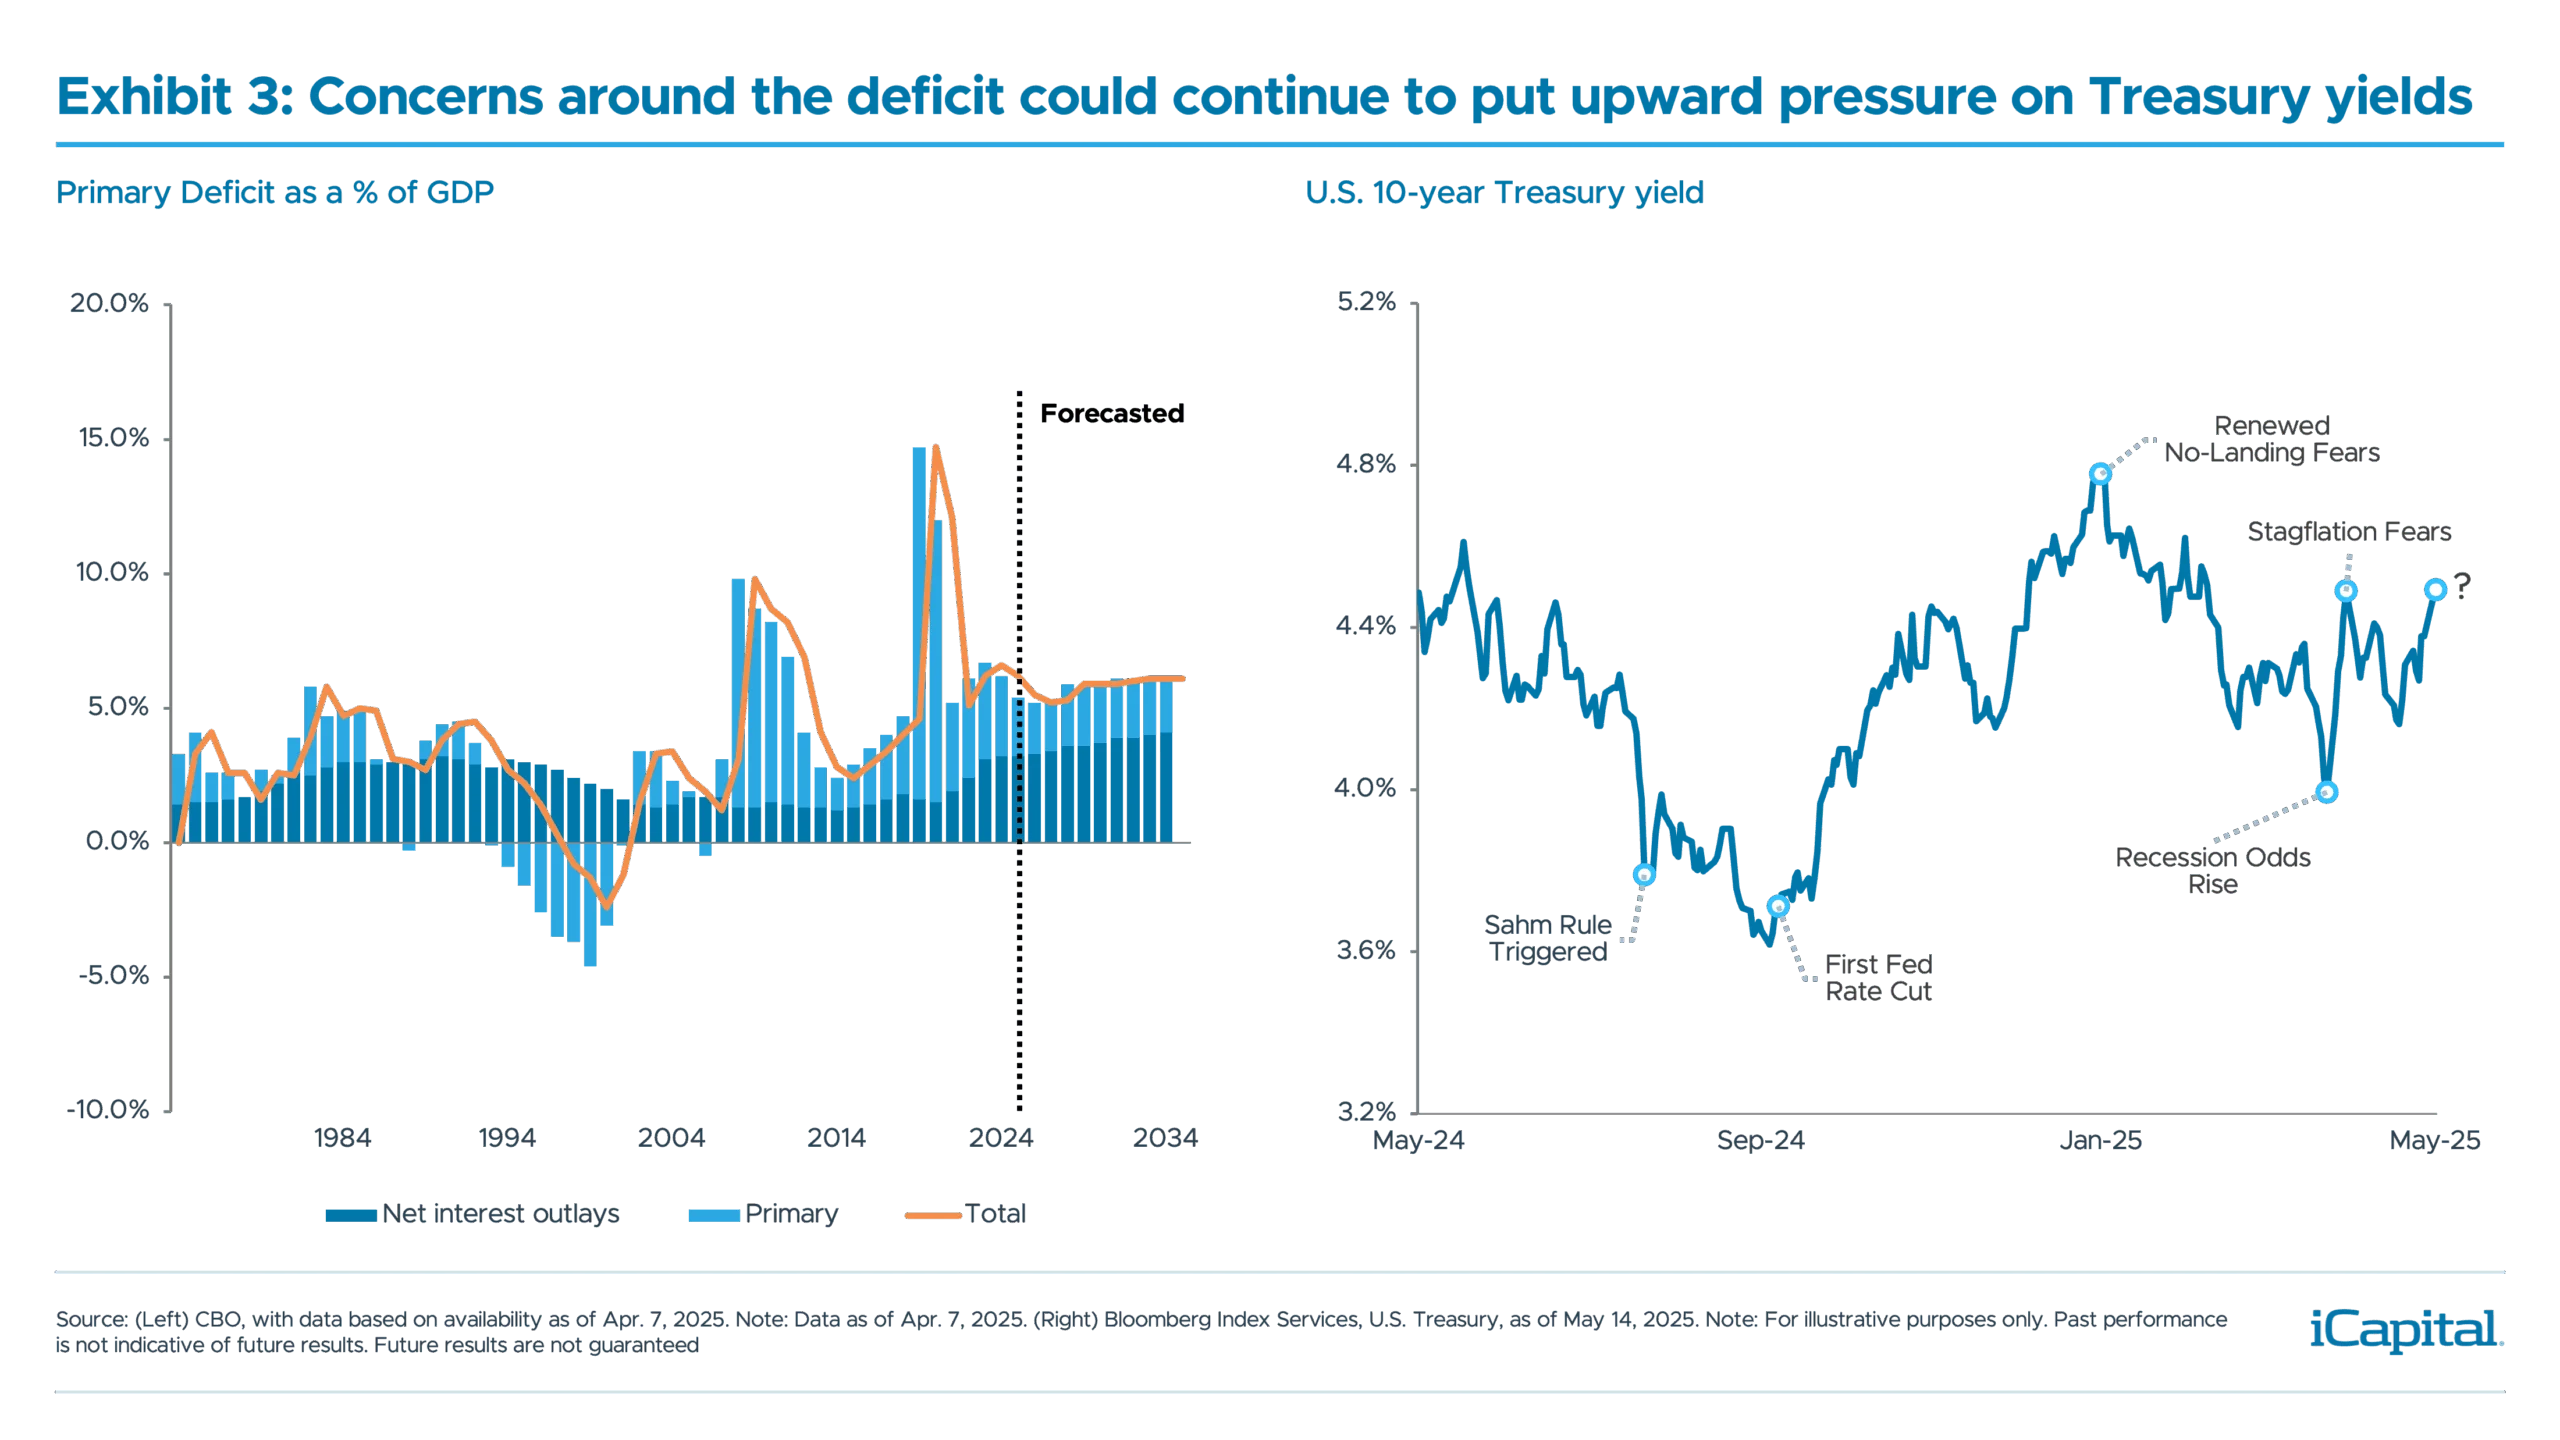
Despite appearing to have avoided the worst-case scenario, risks to the outlook remain. We believe one of the primary hurdles for markets over the next few months will be a continued rise in rates.
The 10yr. Treasury yield has risen by about 24 bps during the month of May, but at one point had reached 4.60% on the back of a weak 20yr. auction, an increase of 11bps, before declining.10 While the sharp rise in rates has started to weigh on parts of the market – namely interest rate sensitive areas – we think the 10yr. yield reaching 4.7% would be a level that would broadly weigh on equity markets. If the 10yr. Treasury yield were to reach that level, it would mark a 2 standard deviation monthly increase – a rate of change that has historically weighed on markets.11
Therefore, if rates rise on better-than-expected data or renewed concerns about an expansion of the deficit, this will likely present a headwind to markets.
 Is it time to rotate your portfolio into cyclical assets? We think so, but selectively
Avoiding the worst-case scenario, and with the soft data now starting to catch-up to the hard data, we have been asking ourselves if it makes sense to maintain our portfolio preferences. As we discussed earlier in the year (here), we have had a preference towards defensive sectors like utilities and real estate, but as consumer confidence and other survey data recovered, cyclical sectors and assets have been outperforming defensives.12 With tailwinds such as the extension of the TCJA and a resilient consumer, this could continue to support this trend, but we would be selective in our preferences.
While we would consider rotating out of some defensive areas, not all defensive assets are created equal. More specifically, real estate may weaken because of rates remaining higher for longer, but we still think utilities could perform well in this environment. Indeed, utilities should benefit from increasing power demand, which grew at 3.9% year-over-year (YoY) in the first quarter.13 In addition, a number of companies this earnings season also stated how they continue to see strong demand for power.
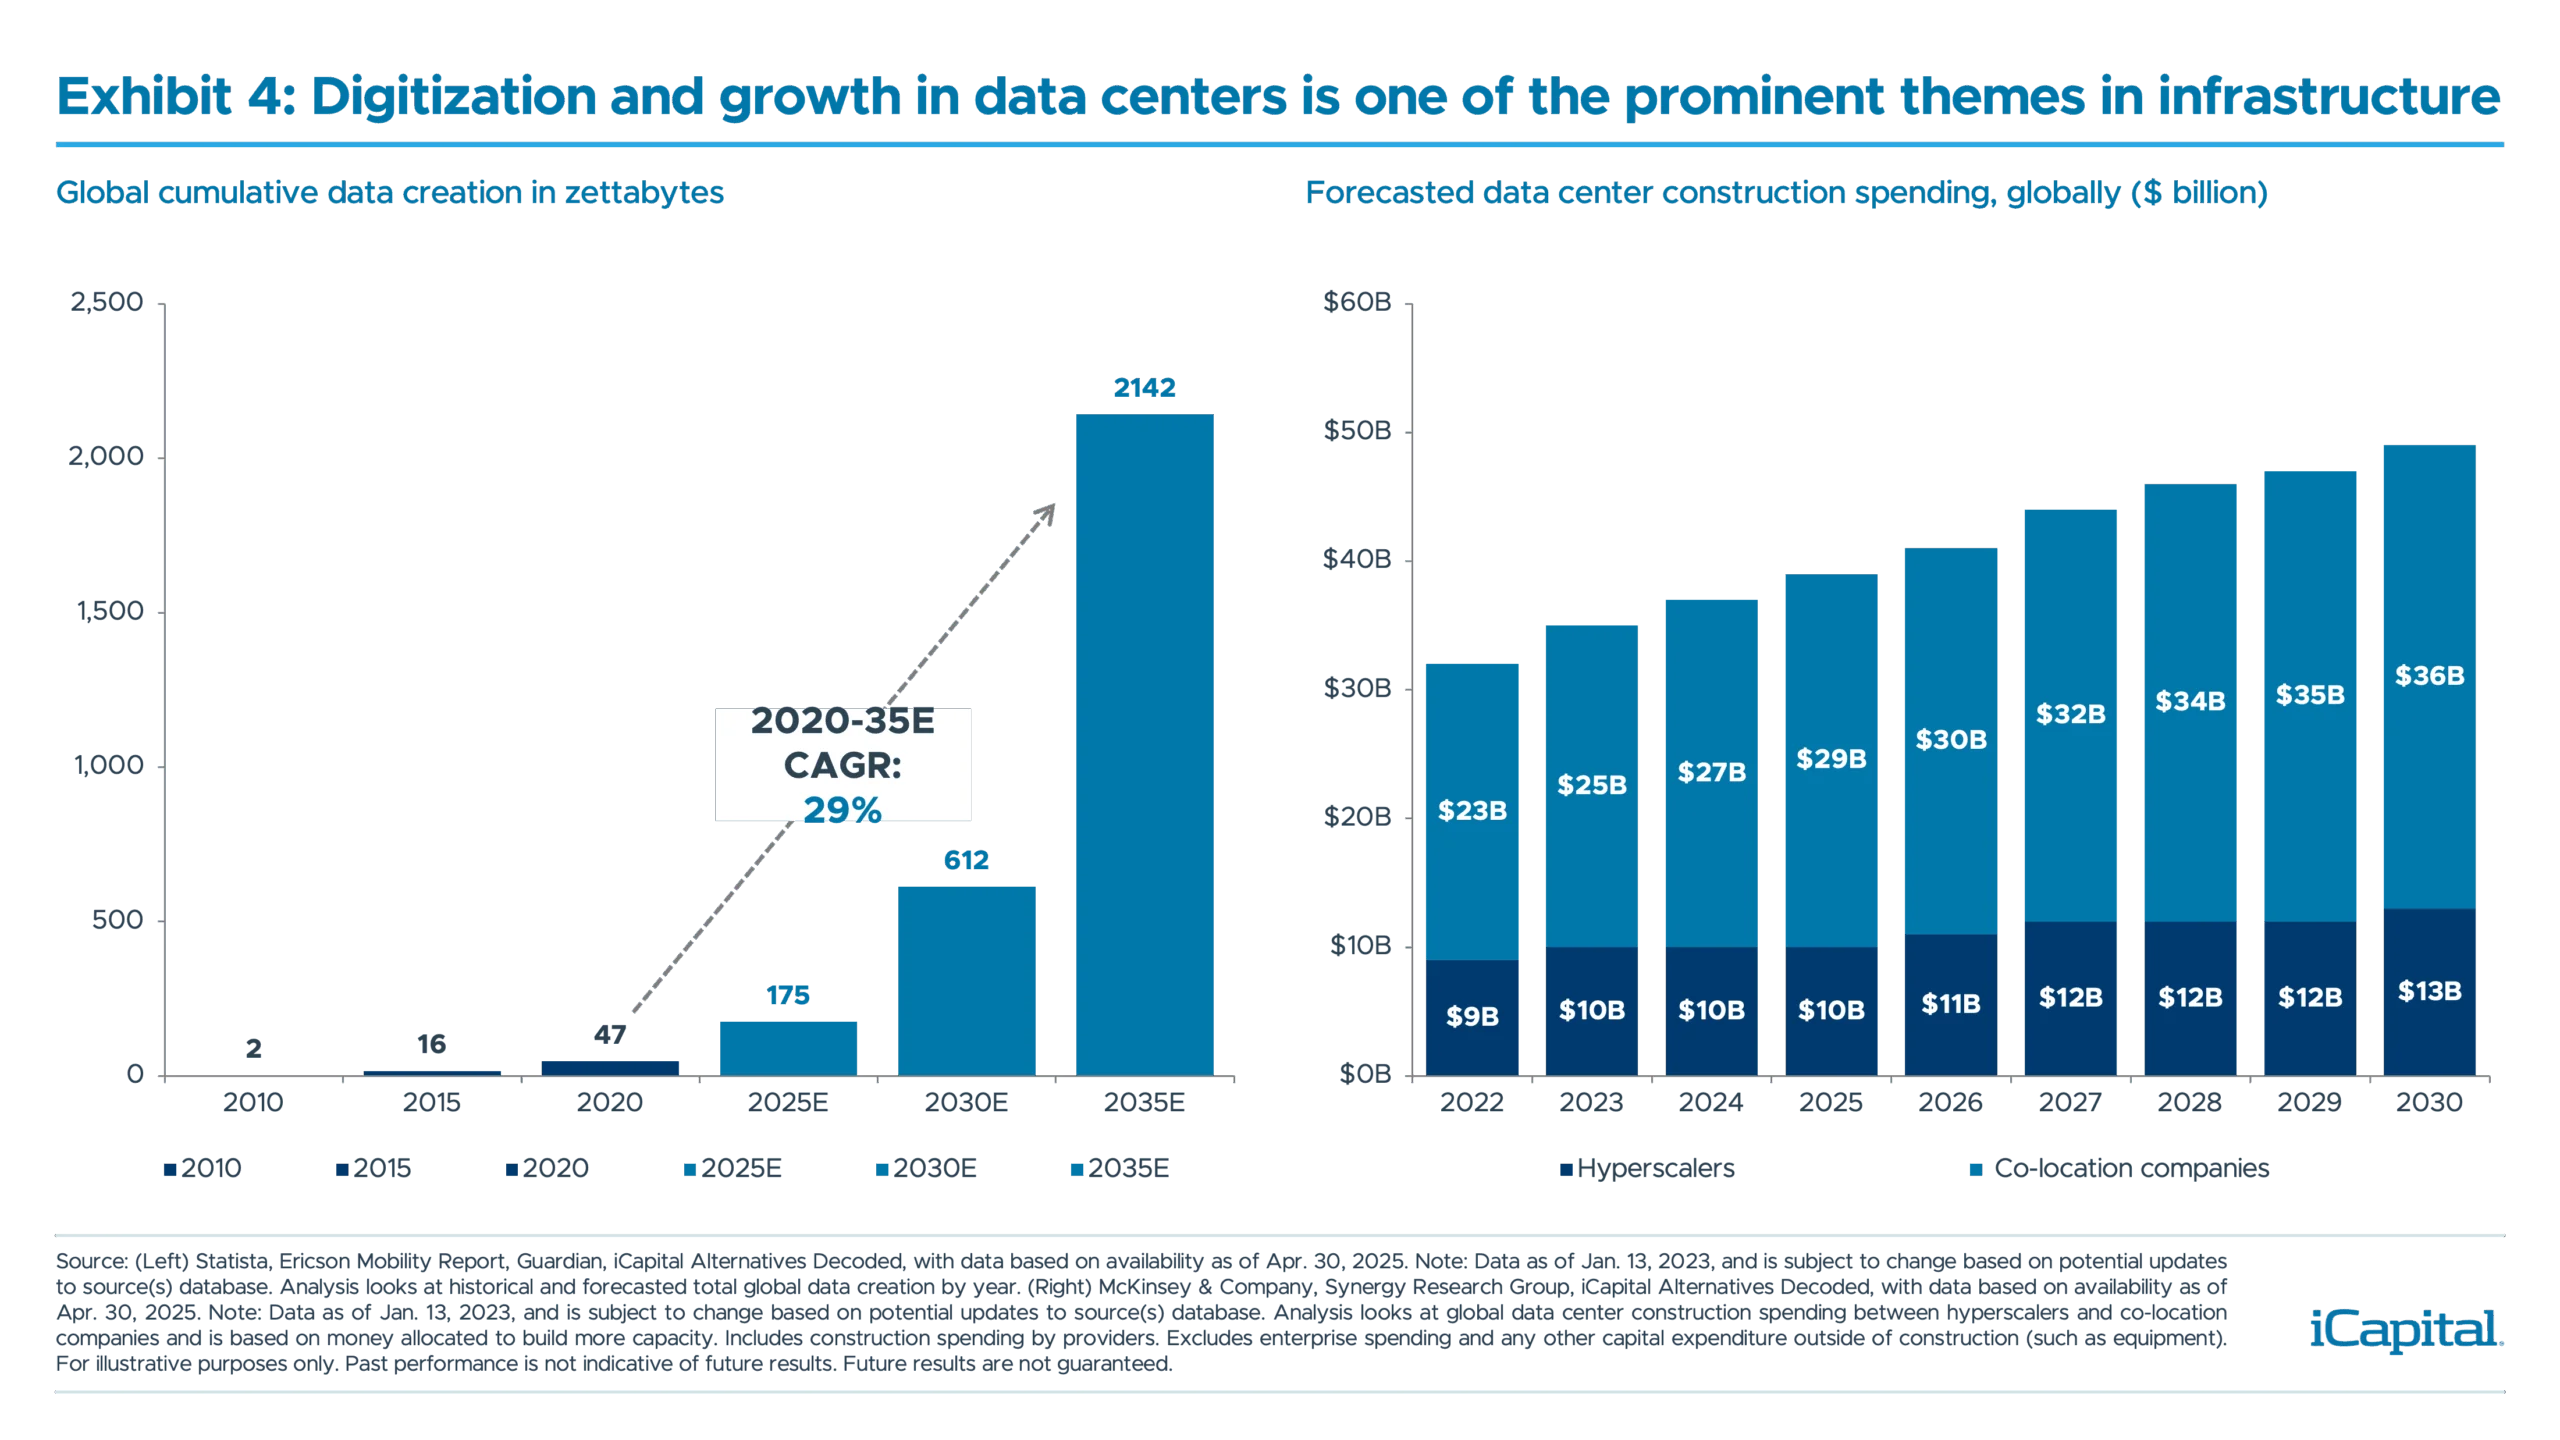
The positive commentary from companies on AI was capped off by Nvidia’s earnings, on May 28th.14 Given the positive earnings momentum and commentary this reporting season, this should support AI beneficiaries, like AI Power and Software, for the remainder of the year. Furthermore, we continue to think there are private market opportunities to access this theme. Indeed, we think infrastructure, specifically digital infrastructure, will benefit from the build-out of data centers. In fact, data center construction has already added one percentage point to GDP growth in the first quarter – a trend we would expect to continue.15
 We also think this environment would benefit areas like financials and industrials. Both sectors should benefit from a pick-up in growth, but we think financials in particular should be supported by a resilient U.S. consumer and improved confidence. If labor market data remains healthy – initial jobless claims remain low – this should help prevent any uptick in defaults. To date, we have not really seen a meaningful increase in net charge offs, despite the rising risk of recession from the Trump administration’s trade policy.16 Finally, we think the administration shifting their focus from tariffs to taxes and deregulation will also serve as a tailwind for financials for the remainder of the year.
For industrials, we think they should benefit from a pick-up in manufacturing activity, especially as 1) the recent pick-up in activity has been driven by leading components of the Purchasing Managers’ Index (PMI) – new orders expanded at their fastest rate in 15-months highlighting the strength in domestic demand17 and 2) the administration’s desire to bring back manufacturing to the U.S.
Given this, investors may consider tilting parts of their portfolio towards cyclical assets which should benefit from a continued recovery in soft data, especially relative to any defensive allocations.
- JPMorgan, as of May 28, 2025
- Conference Board, Dallas Fed, as of May 28, 2025.
- Piper Sandler, as of May 16, 2025.
- Tax Foundation, as of Feb. 26, 2025.
- Bureau of Economic Analysis, as of May 29, 2025.
- JP Morgan, as of May 20, 2025.
- Citi, JP Morgan, Wells Fargo, as of Apr. 15, 2025.
- American Automobile Association and Bureau of Labor Statistics, as of May 29, 2025. 95
- Bureau of Labor Statistics, as of Sep. 25, 2024.
- Bloomberg Index Services, as of May 28, 2025.
- Bloomberg Index Services and Goldman Sachs, as of May 29, 2025.
- S&P Global, as of May 28, 2025.
- Goldman Sachs, as of May 28, 2025.
- Nvidia, as of May 29, 2025.
- Apollo, Bureau of Economic Analysis, as of May 28, 2025.
- Company data, as of May 29, 2025.
- Apollo, Bureau of Economic Analysis, as of May 28, 2025.
INDEX DEFINITIONS
S&P 500 Index: The S&P 500 is widely regarded as the best single gauge of large-cap U.S. equities. The index includes 500 of the top companies in leading industries of the U.S. economy and covers approximately 80% of available market capitalization.
S&P 500 Real Estate Index: The S&P Real Estate Sector Index, part of the S&P 500, measures the performance of companies classified in the Global Industry Classification Standard (GICS) Real Estate sector, including real estate management and development, and REITs (excluding mortgage REITs).
S&P 500 Utilities Index: Standard and Poor's 500 Utilities Index is a capitalization-weighted index that tracks the performance of utility companies within the S&P 500, providing a view of energy, water, and electric service providers.
IMPORTANT INFORMATION
The material herein has been provided to you for informational purposes only by Institutional Capital Network, Inc. (“iCapital Network”) or one of its affiliates (iCapital Network together with its affiliates, “iCapital”). This material is the property of iCapital and may not be shared without the written permission of iCapital. No part of this material may be reproduced in any form, or referred to in any other publication, without express written permission of iCapital.
This material is provided for informational purposes only and is not intended as, and may not be relied on in any manner as, legal, tax or investment advice, a recommendation, or as an offer or solicitation to buy or sell any security, financial product or instrument, or otherwise to participate in any particular trading strategy. This material does not intend to address the financial objectives, situation, or specific needs of any individual investor. You should consult your personal accounting, tax and legal advisors to understand the implications of any investment specific to your personal financial situation.
ALTERNATIVE INVESTMENTS ARE CONSIDERED COMPLEX PRODUCTS AND MAY NOT BE SUITABLE FOR ALL INVESTORS. Prospective investors should be aware that an investment in an alternative investment is speculative and involves a high degree of risk. Alternative Investments often engage in leveraging and other speculative investment practices that may increase the risk of investment loss; can be highly illiquid; may not be required to provide periodic pricing or valuation information to investors; may involve complex tax structures and delays in distributing important tax information; are not subject to the same regulatory requirements as mutual funds; and often charge high fees. There is no guarantee that an alternative investment will implement its investment strategy and/or achieve its objectives, generate profits, or avoid loss. An investment should only be considered by sophisticated investors who can afford to lose all or a substantial amount of their investment.
iCapital Markets LLC operates a platform that makes available financial products to financial professionals. In operating this platform, iCapital Markets LLC generally earns revenue based on the volume of transactions that take place in these products and would benefit by an increase in sales for these products.
The information contained herein is an opinion only, as of the date indicated, and should not be relied upon as the only important information available. Any prediction, projection or forecast on the economy, stock market, bond market or the economic trends of the markets is not necessarily indicative of the future or likely performance. The information contained herein is subject to change, incomplete, and may include information and/or data obtained from third party sources that iCapital believes, but does not guarantee, to be accurate. iCapital considers this third-party data reliable, but does not represent that it is accurate, complete and/or up to date, and it should not be relied on as such. iCapital makes no representation as to the accuracy or completeness of this material and accepts no liability for losses arising from the use of the material presented. No representation or warranty is made by iCapital as to the reasonableness or completeness of such forward-looking statements or to any other financial information contained herein.
Securities products and services are offered by iCapital Markets, an SEC-registered broker-dealer, member FINRA and SIPC, and an affiliate of iCapital, Inc. and Institutional Capital Network, Inc. These registrations and memberships in no way imply that the SEC, FINRA, or SIPC have endorsed any of the entities, products, or services discussed herein. Annuities and insurance services are provided by iCapital Annuities and Insurance Services LLC, an affiliate of iCapital, Inc. “iCapital” and “iCapital Network” are registered trademarks of Institutional Capital Network, Inc. Additional information is available upon request.
©2025 Institutional Capital Network, Inc. All Rights Reserved.