THE CASE FOR DIRECT LENDING
When assessing the forward outlook for direct lending, it’s important to acknowledge the market position that direct lenders now occupy, as well as the macro-driven investment thesis.
The banking industry’s place in traditional corporate lending has sharply diminished over the last two decades. This trend has primarily been driven by massive consolidation within the banking industry, in addition to tightening lending standards and a general shift to stricter regulatory and capital requirements imposed on banks. More recently, banks have been dealing with declining values of their bond portfolios, weak commercial real estate (mainly office) and more regulatory uncertainty related to capital requirements.
This backdrop has provided opportunities for others to step in. Non-banks, including direct lenders, now hold $23.2 trillion in loans compared to $12.4 trillion held by banks.1 And in the first quarter of 2024, several major private market firms increased their direct lending forecasts due, in part, to this public-to-private structural shift. In other words, direct lending has grown in size and stature and is now a true alternative to traditional bank lending.
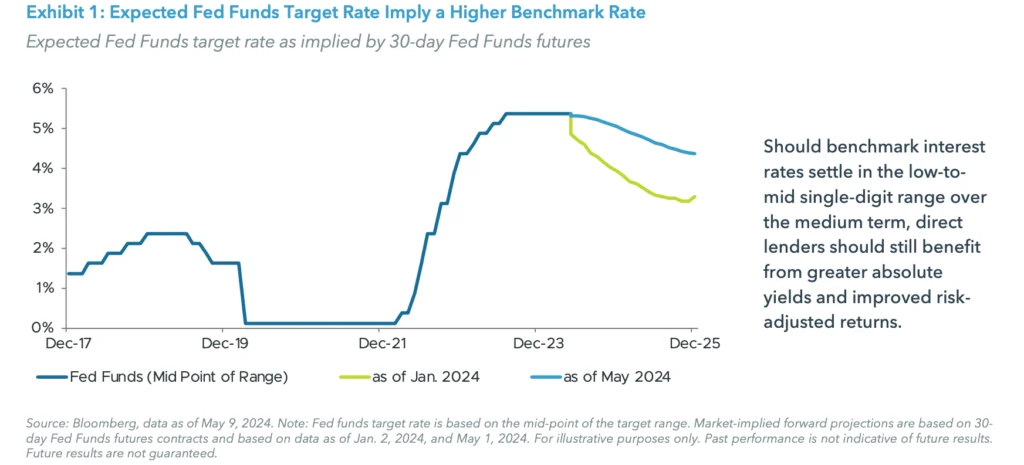
From an investment outlook standpoint, higher-for-longer interest rates offer the potential for attractive yields. While inflation, the labor market, and the timing of potential interest rate cuts are the focus of the current macro debate, what matters more is where rates eventually settle, or the neutral interest rate. Should this be in the 2% to 4% range, rather than 0% to 2%, the core tenets for a direct lending allocation remain in place: enhanced income potential, diversification benefits, and lower correlation to broader fixed-income assets.
Yet, higher yields are only appealing if credit losses stay in check. Given the strong economic and demand backdrop, the benefits of higher interest rates should outweigh the risk of deteriorating corporate fundamentals, or credit quality, and extend the period of strong returns for direct lending.
DON’T JUST LOOK AT RATE CUTS, LOOK WHERE RATES SETTLE
The strength of the U.S. economy and stubbornly high inflation have led to conclusions that there will be fewer than expected benchmark interest rate cuts in 2024. According to Fed Funds futures pricing data, only one rate cut is now expected in 2024, down from seven cuts that were expected at the start of the year.2
Even more important than the near-term rate forecast is where the benchmark rate settles over the medium to longer term. The robust economic data has led to upward revisions in GDP forecasts, from 1.3% to 2.4% annual growth in 2024, leading many to expect that neutral interest rate will not return to the 0% to 2% range seen over much of the last 15 years.3
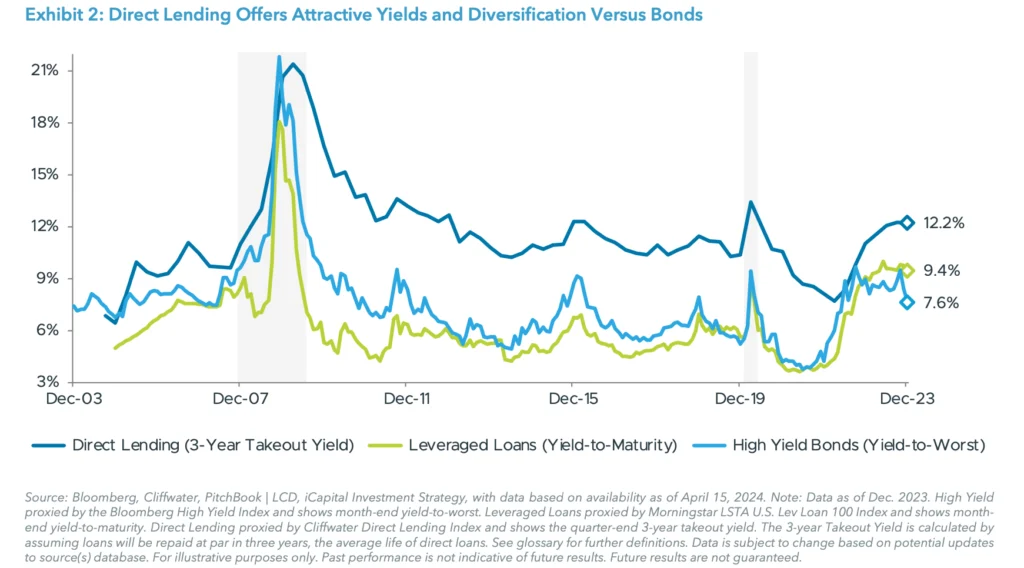
This higher-for-longer scenario suggests higher return potential for direct lending should prevail, where yields in the 12% range are possible. The Cliffwater Direct Lending Index (CDLI), an index of roughly 15,000 middle market direct loans, returned 12.1% in 2023.4 Even as spreads — which typically range 500-700 basis points above benchmark rates — have narrowed slightly, they are still above levels seen prior to the 2022-23 Fed rate hike campaign.
STRONG FUNDAMENTALS ARE OFFSETTING CREDIT CONCERNS
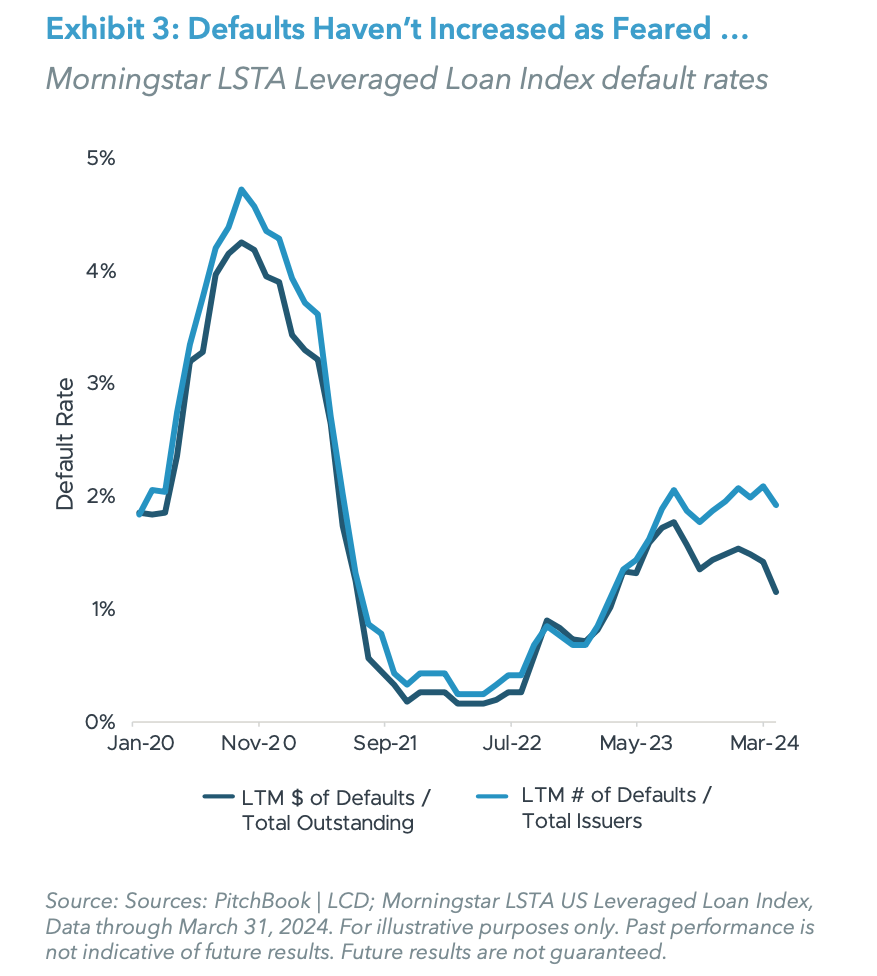
Higher interest rates typically place pressure on earnings growth and interest coverage ratios. Yet, it doesn’t appear that borrowers are facing meaningful financial stress. Corporate defaults also haven’t increased as initially feared when the Fed began its rate rising campaign in 2022. The Morningstar LSTA Leveraged Loan Index showed a default rate of 1.34% in the first quarter of 2024, compared to a trailing twelve-month average of 1.47% (see Exhibit 3). Defaults have increased modestly from their post- pandemic lows but are not at levels that generate concerns.
The limited stress proven by corporate borrowers could be attributed to strong performance by the underlying borrowers. According to Golub Capital, U.S. middle market private companies generated double-digit earnings growth (+11.0% YoY) for the third consecutive quarter in Q1 2024, suggesting these companies have been able to manage a capital structure with higher debt costs.
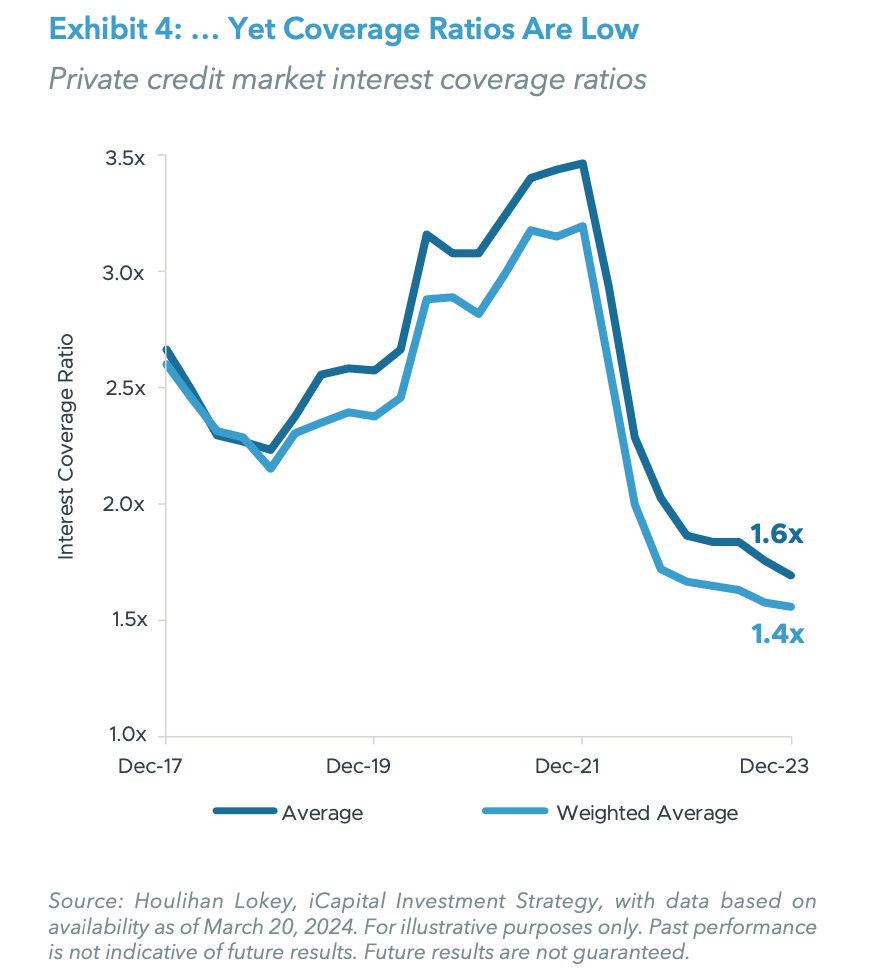
Still, credit fears will likely remain. The interest coverage ratio for private credit markets are below 2.0x, as costs increases have impacted earnings and cash flows of select borrowers (see Exhibit 4). Further credit quality weakness is likely, especially for lower-quality borrowers and those that are still reliant on loans that originated when benchmark rates were near zero percent. And should default rates reverse and trend higher, investors can look towards direct loan recovery rates to assess the impact on returns.
THERE’S NO SHORTAGE OF ORIGINATION VOLUME POTENTIAL
The reality of higher rates has also led to questions about origination volume opportunities. Yet so far in 2024, there hasn’t been a panic from a lack of rate cuts. In Q1 2024, leveraged loan volume tracked by Pitchbook neared all-time highs with $172 billion in deal activity, although large deals helped influence this growth.5 Leveraged loan activity tends to be skewed to larger companies, but a surge in deals can be viewed as an indicator for broader market activity.
A majority of borrowers in Pitchbook’s leveraged loan data set are private companies, many owned by private equity firms. Further, many loans that were due to be paid off over the last two years have been extended, often at higher rates. Established managers with prior relationships (and proper covenants) tend to work with these repeat borrowers and generate sound underwriting decisions.
There are other ample origination opportunities ahead — a big reason many private market firms are accelerating their efforts in the direct lending market. The abundant growth in the primary private equity market, improving valuations and investor risk appetite should provide stability to sponsor-backed deal flow. And about 40% of direct loans themselves are scheduled to mature by the end of 2025, providing another source of repeat borrowers for established managers.6
SUMMARY
Although the topic of credit quality is inevitable, a backdrop of higher benchmark rates, combined with resilient business performance, should help continue to deliver strong direct lending returns. From a portfolio perspective, a direct lending allocation provides enhanced income potential, diversification benefits through lower volatility and lower correlation to broader bond and loan indices, and exposure to private companies that is not available in the public credit markets.
ENDNOTES
1. JP Morgan; Assets and Liabilities of Commercial Banks in the United States H.8 data; Financial Accounts of the United States Z.1 data; Loans held by nonbank entities per the FRB Z.1 Financial Accounts of the United States.
2. CME FedWatch Tool; data as of May 6, 2024.
3. Bloomberg; iCapital Investment Strategy, as of April 22, 2024.
4. Cliffwater; “2023 Q4 Report on US Direct Lending,” as of Dec. 31, 2023.
5. PitchBook | LCD; “US Leveraged Loan Data,” May 2024.
6. Oaktree; “Performing Credit Quarterly 3Q2023: Tails, You Lose?,” October 2023.
INDEX DEFINITIONS
Cliffwater Direct Lending Index (CDLI): An asset-weighted index of over 11,000 directly originated middle market loans totaling $264B. It seeks to measure the unlevered, gross of fee performance of U.S. middle market corporate loans, as represented by the asset-weighted performance of the underlying assets of Business Development Companies (BDCs), including both exchange-traded and unlisted BDCs, subject to certain eligibility requirements.
The Morningstar/LSTA U.S. Leveraged Loan Index is designed to deliver comprehensive, precise coverage of the US leveraged loan market. Underpinned by PitchBook and LCD data, the index serves as the market standard for the US leveraged loan asset class and tracks the performance of more than 1,400 USD denominated loans.
IMPORTANT INFORMATION
The material herein has been provided to you for informational purposes only by Institutional Capital Network, Inc. (“iCapital Network”) or one of its affiliates (iCapital Network together with its affiliates, “iCapital”). This material is the property of iCapital and may not be shared without the written permission of iCapital. No part of this material may be reproduced in any form, or referred to in any other publication, without express written permission of iCapital.
This material is provided for informational purposes only and is not intended as, and may not be relied on in any manner as, legal, tax or investment advice, a recommendation, or as an offer or solicitation to buy or sell any security, financial product or instrument, or otherwise to participate in any particular trading strategy. This material does not intend to address the financial objectives, situation, or specific needs of any individual investor. You should consult your personal accounting, tax and legal advisors to understand the implications of any investment specific to your personal financial situation.
ALTERNATIVE INVESTMENTS ARE CONSIDERED COMPLEX PRODUCTS AND MAY NOT BE SUITABLE FOR ALL INVESTORS. Prospective investors should be aware that an investment in an alternative investment is speculative and involves a high degree of risk. Alternative Investments often engage in leveraging and other speculative investment practices that may increase the risk of investment loss; can be highly illiquid; may not be required to provide periodic pricing or valuation information to investors; may involve complex tax structures and delays in distributing important tax information; are not subject to the same regulatory requirements as mutual funds; and often charge high fees. There is no guarantee that an alternative investment will implement its investment strategy and/or achieve its objectives, generate profits, or avoid loss. An investment should only be considered by sophisticated investors who can afford to lose all or a substantial amount of their investment.
iCapital Markets LLC operates a platform that makes available financial products to financial professionals. In operating this platform, iCapital Markets LLC generally earns revenue based on the volume of transactions that take place in these products and would benefit by an increase in sales for these products.
The information contained herein is an opinion only, as of the date indicated, and should not be relied upon as the only important information available. Any prediction, projection or forecast on the economy, stock market, bond market or the economic trends of the markets is not necessarily indicative of the future or likely performance. The information contained herein is subject to change, incomplete, and may include information and/or data obtained from third party sources that iCapital believes, but does not guarantee, to be accurate. iCapital considers this third-party data reliable, but does not represent that it is accurate, complete and/or up to date, and it should not be relied on as such. iCapital makes no representation as to the accuracy or completeness of this material and accepts no liability for losses arising from the use of the material presented. No representation or warranty is made by iCapital as to the reasonableness or completeness of such forward-looking statements or to any other financial information contained herein.
Securities products and services are offered by iCapital Markets, an SEC-registered broker-dealer, member FINRA and SIPC, and an affiliate of iCapital, Inc. and Institutional Capital Network, Inc. These registrations and memberships in no way imply that the SEC, FINRA, or SIPC have endorsed any of the entities, products, or services discussed herein. Annuities and insurance services are provided by iCapital Annuities and Insurance Services LLC, an affiliate of iCapital, Inc. “iCapital” and “iCapital Network” are registered trademarks of Institutional Capital Network, Inc. Additional information is available upon request.
©2024 Institutional Capital Network, Inc. All Rights Reserved. | 2024.01


