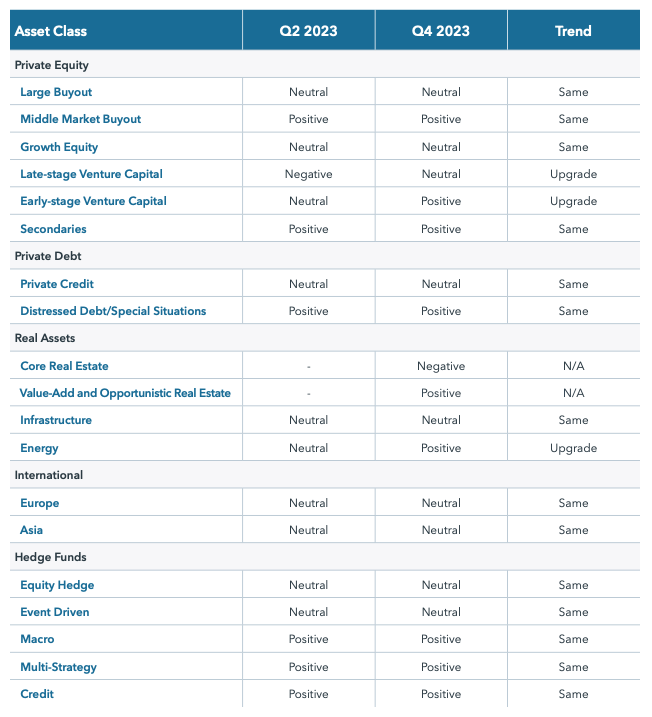
EXECUTIVE SUMMARY
PRIVATE EQUITY
LARGE BUYOUT
Current Outlook – Neutral
Trend versus Q2 2023 – Same
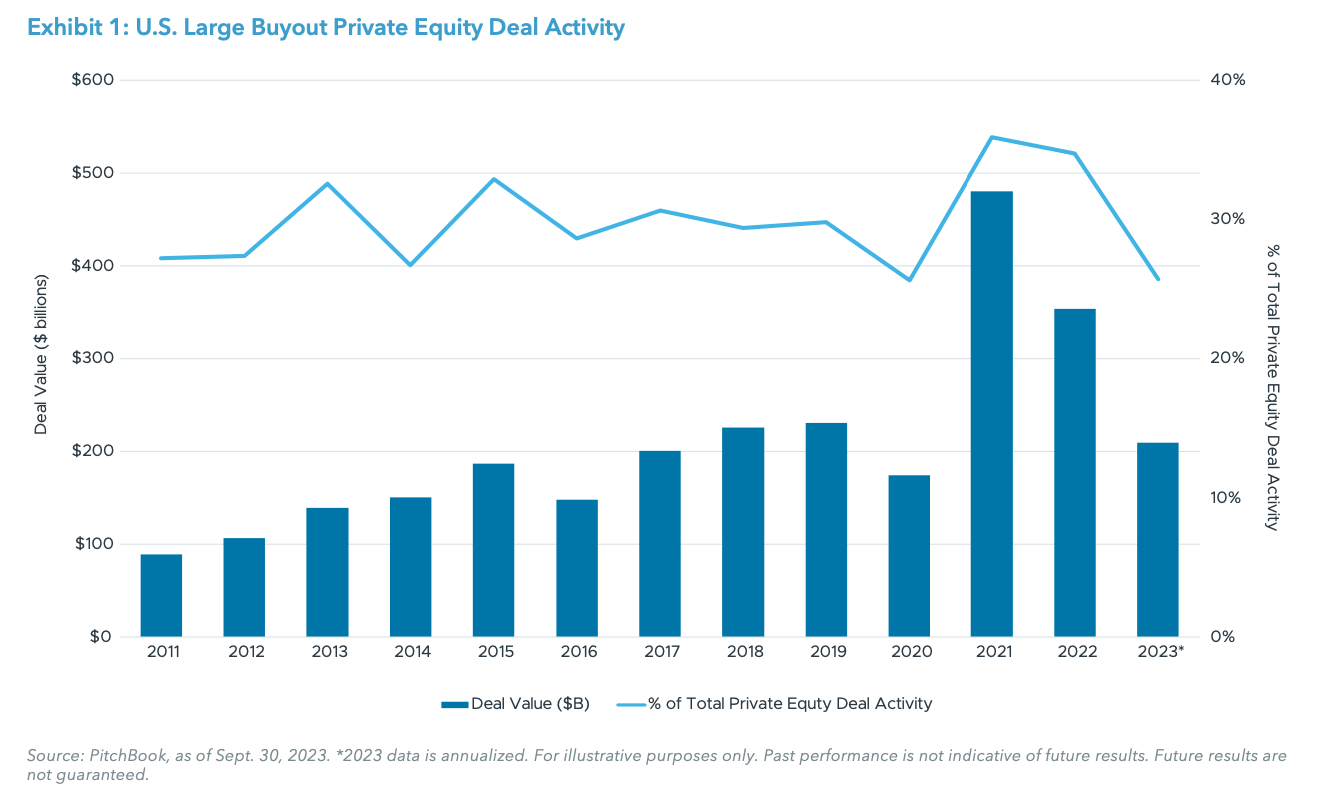
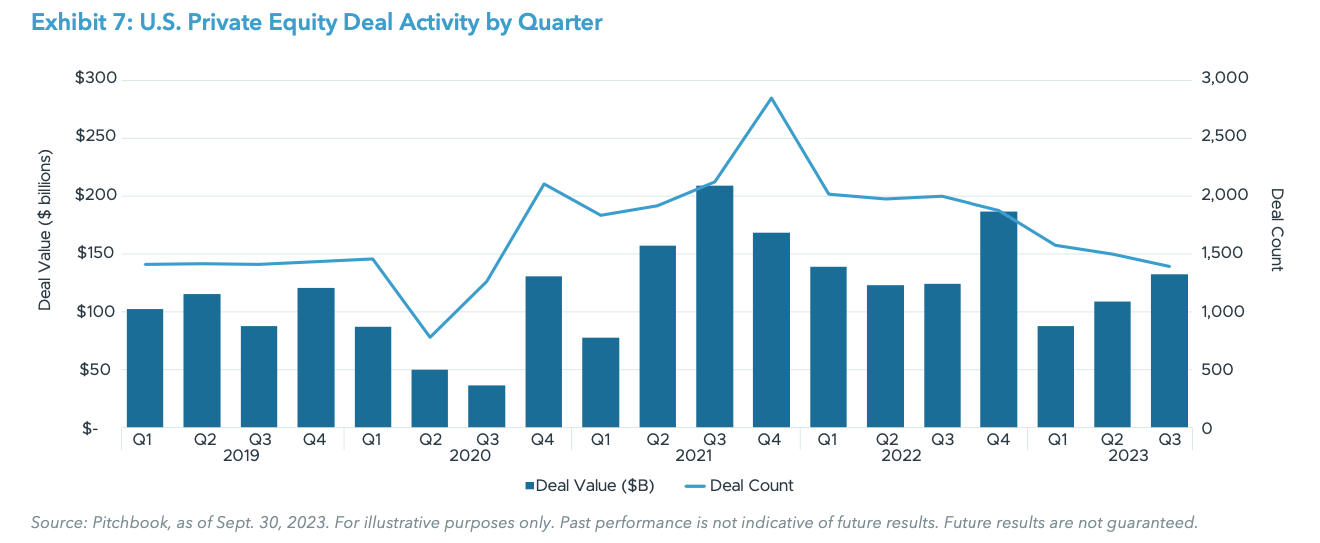
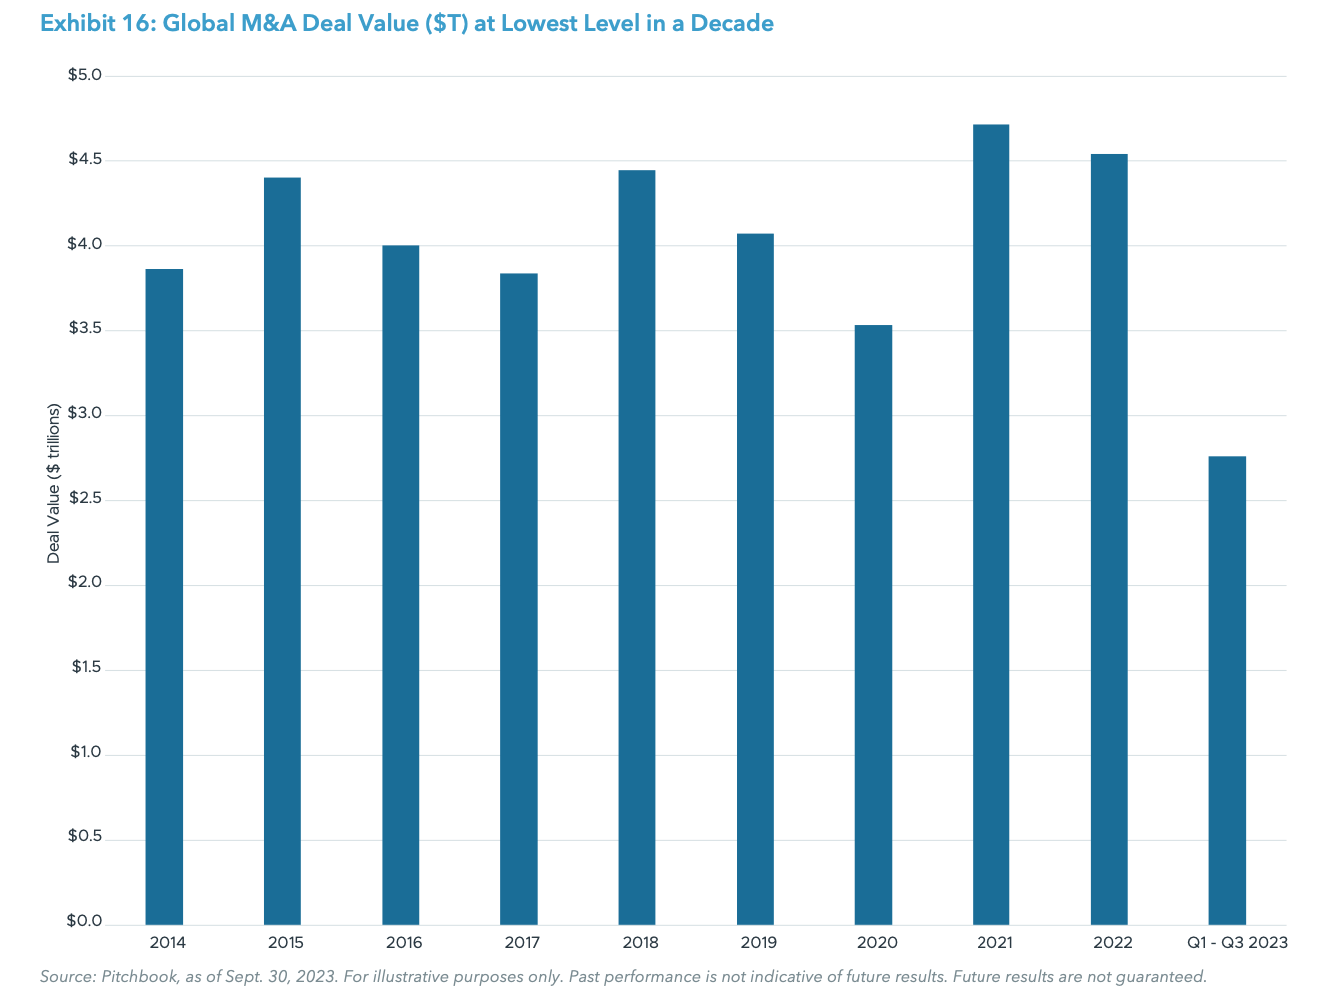
In the first three quarters of 2023, large U.S. buyout deal activities totaled approximately $156 billion for a 49% decline year-over-year (YoY), though on an annualized basis, deal activities remain higher than the historical average of approximately $180 billion.1 Lackluster demand for syndicated leveraged loans backing large buyout transactions also continues to negatively impact the sector. Sponsors have started to focus on smaller-sized companies, either as platform investments or as add-ons for existing portfolio companies, in order to continue deploying their available dry powder. While deal activities have experienced a significant drop, it is important to have a perspective. Despite the more than 60% decline in large buyout deal activities in 2009 due to the Global Financial Crisis (GFC), large buyout funds over the subsequent five vintage years generated an average net internal rate of return (IRR) of over 18%, outperforming the broader buyout sector by almost 1%.2
Exit activities for large transactions experienced a less severe decline for the first three quarters of 2023, with a total value of $75 billion for a 29% YoY decrease.3 While demand for public listing seems to have improved, sponsors continue to remain cautious due to an uncertain near-term outlook.
As the fed funds rate remains elevated, syndicated financing for larger buyouts is expected to remain subdued, resulting in reduced activities in the category. Even as the median buyout EV/EBITDA multiple has dropped from 11.8x in 2022 to 9.8x in 2023,4 many corporate/strategic buyers are remaining on the sidelines until the risk of a recession fades, preferring instead to shore up their balance sheets and cash reserves. As such, both exit activities and valuations are expected to remain depressed in the near term as large buyout firms are holding on to their investments rather than being forced sellers in an unattractive market environment. Conversely, the valuation reset is potentially creating attractive pricing opportunities for large buyout funds with significant dry powder to deploy, providing valuation support in an environment with limited exit opportunities. Incidentally, funds raised during those “tough” vintage years tend to outperform funds across other categories as well.
Risks: Valuation concerns driven by elevated interest rates and slowing economic growth; uncertainty around exit environment.
MIDDLE MARKET BUYOUT
Current Outlook – Positive
Trend versus Q2 2023 – Same
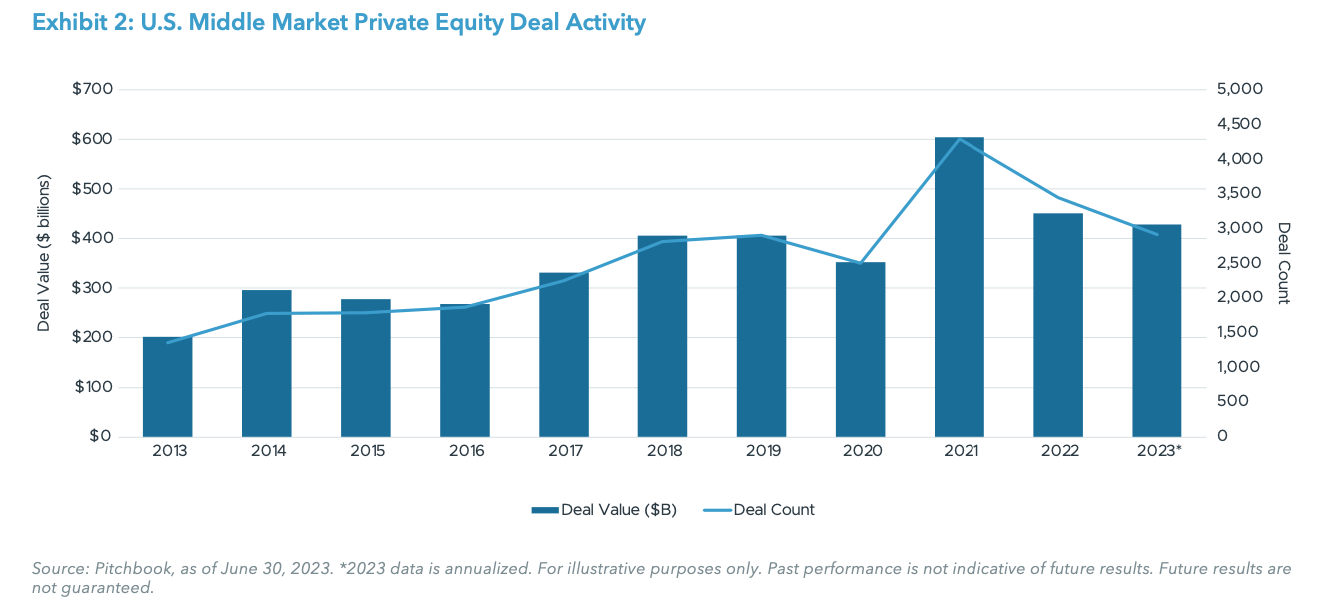
Middle market activity continues to moderate in 2023, but remained healthy by historical standards. In the first half of 2023, U.S. middle market activity totaled approximately $214 billion across 1,456 transactions, marking a 6% and 15% YoY decrease, respectively.5 These declines were not as steep as those in the buyout market overall, and as a result, the middle-market share of all buyout deals has expanded to 76% in the first half of 2023 from a five-year average of 68%.6 The trend is expected to persist through the rest of 2023, potentially pushing the middle market share of all buyout deals to a new high.
While the exit environment in H1 2023 for middle market deals remains challenging, with a total exit value of $52 billion, a 34% YoY decline, investors are optimistic about conditions improving in the latter half of 2023.7 This is in part aided by the fact that relative to the large buyouts, the smaller size of middle-market portfolio companies allows sponsors to pursue multiple paths to exit instead of relying on public listing, which has not been a major route of exit for middle market buyout historically.
Although the macro environment remains challenging, there are more opportunities to generate returns within the middle market. Companies can also grow their revenues by adding product lines, expanding geographically, and executing accretive mergers and acquisitions (M&A). Based on Golub Capital Altman Index (GCAI), sponsor-backed, middle-market companies reported 7.6% and 13.3% YoY revenue and earnings growth, respectively, for the first two months in Q3 2023 (the highest YoY earnings growth since Q3 2021), which fares well compared to the S&P 500’s 2.3% increase in revenue and a 4.1% increase in earnings for Q3 2023.8
From the sector perspective, not all sector specialists are positioned equally. Those focusing on consumer products and services and commodity-driven businesses face significant headwinds from the impact of inflation, elevated rates, and potential economic slowdown. However, in our view, those focused on defensive sectors and secular growth trends with tailwinds across market cycles are likely better positioned. Secular trends and adoptions of technology across industries, as well as the recurring nature of software revenue, make the sector attractive. Given the current market environment, corporate spending is expected to moderate. However, chief information officers anticipate increasing their spending on domains such as cybersecurity, data and analytics, and automation.9 Health care remains attractive, due to demographic drivers, increasing adoption of digital technology, growth in value-based care, and heightened awareness emerging from the pandemic.
Risks: Valuation concerns driven by elevated interest rates and slowing economic growth; uncertainty around exit environment.
GROWTH EQUITY
Current Outlook – Neutral
Trend versus Q2 2023 – Same
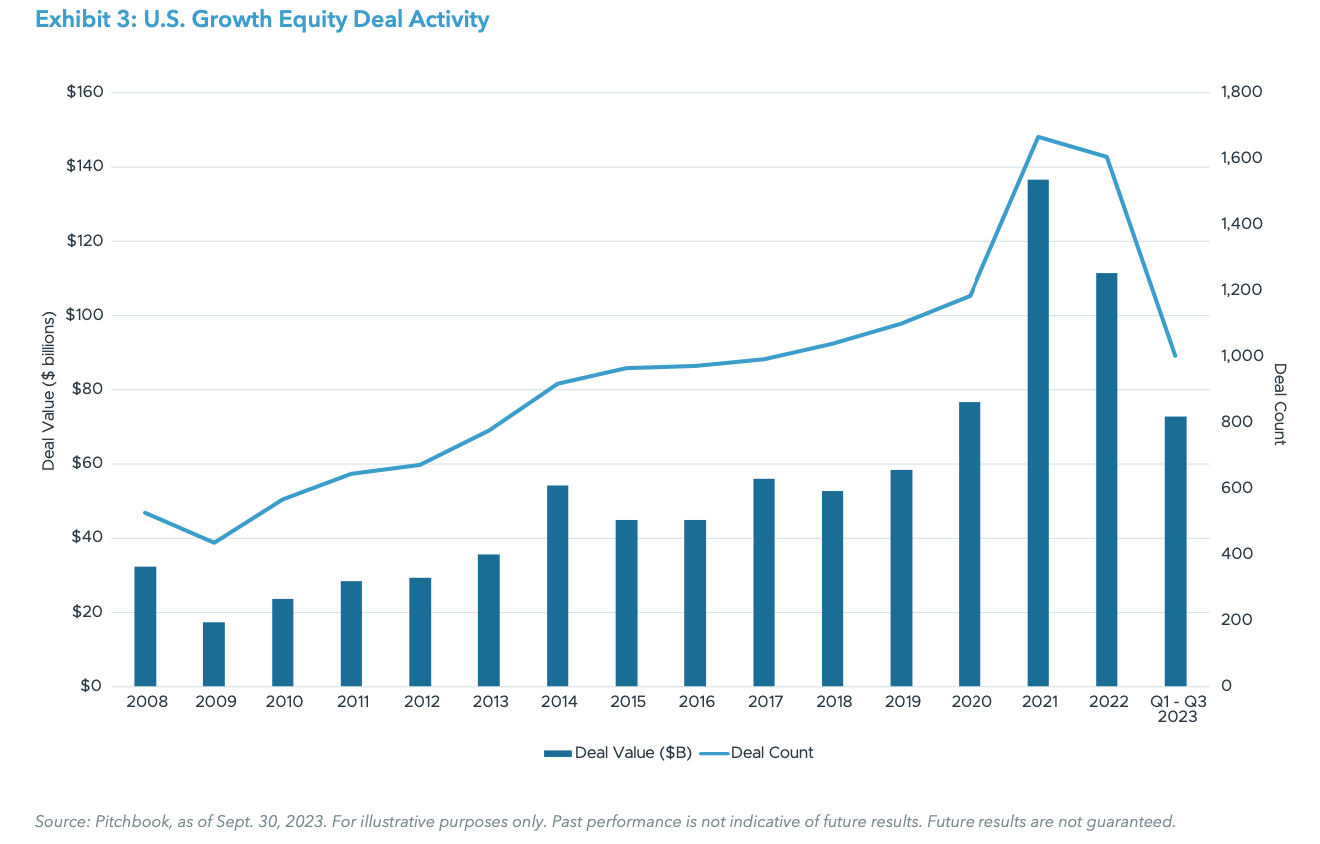
While public growth stocks rebounded in H1 2023, privately held growth companies have continued to feel the aftershocks. U.S. growth equity deal activity remains weak, with Q3 2023 experiencing the lowest quarterly deal count since Q2 2020.10 Funds with sizable active portfolios that were deployed in the high-valuation environment of the past few years have had limited realizations and are the most negatively impacted by this market correction.
However, we are beginning to see areas of opportunities within the growth equity market. Private market valuations are starting to come down from their high levels, providing investments at more reasonable prices.11 Moreover, we continue to see investors focusing on profitability and financials over a growth at all costs mentality, resulting in more investor-friendly terms. Supply and demand dynamics between companies and investors continue to shift in favor of investors given that the capital demand-to-supply ratio for venture-growth stage companies is 2.2x, the highest level in the last decade.12
At the same time, exit markets remain largely closed. While there has been activity in the public markets recently, with high-profile IPOs of Arm, Instacart, Klaviyo, and Cava, the shares of each have declined from their opening values.13 With valuations trending down and a limited exit market, there are few options for cash-strapped companies to source liquidity at the same levels as prior rounds.
Overall, we maintain our neutral ranking on growth equity as annual deal count and deal value continue to trend downwards and private equity-backed exits remain at low levels. However, we are seeing positive indications with valuations coming down and the focus on company profitability and financials. We are, however, optimistic about experienced growth managers coming to market and those with significant amount of dry powder to deploy capital in 2024.
Risks: Valuation concerns driven by elevated interest rates and slowing economic growth; uncertainty around exit environment; competition from built-up dry powder on the sidelines.
LATE-STAGE VENTURE CAPITAL
Current Outlook – Neutral
Trend versus Q2 2023 – Upgrade
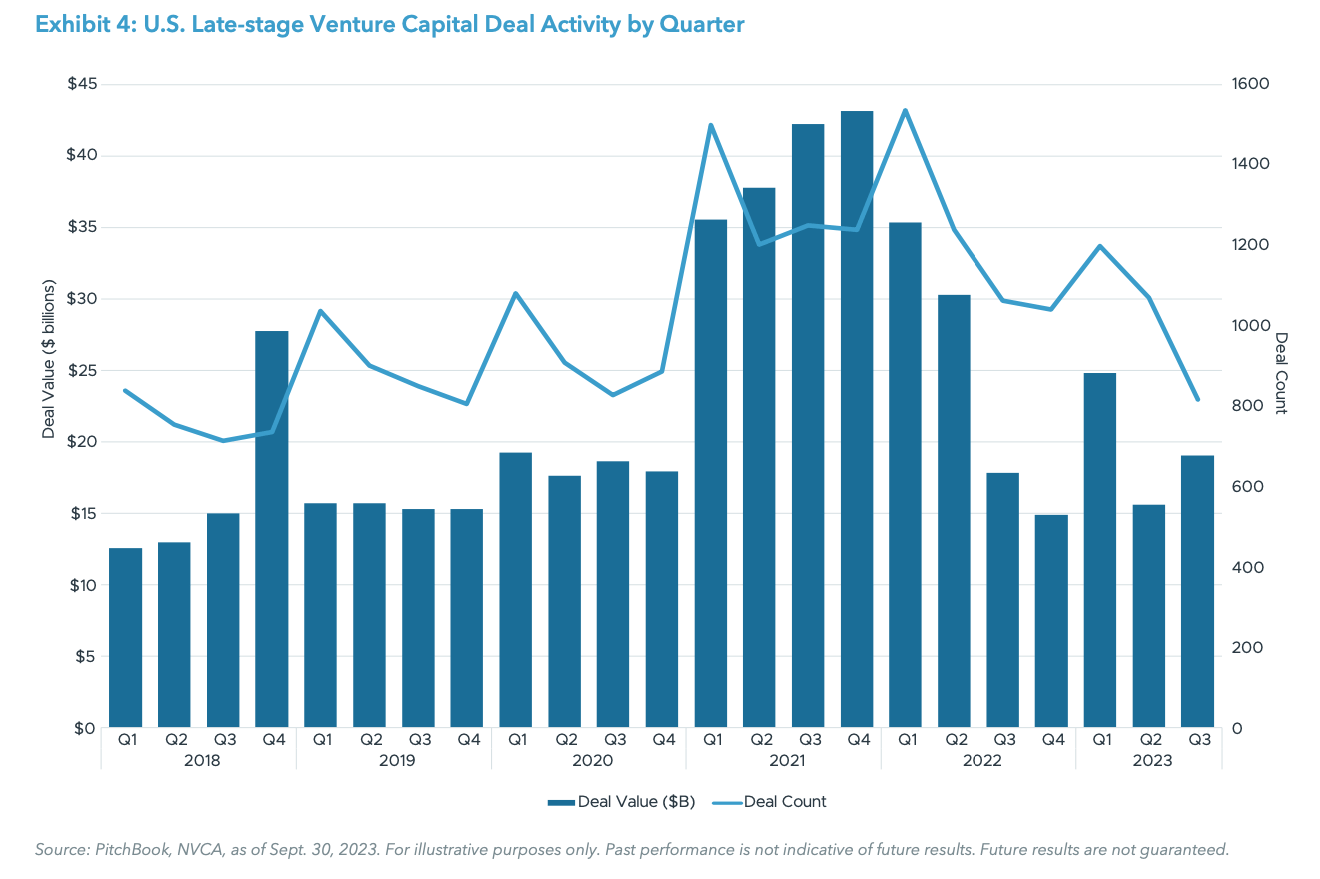
Late-stage venture deal activity has shown signs of stabilization in the first three quarters of 2023, with deal value increases quarter-over-quarter from Q4 2022 to Q1 2023, and again from Q2 2023 to Q3 2023.14 Though deal count has continued to decline in 2023, down over 45% from its peak deal count in Q1 2022, activity is pointing towards signs of normalization in the late-stage venture ecosystem.
Late-stage median pre-money valuations saw a 21% decline through Q3 2023, compared to its peak in 2021.15 While valuations were still over 50% above the 10-year median, the current market environment represents a more attractive entry point for late-stage venture managers compared to recent years.16 Another potential benefit of the current market is that companies today are likely to become much more disciplined in terms of cash burn and focused on profitability, which is a significant change from the growth at all costs mantra. Finally, non-traditional investor participation has fallen by over 60% from its peak in 2021 in terms of both volume and activity.17 Deals with non-traditional investor and crossover investor participation were on average 4x larger than the average for all venture deals in 2021.18 With the departure of these “tourist” investors, we expect the venture ecosystem to continue to normalize in the coming quarters.
That said, one of the more important drivers of late-stage venture performance is the exit environment, which has been significantly challenged over the past year. In 2021, the U.S. venture capital market saw a staggering 1,900+ exits representing over $750 billion in exit value, with an average exit value over 5.5x greater than the average annual exit value between 2013-2020.19 Even when looking past the 2021 outlier year, the annualized exit value for the first three quarters of 2023 is on pace to be over 70% below the 2018-2020 average, and over 20% below the 2013-2017 average.20
Risks: Valuation concerns driven by elevated interest rates and slowing economic growth; uncertainty around exit environment, longer hold periods.
EARLY-STAGE VENTURE CAPITAL
Current Outlook – Positive
Trend versus Q2 2023 – Upgrade
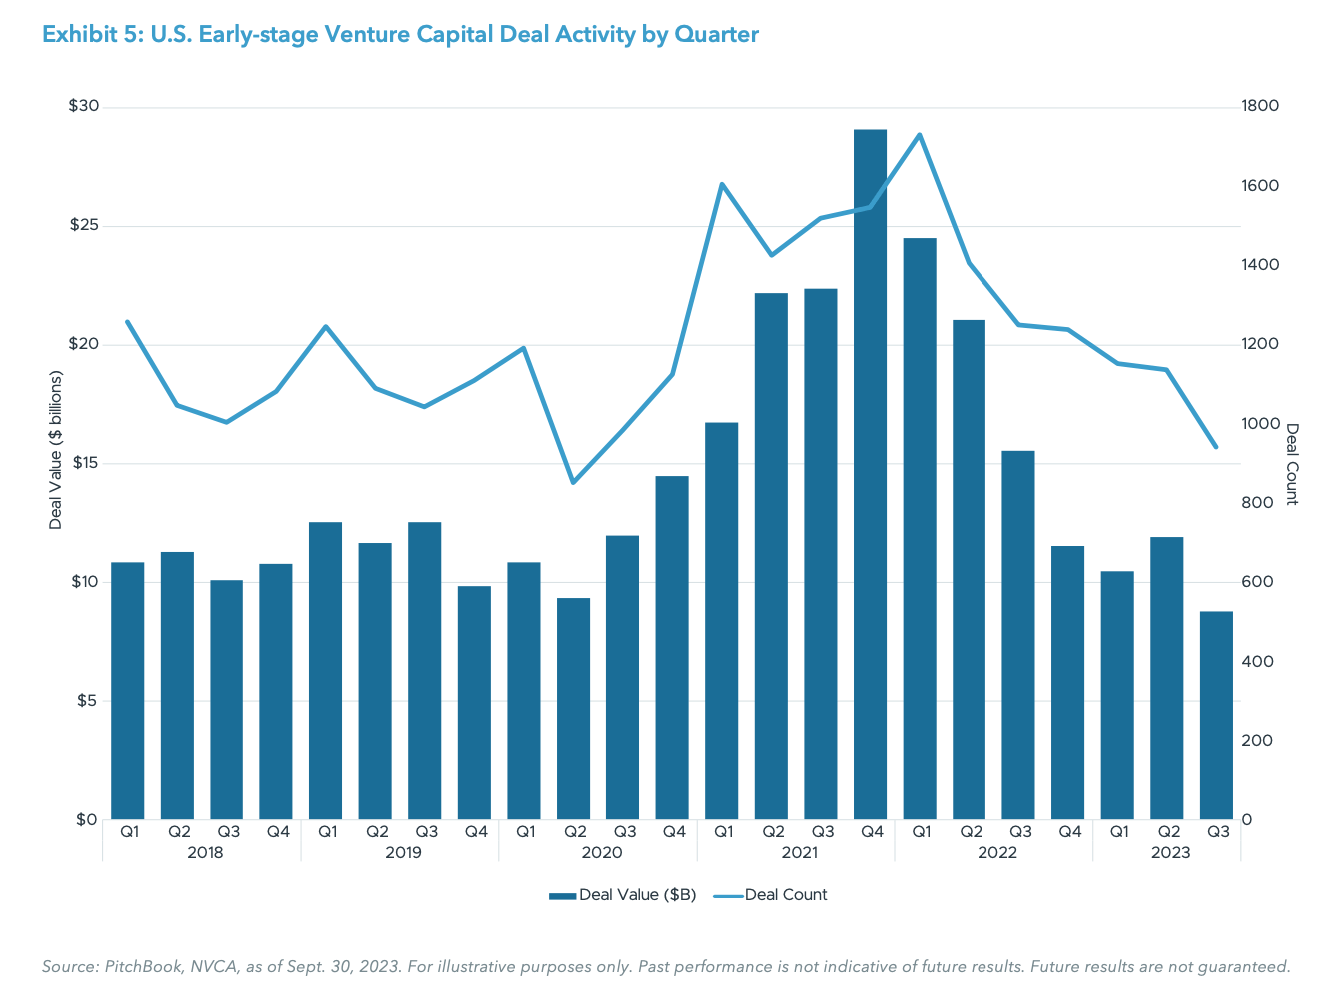
Early-stage venture deal activity has shown signs of stabilizing in recent quarters, with annualized deal count more aligned with the longer term annual average of 4,200-4,300 from 2013-2020.21 Annualized deal value is up 25% compared to the annual average deal value from 2013-2020.22
On the pricing front, we see a similar story to late-stage venture, with median pre-money early-stage venture valuations declining over 13% from the highs in 2022.23 While valuations are still elevated relative to historic levels, we believe this is becoming an attractive entry point for early-stage venture managers given new commitments to venture capital funds today will be allocated over the next three years onward.24 Notably, early-stage investments (typically before Series B) are often at the stage of identifying product-market fit, which, combined with scaling, is a primary driver of value generation. Given this dynamic and higher underwritten returns, early-stage investments carry less valuation risk than other stages of venture capital. There is still a degree of uncertainty when it comes to the venture landscape, as price discovery continues to unfold and venture capital managers remain focused on working with existing portfolio companies (representing over $850 billion of unrealized value) to navigate the current environment.25 However, given the valuation reset, stabilizing activity, and long-term nature of the investment opportunity, we view the current market environment as an attractive entry point for new commitments to early-stage venture.
Risks: Valuation concerns driven by elevated interest rates and slowing economic growth; uncertainty around exit environment; longer hold periods.
SECONDARIES
Current Outlook – Positive
Trend versus Q4 2022 – Same
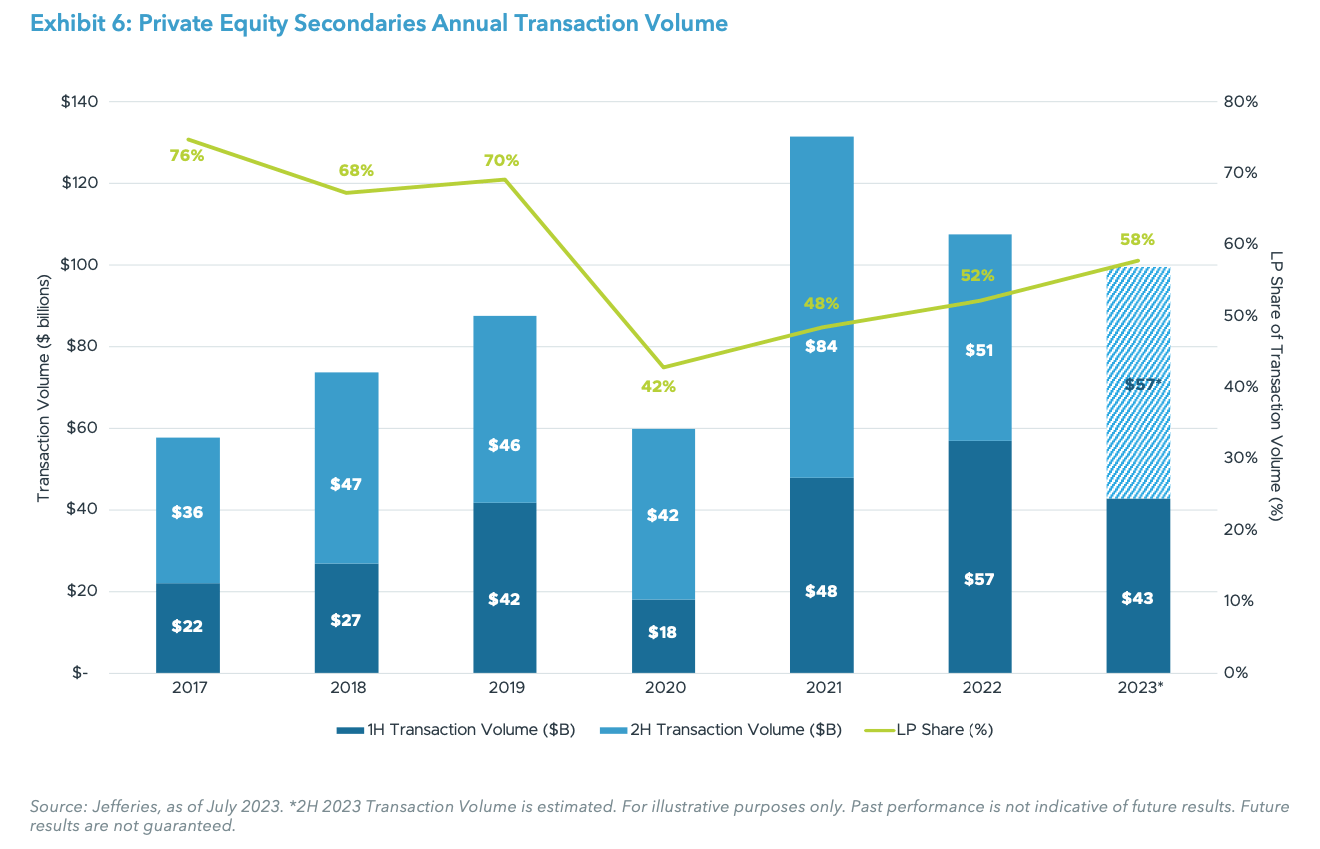
Through the first half of 2023, global secondary transaction volume reached $43 billion, representing a 25% decline YoY.26 This was due in part to public markets rebounding earlier this year, which alleviated overallocation pressures by Limited Partners (LPs) and lessening the impact of the denominator effect. Despite this contraction, secondary transaction volume could potentially reach over $100 billion in 2023 for the third consecutive year due to improved macro trends, narrower bid-ask spreads, and elevated amounts of dry powder.27
LP-led secondaries continued to account for a larger portion (58%) of total volume compared to general partner (GP)- led transactions (42%).28 The average pricing for LP-led portfolios rebounded and improved from 78% of net asset value (NAV) in the second half of 2022 to 84% in the first half of 2023.29 Should the broader market continue to recover, bid-ask spreads could narrow further and more closely align with 2021’s 8% discount level across all strategies, which may result in more LP-led opportunities to come to light.30 With regards to GP-led secondaries, although volume contracted 25% YoY, volume is still elevated compared to GP-levels prior to the COVID-19 pandemic.31 There continues to be pressure for sponsors to generate liquidity in order to return capital to its investors. GPs are leveraging various incentives (e.g., discounts, deferrals, preferred equity solutions) to make GP-led transactions enticing.
Secondary fundraising continues to maintain strong momentum, raising $39 billion in the first half of 2023 and surpassing 2022’s total fundraising amount of $31 billion.32 With the continued increase in secondaries fundraising in recent years, secondaries dry powder reached $220 billion.33
With discounts more muted than a year ago, LP-led secondary volume could increase as sellers are more willing to transact at more reasonable discounts. As such, this pent- up demand could lead to more secondary opportunities.
Risks: Valuation concerns driven by elevated interest rates and slowing economic growth; heightened competition following several years of record fundraising; less potential for alpha due to narrower dispersion of returns.
PRIVATE DEBT
PRIVATE CREDIT
Current Outlook – Neutral
Trend versus Q4 2022 – Same
Private credit is facing a multifaceted outlook in the near- to-medium term, as the higher rate environment offers the potential for attractive yields but also macroeconomic challenges. Opportunities for direct lending strategies for sponsor-backed transactions have been fewer in 2023, amidst lower levels of private equity investment activity. In Q3 2023, U.S. private equity invested capital totaled over $126 billion, a notable increase from Q1 and Q2 figures, but still substantially lower from the elevated levels touched in 2021 and 2022.34 Buyout dealmaking activity may have troughed in Q1 2023, which in turn should lead to a greater opportunity set for private credit managers to deploy their $228.5 billion of direct lending dry powder.35 Further, investors are wary of the rising risk of defaults that could potentially hurt returns.
Despite a nuanced environment, private credit performance has remained resilient. The Cliffwater Direct Lending Index (CDLI) produced a strong 9.7% total return from Q2 2022 to Q2 2023, 2.2% higher than the return over the previous twelve months.36 This compares favorably to the Bloomberg U.S. Corporate Bond Index investment grade return of 1.55% and the ICE BofA U.S. High Yield Index return of 8.9% over the same period.37 Direct lenders are benefiting from greater absolute levels of yields and improved risk adjusted returns. With the Secured Overnight Financing Rate (SOFR) base rate of 5.3%, potential spreads ranging from 550 to 700 basis points above the base rate, and original issue discounts of 2% to 3% amortized over three years, lenders can achieve appealing low double-digit yields.38 At the end of Q3 2023, the CDLI distribution yield was at 11.57%, up from 8.7% in Q1 2022 and 10.96% in Q1 2023.39 At the same time, lenders are able to generate these yields with lower overall leverage (debt/EBITDA) and lower loan-to-value (LTV). Average private equity debt/EBITDA multiples declined from 5.9x in 2022 to 5.1x as of September 2023.40 Further, equity sponsors are investing a greater amount of equity into new transactions, with the amount of debt financing for private equity deals dropping to 43.9% in 2023 from 50.8% in 2022.41
Despite higher debt servicing costs, the strength of the underlying economy, so far, has led to improved health of borrowers. The Proskauer Private Credit Default Index, which tracks defaults for senior-secured and unitranche loans in the private markets, had a default rate of 1.41% in Q3 2023, the second consecutive quarterly decrease from 1.64% in Q2 and 2.15% in Q1.42 Given reduced levels of debt, improved equity cushion, and lower-than-predicted loss ratios, investors may want to take advantage of the increase in yield at better terms for new loans, focusing on established managers who have strong relationships with repeat borrowers and have demonstrated a disciplined approach to underwriting. Lastly, we believe, the buy and hold nature of private credit should help shelter investors from the volatility felt by public fixed income investors. The CDLI has exhibited 3.86% annualized volatility from the start of 2019 to Q3 2023, while the Bloomberg U.S. Corporate Bond Index and the ICE BofA U.S. High Yield Index have annualized volatility of 10.88% and 10.92%, respectively, over the same period.43
Risks: Elevated interest rates and slowing economic growth; risk of higher defaults; greater direct lending competition.
DISTRESSED DEBT/SPECIAL SITUATIONS
Current Outlook – Positive
Trend versus Q2 2023 – Same
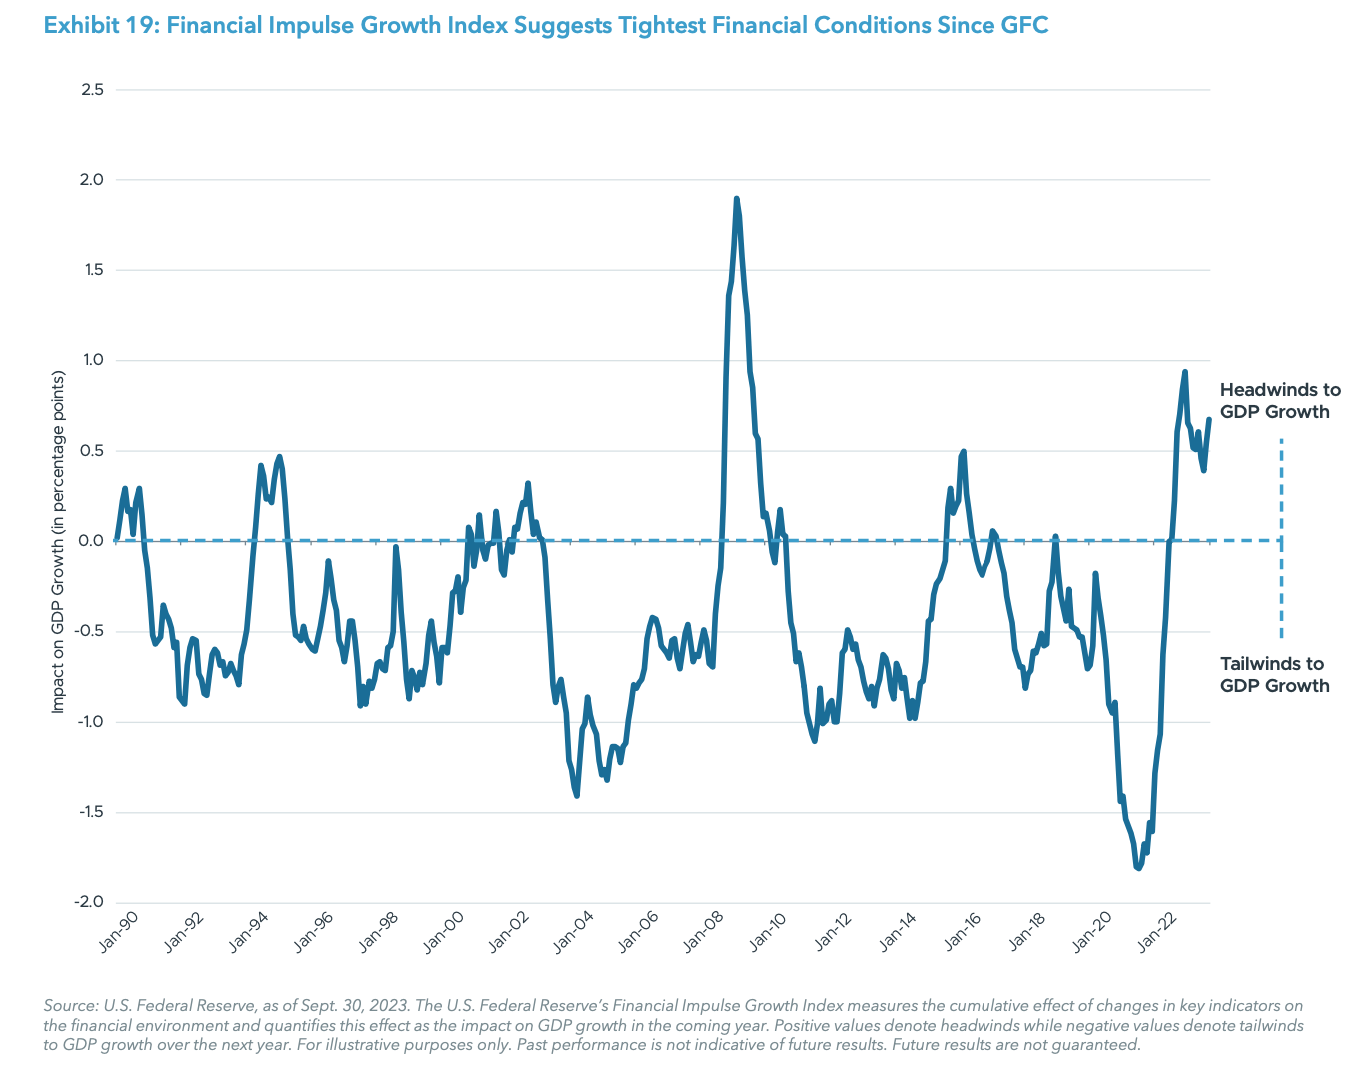
Following the latest interest rate increase in July 2023, the fed funds target rate range has remained at 5.25-5.50% as the market digests surprisingly strong U.S. growth amidst tightening financial and credit conditions.44 As the Federal Reserve (Fed) continues its efforts to combat inflation, the elevated interest rate environment and tightening credit conditions make it more difficult for weaker borrowers to service or refinance their debt. Further, the Fed’s attempt to slow inflation could have multiple adverse effects to growth and the underlying economy.
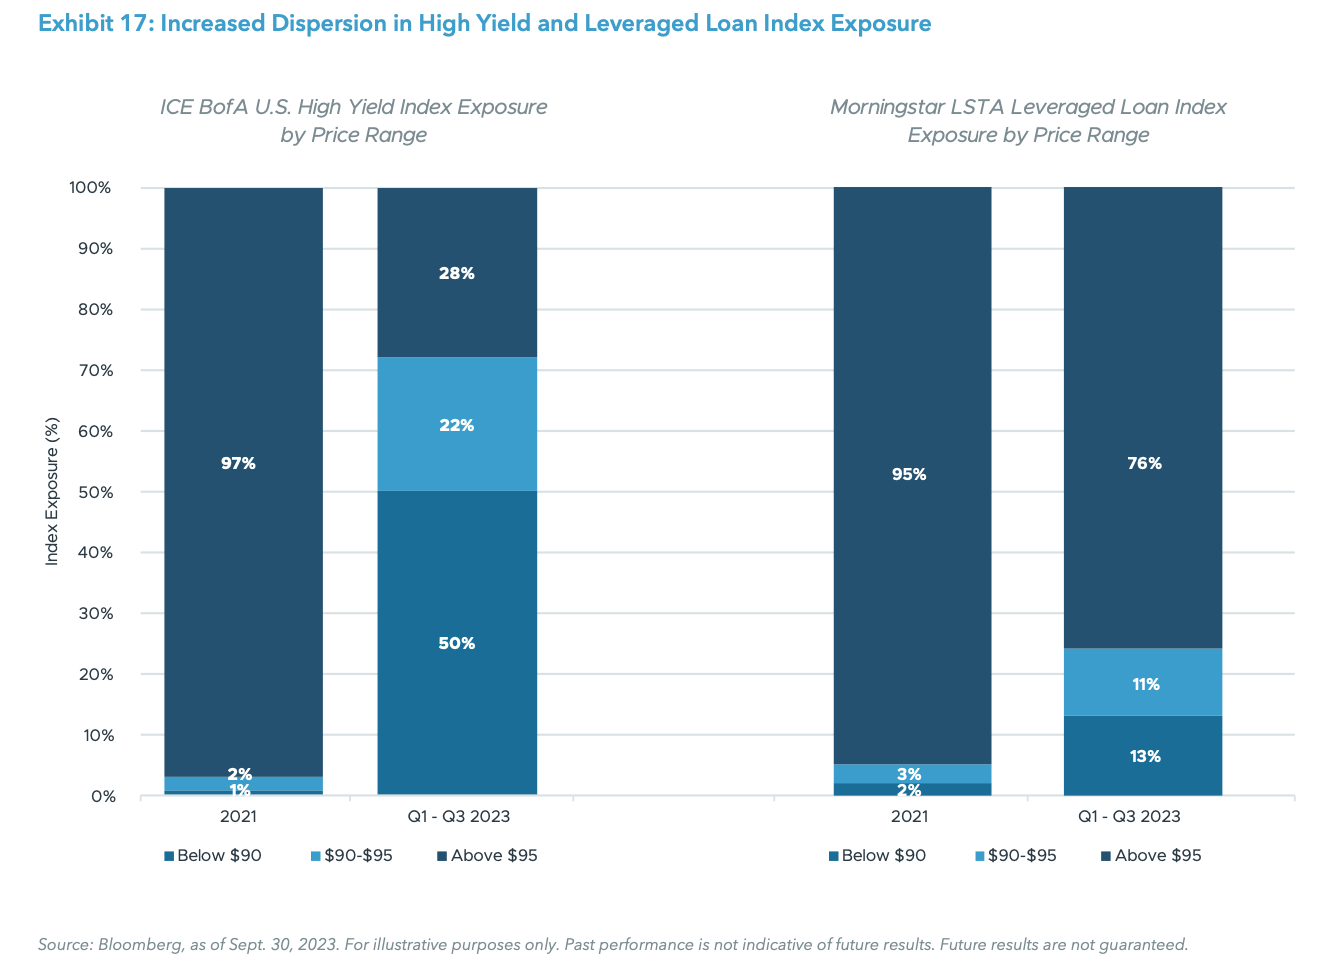
Although the U.S. economy has performed well in the first three quarters of 2023, underlying borrowers are beginning to face stress, which can create a strong opportunity for distressed debt and special situations managers. As of Q3 2023, approximately 14% of non-financial corporate issuers in North America had a negative rating, compared to 10% in Q1 2022.45 Although not a large absolute change, given the substantial increase in the size of the credit markets from $1.7 trillion in 2008 to $5.1 trillion by the end of 2022,46 even a small change in the number of stressed or distressed companies can result in an attractive opportunity set.
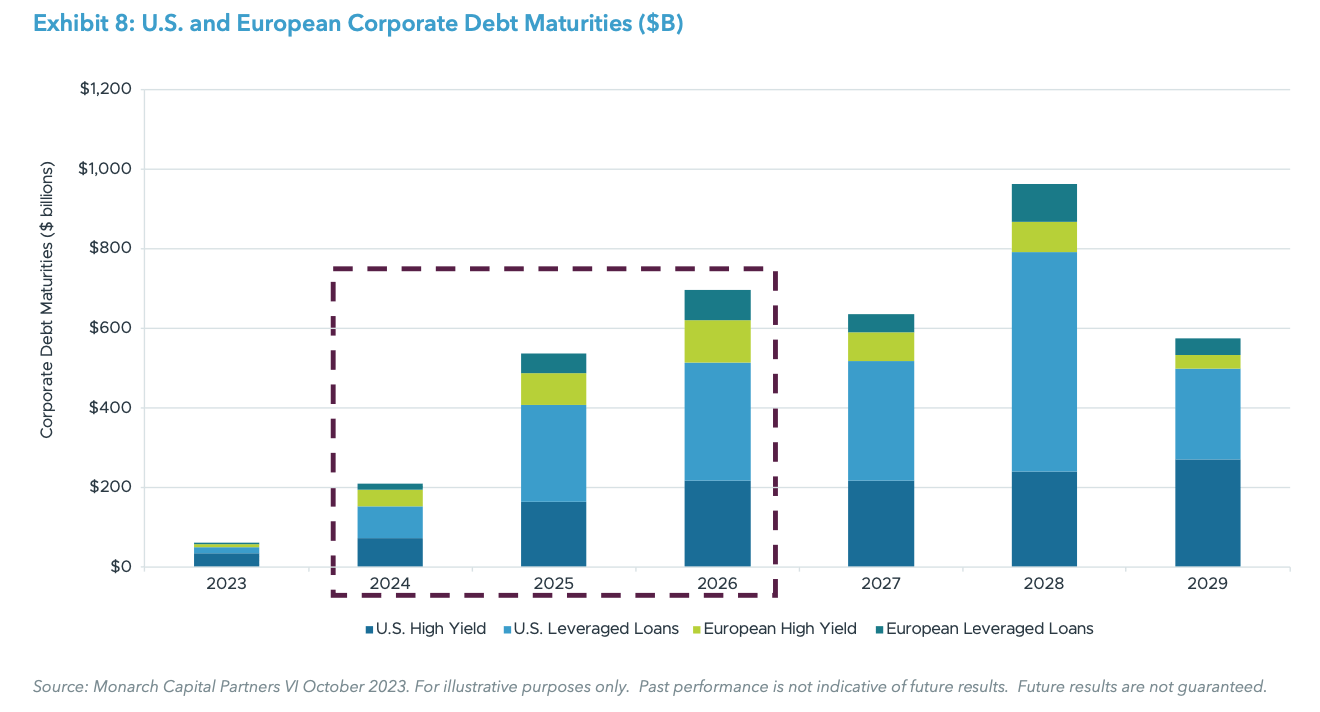
Further opportunities lie in the mounting maturities faced by high yield and leveraged loan borrowers. In a more restrictive lending environment caused by higher rates and potentially declining company fundamentals, distressed debt capital may be needed to refinance current debt held on companies balance sheets. Between 2024 and 2026, there is approximately $1.4 trillion worth of debt coming to maturity.47 If companies are unable to refinance their current capital structures through banks or direct lenders, they will need to borrow money from distressed debt providers or face bankruptcy.
Although stronger economic fundamentals have led to a more muted bankruptcy environment so far, the market continues to expect an uptick in bankruptcies in 2024 and 2025. Leveraged loan and high yield defaults are expected to be 3.5-4.0% and 5.0-5.5%, respectively, in 2024.48 This is an increase from 2023 leveraged loan and high yield default forecasts of 3.0 to 3.5% and 3.5 to 4.5%, respectively.49 Given the complexity of bankruptcy proceedings and the broad opportunity set for distressed investors, we expect managers with flexible approaches across geographies, asset classes, and transaction types, along with experience leading restructuring processes, to outperform passive strategies.
Risks: Uncertain timing and scale of go-forward opportunity set, fiscal or monetary stimulus.
REAL ASSETS
CORE REAL ESTATE
Current Outlook – Negative
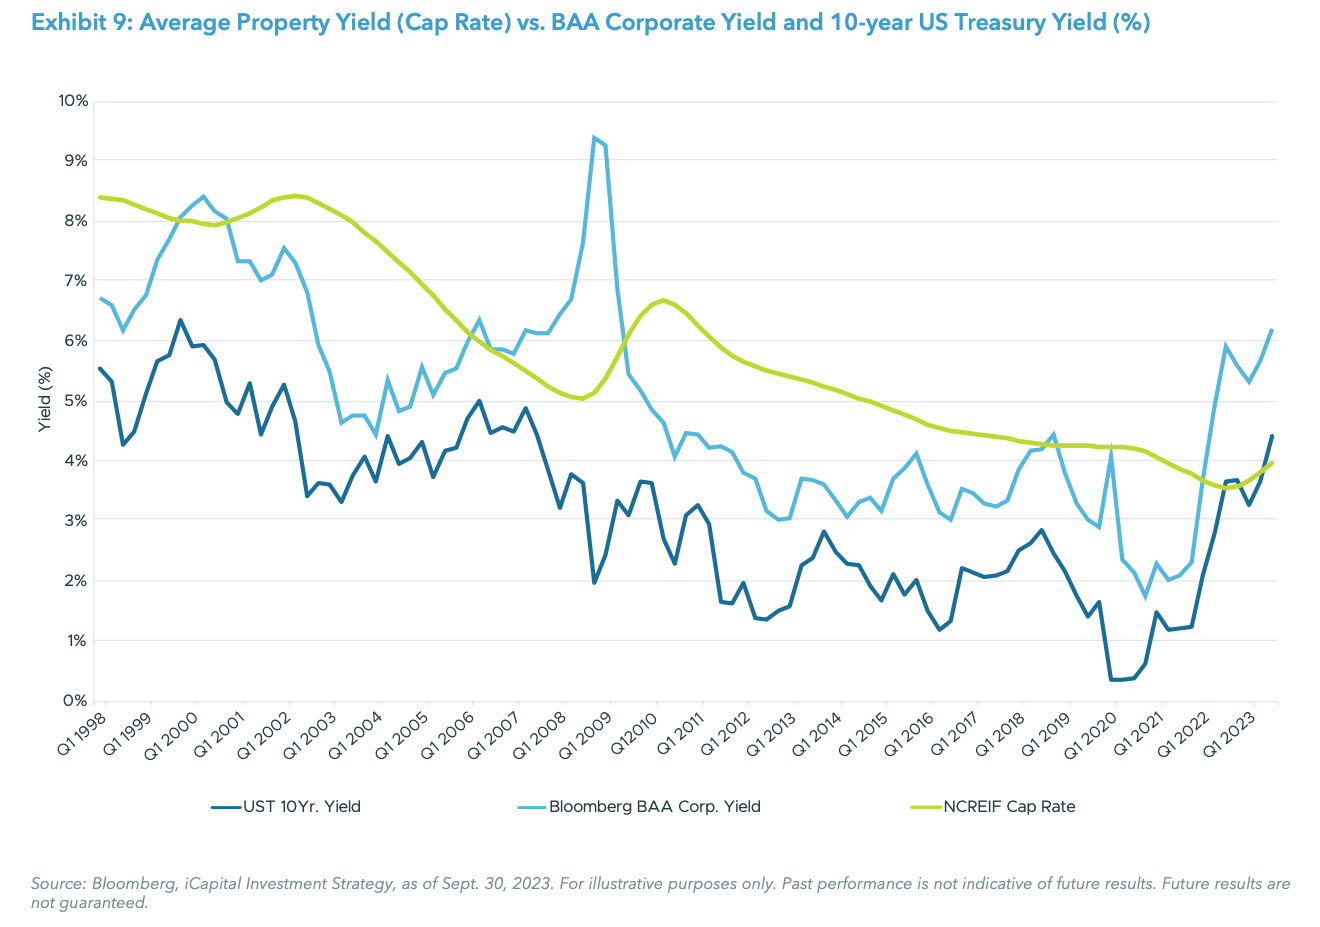
As commercial real estate (CRE) momentum continues to soften throughout 2023, core real estate has been squarely under the microscope. Property fundamentals continue to remain resilient for residential and industrial assets, however, high interest rates are putting pressure on valuations. The 10-year treasury yield currently sits at 4.7%, approximately 40 bps higher than the most recently published NCREIF Property Index (NPI) capitalization rate (cap rate).50 Expectations are that cap rates will have to increase to realign with the current interest rate environment, which will likely come in the form of valuation decreases. Further, a lower transaction volume in 2023 has resulted in only a partial correction. At the current pace, CRE transaction volume is on track to fall below 2020 levels.51 The NPI posted a decline in the third quarter of -1.37% and a one-year correction of -8.35%; however, real estate prices would need to fall another 10% to 15% broadly to bring pricing in line with the historical relationship to bonds.52
The outlook by property type hasn’t shifted much in 2023. Industrial continues to benefit from the e-commerce wave while expanding into other, less publicized, derivatives like cold storage. Residential continues to benefit from housing shortages in the U.S. coupled with prohibitive mortgage rates. Office continues to be challenged and rising loan delinquencies have taken the mantle as the chief concern, with delinquencies in CMBS continuing to rise through October 2023, with office up to 5.75% from 1.75% a year ago.53 Core real estate credit, predominantly in the form of senior mortgages, looks to be the silver lining in the short-term for this asset class and should benefit from a number of factors such as: (i) seniority to real estate equity that provides structural downside protection; (ii) floating rate debt that provides both limited duration risk and higher yields during high interest rate environments; and (iii) low correlation to other alternative asset classes.
Risks: Valuation concerns driven by elevated interest rates and slowing economic growth.
VALUE-ADD AND OPPORTUNISTIC REAL ESTATE
Current Outlook – Positive
Over the course of 2023, pressures have continued to mount for real estate valuations. As cap rates rise and net operating income (NOI) growth moderates to account for a slowdown in rent growth, we expect that valuations for existing properties will come under substantial pressure. We believe the catalyst to this valuation shift will correspond to the relationship between real estate transactions and the cap rates associated with those transactions.
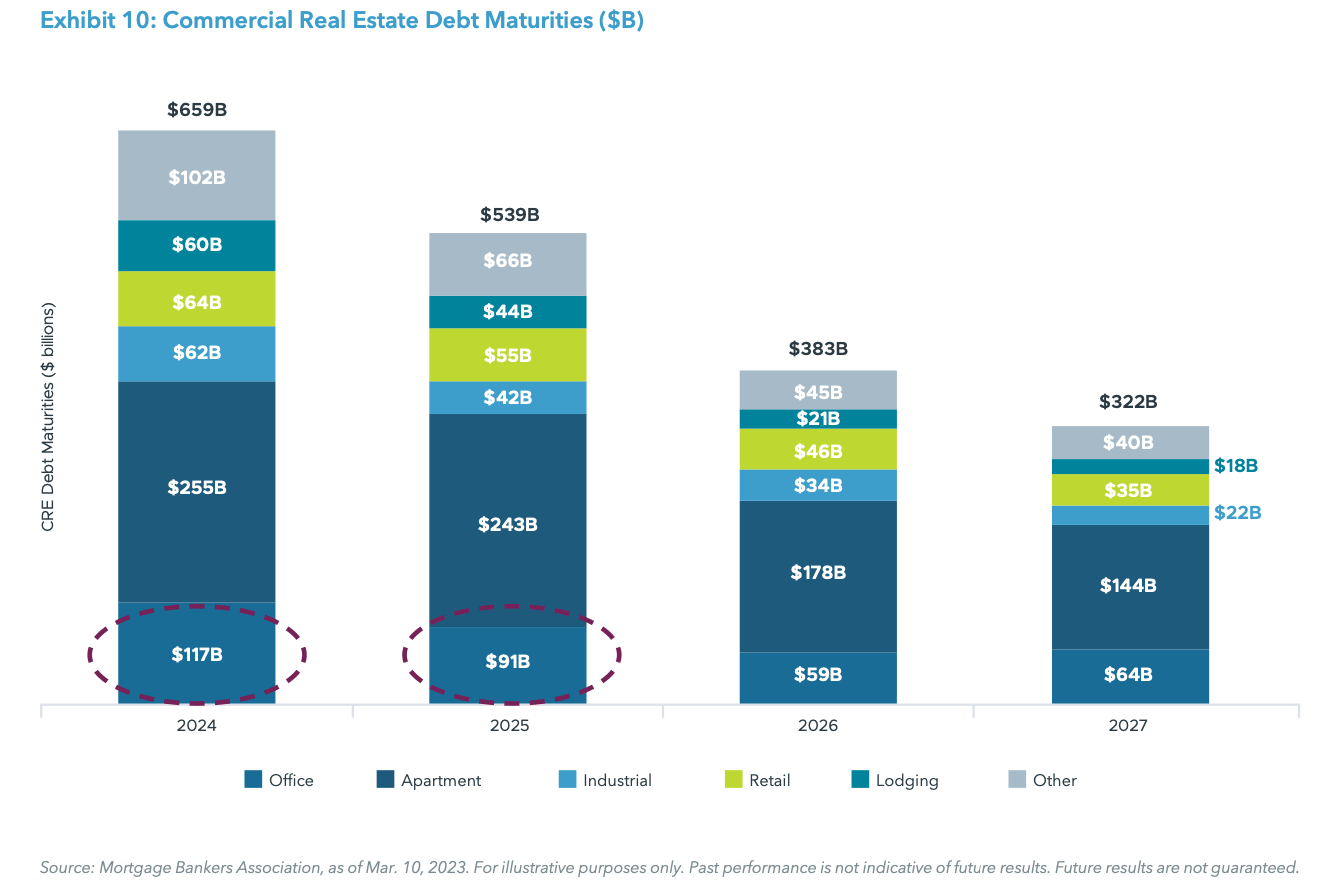
CRE transaction volumes have been the lightest since the 2010-2013 period and bid/ask spreads remain wide.54 Many existing owners bought commercial real estate at valuations that were much greater than what they’d be able to sell at today. Over the next two years, approximately $1.2 trillion of commercial real estate debt will mature in an environment that includes much higher interest rates and fewer banks willing to lend.55
As a consequence, we see several conditions arising that may benefit non-core real estate. First, entry cap rates for acquiring assets will be much higher than they were prior to the Fed’s rate raising cycle. For example, cap rates for multifamily, one of the more stable property types, have risen 155 bps on average over the past year.56 This rise in cap rates has largely been exhibited through stress and distress in valuations, which could be attractive for those buying into this dip. Second, capital expenditure (capex) spending to create value will resurface as a key driver to capital appreciation in these assets. Third, the longer time horizon for putting dry powder to work in these strategies (value-add typically requires some renovation and opportunistic has a fair amount of development) increases the potential to stabilize these properties and to sell them in a much more favorable environment than today. Finally, fund managers will be able to underwrite property types that are experiencing relative strength (e.g., residential, industrial) and avoid property types that have more uncertainty (e.g., office, hotel).
Risks: Long-term valuation concerns driven by slowing economic growth, prompting a deeper real estate correction.
INFRASTRUCTURE
Current Outlook – Neutral
Trend versus Q2 2023 – Same
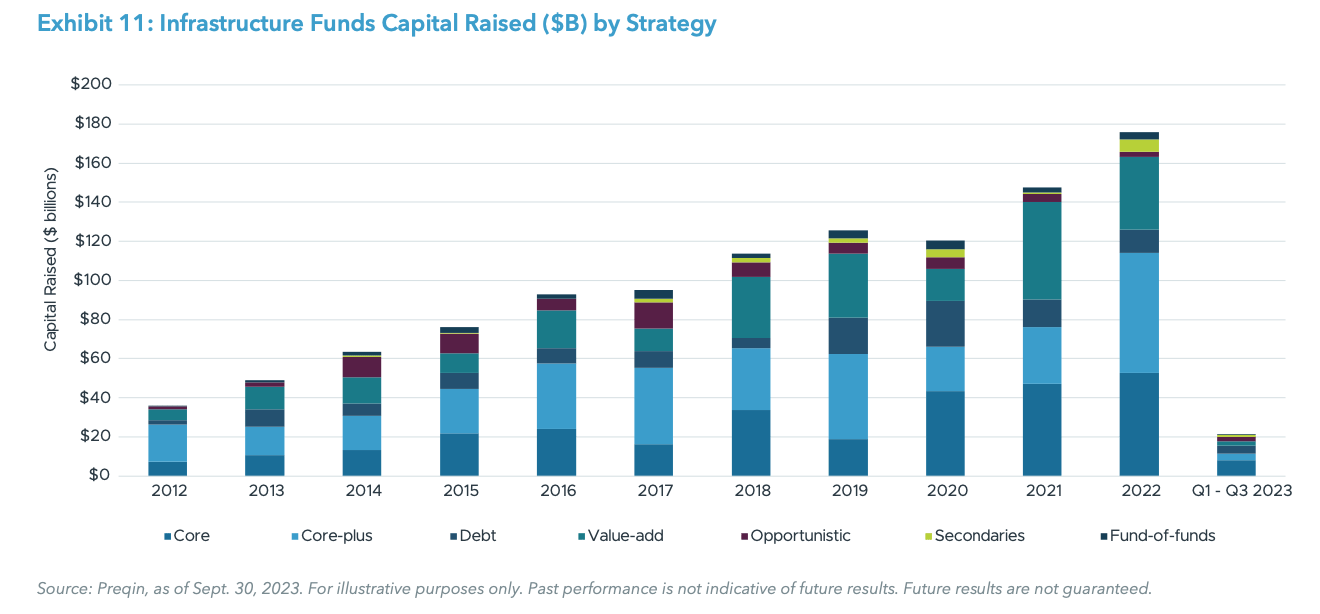
Infrastructure investors have historically looked to the asset class to provide inflation protection and stable returns through contracted cash flows linked to the Consumer Price Index (CPI). The asset class has undergone a reshuffling in recent years due to the green energy transition, geopolitical climate, and shifting macroeconomic conditions. A surge of investor interest in the wake of the passage of the Inflation Reduction Act of 2022 pushed infrastructure fundraising to all-time highs in 2021-22, primarily driven by core and core-plus funds.57
As anticipated, infrastructure funds delivered in a higher inflation environment: from June 2022 (when YoY inflation peaked at 9.1%) through June 2023, the Preqin Infrastructure Index generated an annual return of 11.8%, significantly outperforming the Preqin Private Capital Index annual return of 4.2%.58 Moreover, the Preqin Infrastructure Index’s annual return from June 2022 to June 2023 also exceeded its average annualized return of 9.4% since its December 2007 inception.59 Despite this, fundraising has moderated in the first three quarters of 2023 compared to record-setting prior-year levels, in line with broader private market trends.
Looking forward, elevated interest rates may put downward pressure on valuations through higher discount rates and higher costs of capital to refinance. But, as in the recent past, inflation should also protect asset values because managers can earn higher revenues through CPI-linked price contracts. Persistent inflation may also fuel further investor interest in the asset class. Furthermore, slower fundraising has benefits for managers who can raise capital, as they are now able put it to work with less competition. Significant dry powder remains, with unlisted infrastructure funds sitting on $353 billion, including the amounts raised through intermediate closes which should further strike a floor under valuations.60
Since 2018 there has been a notable uptick in funds raised by value-add infrastructure managers. For these non-core managers, there may be opportunities to drive above-average returns by buying at more attractive valuations and implementing operational improvements (as opposed to relying on leverage to enhance returns on stabilized assets). Telecommunication, particularly digital infrastructure, remains an attractive area of focus, supported by secular trends, such as the expansion of 5G network usage, while transportation projects may be considered riskier because of their sensitivity to economic activity. Finally, energy-related projects face multiple cross currents, with the tailwinds from a renewed focus on energy security balanced by the sector’s relative vulnerability to a recession.
Risks: Valuation concerns driven by elevated interest rates; slowing economic growth impacting GDP-sensitive infrastructure sectors, such as transportation.
ENERGY
Current Outlook – Positive
Trend versus Q2 2023 – Upgrade
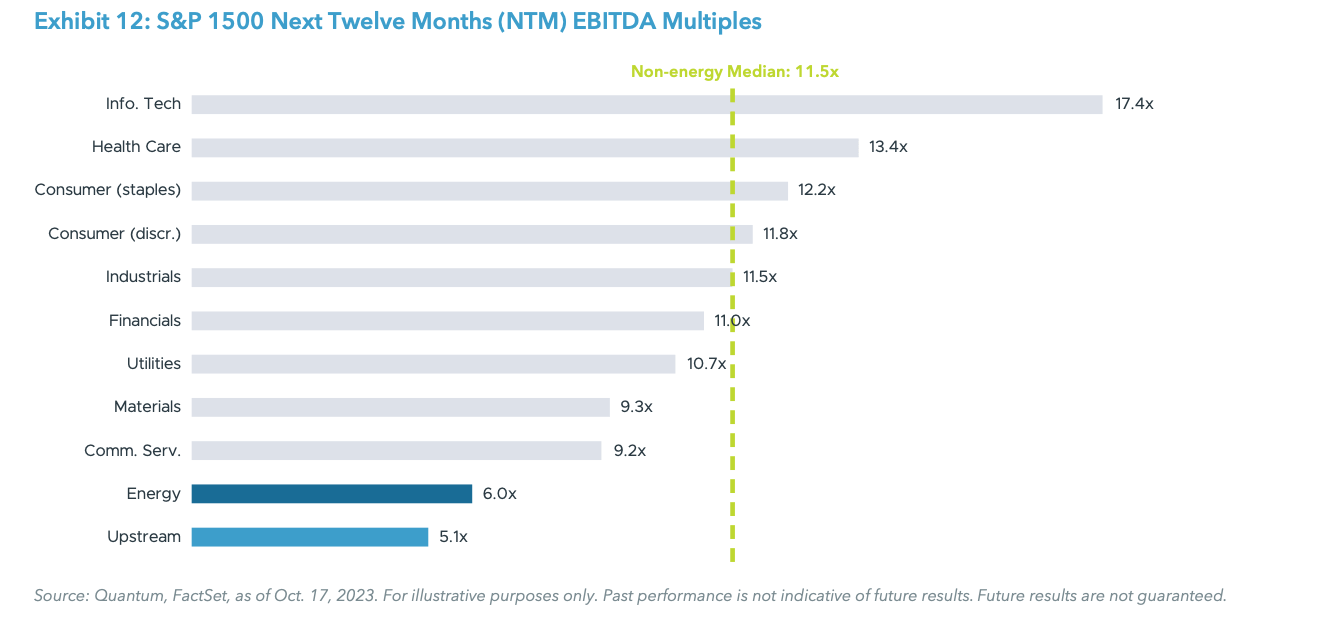
The investing environment for energy could be one of the more attractive in recent years. A mix of factors, including energy security, the slow pace of renewable energy adoption, and years of underinvestment, have combined with a favorable pricing environment to support a positive outlook for energy. These factors have also begun to resonate with alternative investors in the space, as evidenced by the quarter-over-quarter increase in capital raised for natural resources funds (which are predominantly energy) since Q3 2023.61 In the second half of 2023, WTI crude oil rose modestly to a trading range of $75-$95 per/ barrel (bbl), while hitting a high of $95 per/bbl during the period in September 2023.62 Pricing continued to steadily rise following the Organization of the Petroleum Exporting Countries (OPEC) June production cuts announcement.63 Natural gas pricing has also risen steadily during the second half of 2023, reaching a price of $3.61 per/MMBtu.64 Both oil and gas are priced well above their production costs,65 driving strong cash flow while remaining relatively low- priced compared to other sectors.
Energy security concerns have cropped up over the past two years as global conflicts have created supply/demand imbalances that have been constructive for oil and gas prices. Renewable energy adoption will continue to take market share from traditional energy sources; however, the pace of adoption has fallen behind initial expectations. A key factor in the slowdown of adoption has been the dramatic increase of input prices due to inflation, higher cost of debt, and supply chain constraints that are necessary to support renewable technologies.66 Ørsted, one of the world’s largest offshore wind companies, announced in October that it was abandoning two of its eight offshore wind projects in development in the U.S., citing project delays, permitting timelines, and increased interest rates.67 Years of declining energy capex due to poor returns and environmental, social, and governance (ESG) concerns have led to structural underinvestment despite continued energy demand growth. While renewable sources of energy have met some of the incremental demand, traditional energy sources remain the primary supply source. Additionally, OPEC’s shift from taking market share with higher production rates to curbing production has benefited oil prices and production profitability. One sign of the energy market warming up has been the pickup in notable mergers, with announcements of ExxonMobil’s acquisition of Pioneer Natural Resources68 and Chevron’s acquisition of Hess.69 These deals represent the first major M&A transactions by large public energy companies in years and could signal oil and gas as a continued focal point of deal activity into 2024.
Risks: Elevated Interest rates slowing economic growth, bringing supply and demand back into balance; unpredictable supply side issues concerning OPEC’s approach; geopolitical risks increasing energy security concerns.
INTERNATIONAL
EUROPE
Current Outlook – Neutral
Trend versus Q2 2023 – Same
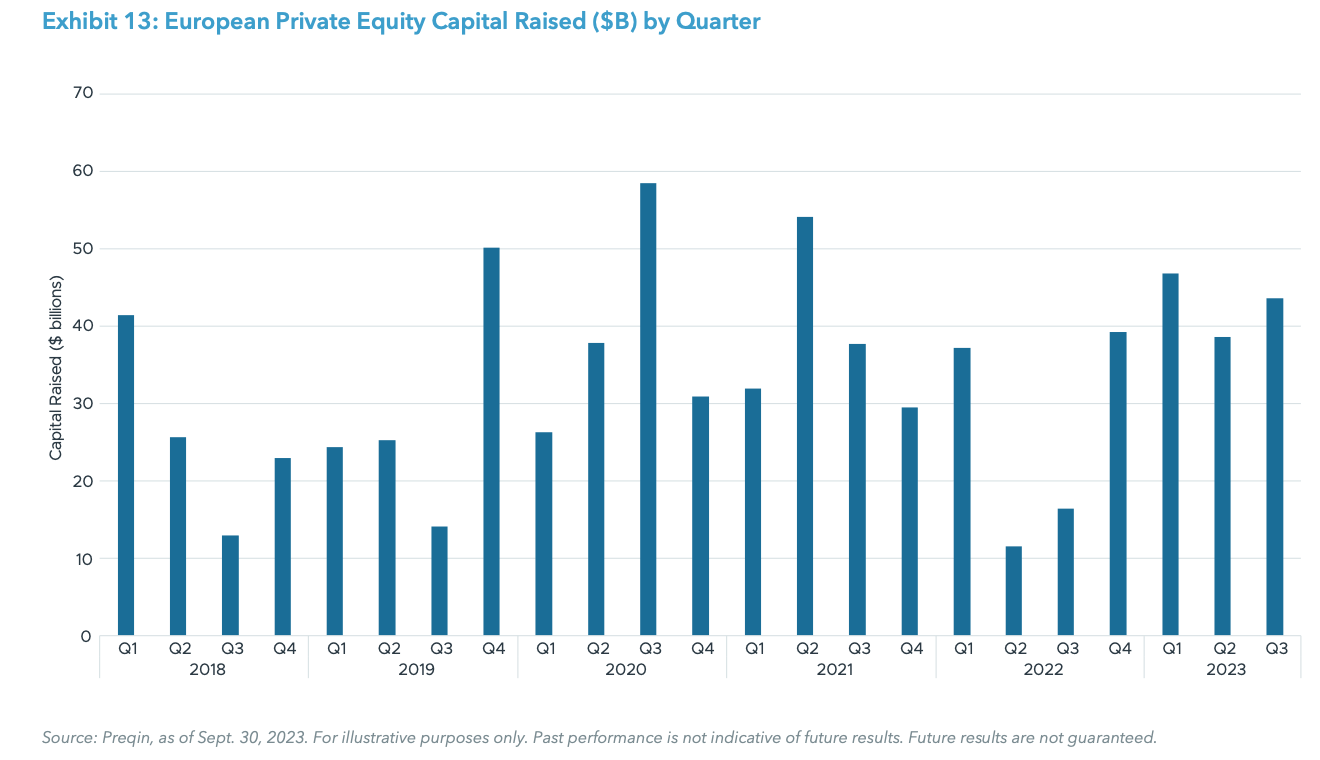
Capital raising in Europe is consolidating in the hands of fewer players: in the first three quarters of 2023, mega funds drove private equity fundraising in Europe, with the top five funds accounting for over half (54%) of capital raised.70 Fundraising activity picked up in 2023, with a total of $129.7 billion in capital raised in the first three quarters of 2023, double the amount raised over the same period in 2022 ($65.5 billion and back in line with fundraising levels in 2021 and 2020.71
Despite a recovery in aggregate fundraising led by a handful of large funds, deal activity in Europe remains subdued in Q3 2023. European private equity deal value was down 4.7% as compared to Q2 2023, and down 2.8% YoY.72 Deal activity in the first three quarters of 2023 was higher than pre-2020, however down an average of 21% versus the record quarters of 2021 and 2022.73 In terms of deal size, it is the larger end of the market that is projected to suffer the most from a volume perspective, suggesting that the lower and middle-market remain relatively more resilient: over the first three quarters of the year, the number of mega-deals (defined as larger than $1 billion) is down 77% as compared to the full year 2022; over the same period, deals smaller than $1 billion were down an average of 57%.74 The prospect of rates staying elevated for longer will affect the sponsors’ approach to leverage, prompting a refocus away from the larger end of the market. Similarly to fund sponsors in other regions, European PE managers have become more opportunistic in their approach to dealmaking. As an example, Financial Services is having a record year: deal activity year-to-date as of September is already higher than any previous full year in Europe. Three other sectors that continued to be a core investment focus were Business-to-business (B2B), Information Technology, and Business-to-consumer (B2C), which accounted respectively for 34%, 22%, and 13% of aggregate deal value of European private equity activity.75 Despite Europe seeming to somewhat hold in relative terms as compared to the U.S., on the back of the uncertain macroeconomic scenario impended by both existing and latent geopolitical crisis in the region, we remain neutral on our outlook for Europe.
Risks: Valuation concerns driven by elevated interest rates and slowing economic growth; uncertainty around exit environment; mortgage crisis in Southern Europe; political volatility; escalation of the conflict in Ukraine.
ASIA
Current Outlook – Neutral
Trend versus Q2 2023 – Same
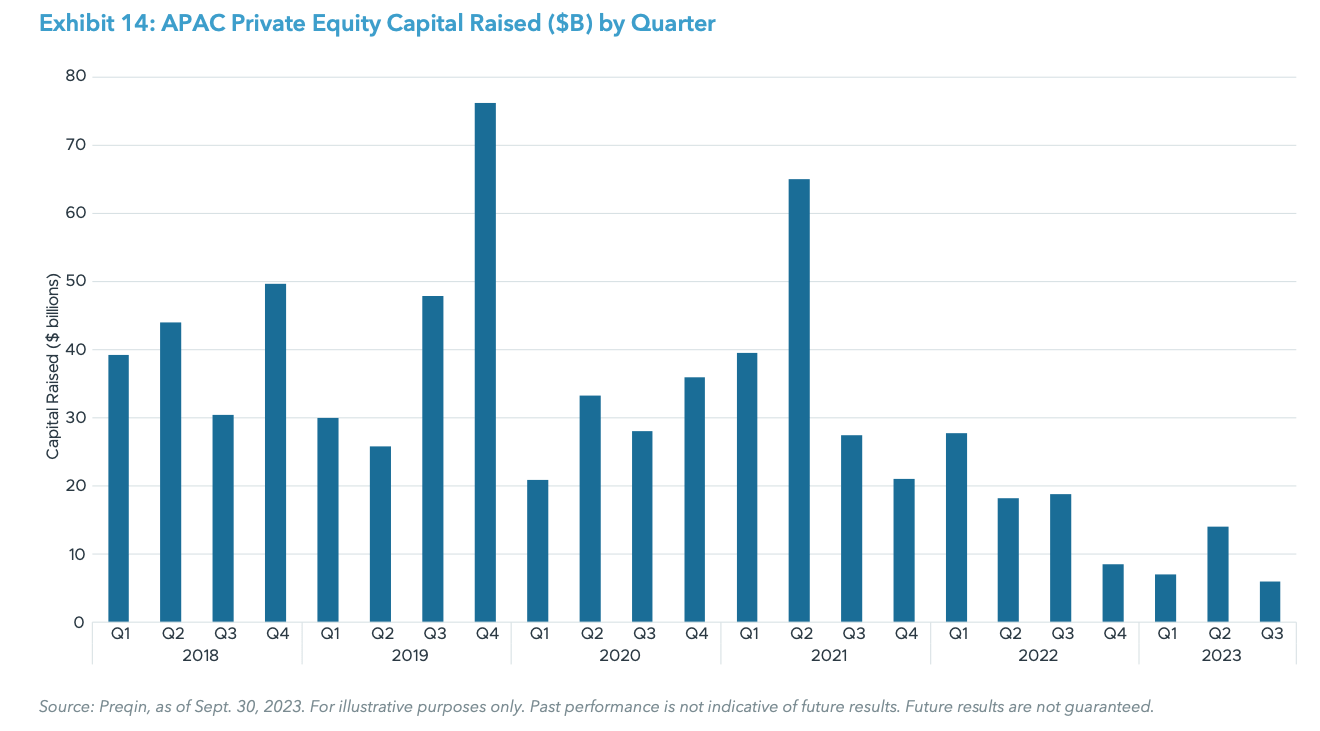
Fundraising for private equity strategies in Asia has substantially decreased over the past few quarters, with private equity funds in the APAC region raising $26.6 billion in the first three quarters of 2023, a 59% YoY decrease and a staggering 80% drop relative to the record first three quarters of 2021 ($131.1 billion).76 In Q3 2023, deal activity in APAC fell to $12.7 billion, down 29% from $18 billion in Q2. Aggregate deal value stood at $61.4 billion in Q3 2023, a 42% decline compared to capital deployed over the same period in 2022, and a five-year low.77
While deal-making contracted in most APAC regions, in the first three quarters of 2023 deal activity in Japan and India expanded by 26.9% and 12.7%, respectively.78 From a sector perspective, almost half of capital deployed in the first three quarters of 2023 in APAC was allocated to Consumer Discretionary and Raw Materials & Natural Resources (27.8% and 20.0%, respectively), while Information Technology accounted for 14.1% of total deal value, halving its relative share as compared to the first three quarters of 2022.79
On August 9, 2023, U.S. President Joe Biden issued an Executive Order prohibiting certain outbound U.S. investments to China in several key technology sectors.80 These restrictions may result in subdued deal activity, or a shift towards sectors other than technology. On the back of largely cautious investor sentiment in China, which has been a bigger portion of the APAC investment opportunities over the past decade, fundraising remains weak. Capital raised in the region is on track to be the lowest in a decade; at the current pace, private equity fundraising in 2023 is expected to be over 90% lower than the record year in 2016.81 Chinese PE firms investing mainly in the Greater China region are currently facing a number of obstacles, including the slow economic recovery, a slump in stock-market valuations, regulatory uncertainties, limited investment exit routes, and reluctance among overseas investors to allocate capital to Chinese assets. However, China remains a driver of global growth, with annual GDP in China forecasted to expand 4.2% in 2024,82 substantially faster than the expected growth rate of major developed economies such as the U.S. (2.1%) and the E.U. (1.3%).83 On balance, we remain neutral on our outlook for Asia.
Risks: Valuation concerns driven by elevated interest rates and slowing economic growth; uncertainty around exit environment; cross-border complexities, ever-tightening regulation, and escalating geopolitical tensions may make investors cautious.
HEDGE FUNDS
EQUITY HEDGE
Current Outlook – Neutral
Trend versus Q2 2023 – Same
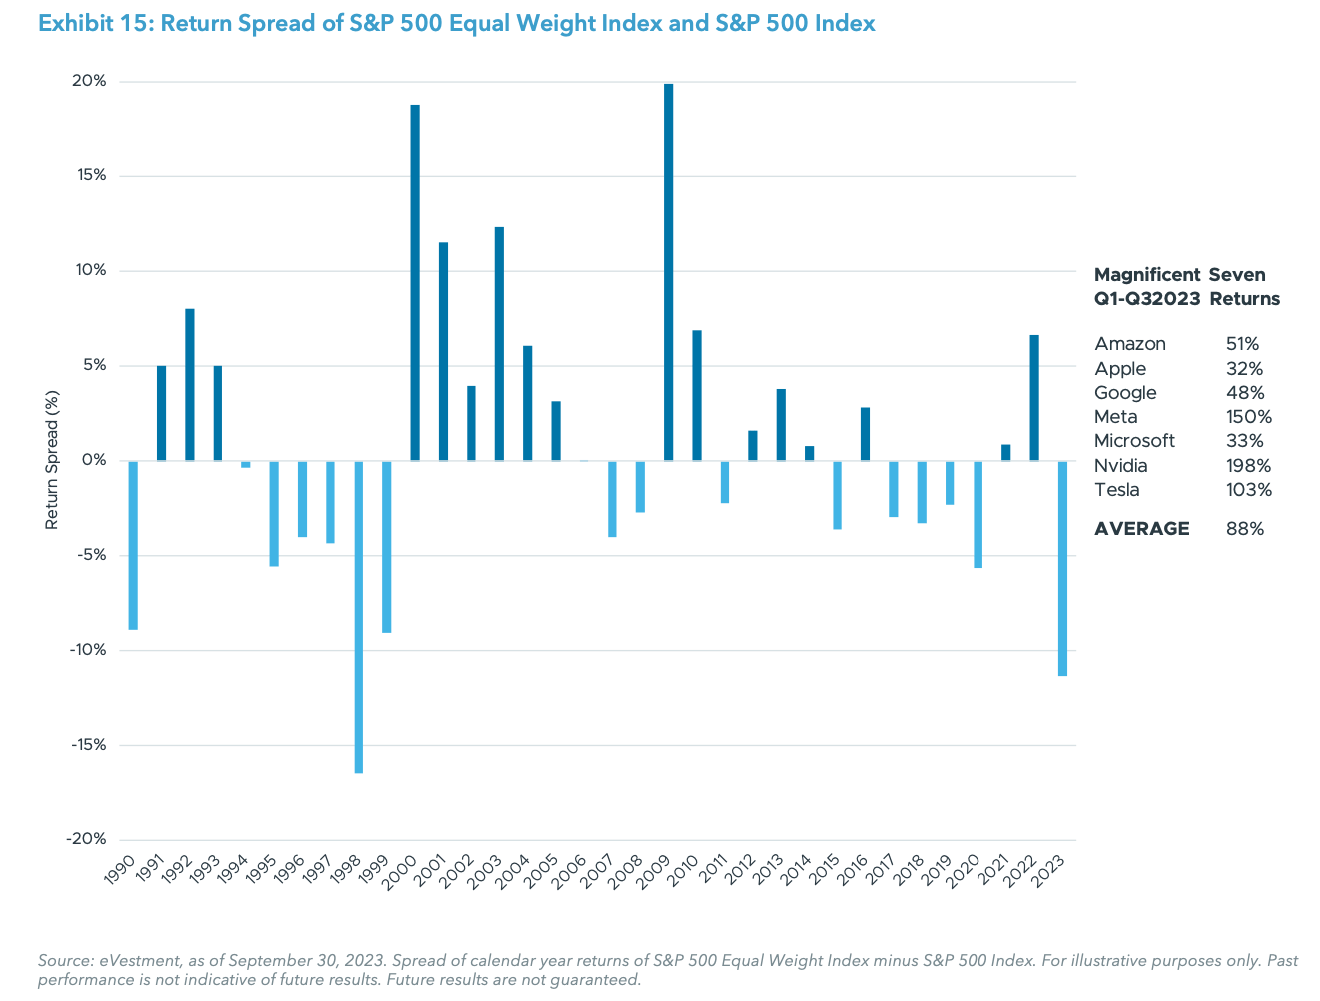
Equity hedge funds have produced positive returns in 2023, but have generally trailed broader equity market measures. Narrow market leadership has proved challenging for long- short practitioners. Outsized gains from the Magnificent Seven84 stocks have driven a historically wide spread between market cap weighted (S&P 500 Index: +13.1%) and equally weighted (S&P 500 Equal-Weighted Index: +1.8%) benchmark performance.85 These seven mega-cap companies—all tied to the artificial intelligence (AI) theme— also drove the outperformance of the NASDAQ Composite Index through the first three quarters of 2023.86
Looking ahead, slowing economic growth may contribute to a more uneven environment for corporate earnings. Against this backdrop, higher single-stock volatility and broader price dispersion would be supportive of two-way stock picking efforts. Inflation trends and central bank policies are likely to remain in focus in 2024. Higher- for-longer rates may exert pressure on price-earnings multiples, while a more dovish rate backdrop could provide a tailwind for markets and long-leaning strategies.
Regional equity market performance may vary as local governments and central banks respond to the changing outlook for inflation and economic growth, as well as the evolving geopolitical landscape.
Risks: Beta headwinds overshadow alpha generation; slowing economic growth in U.S. and abroad; macro factors dominating company fundamentals; falling dispersion among individual issuers and dispersion being limited to a small number of themes; sharp style and factor imbalances (e.g., growth vs. value).
EVENT DRIVEN
Current Outlook – Neutral
Trend versus Q2 2023 – Same
Event driven funds have advanced in 2023 amidst a mixed backdrop for the strategy. Risk assets have rebounded, but overall corporate activity remains well below peak levels of prior years. Across the strategy group, activist funds have benefited from long-leaning positioning in the equity markets, while credit-focused funds have taken advantage of higher yields and companies’ need for alternative sources of financing. Merger arbitrage performance has been tempered by lower deal volumes and increased regulatory scrutiny of larger strategic transactions.
While growth in the U.S. has risen considerably in 2023,87 it remains relatively dormant in other parts of the global economy such as the European Union,88 forcing many international companies to target new ways of unlocking shareholder value providing a target-rich environment for event-driven specialists.
Looking ahead, economic uncertainty and higher financing costs are expected to continue to weigh on overall corporate activity. Global managers who can create their own catalysts and drive investment outcomes—through shareholder activism, providing capital solutions, or leading corporate restructurings—are likely to have an advantage going forward. Special situation funds, which invest across the corporate capital structure, also remain well-positioned to capture relative value opportunities in both equity and credit.
Risks: Tight financial conditions and economic uncertainty further constrain capital markets activity; beta overshadows alpha as events/catalysts are offset by market volatility; more restrictive regulatory backdrop dampens dealmaking.
CREDIT
Current Outlook – Positive
Trend versus Q2 2023 – Same
Credit hedge funds have gained in the first three quarters of 2023, outperforming the Bloomberg Global-Aggregate Bond and U.S. Aggregate Bond Indexes.89 Lower quality credits have generally outperformed higher quality across the fixed income markets. Among high-yield bonds, spread tightening has more than offset the impact of rising rates, while leveraged loans, which are primarily floating rate instruments, have benefited from the lift in yields.
Amidst tighter financial conditions and a slowing economy, near term performance is more likely to be driven by yield rather than spread compression. Managers who can provide capital solutions by sourcing primary deals and structuring transactions remain well positioned to capture the yields that the current backdrop presents.
Securitized credit remains attractive, albeit to varying degrees across sub-segments. Managers continue to find opportunities in residential mortgage-backed securities (RMBS), particularly among older vintages, and in more specialized segments such as credit risk transfer (CRT) and non-performing loans (NPLs). Conversely, consumer- facing asset backed securities (ABS) may be pressured as household balance sheets become increasingly stretched, while parts of the commercial mortgage back securities (CMBS) market, such as office, remain challenged by supply/demand imbalances.
After two challenging years, municipal bonds may regain their footing as pressure from outflows abates and investors look to capture attractive after-tax yields.
Risks: Slowing economic growth; sharply widening spreads and a steeper default cycle; low dispersion and dampened volatility across fixed income; abrupt changes in liquidity in certain segments.
MACRO
Current Outlook – Positive
Trend versus Q2 2023 – Same
Macro strategies have posted modest gains in the first three quarters of 2023,90 with mixed results across assets classes. Discretionary macro managers have fared comparatively better this year, benefiting from positioning in rates and equities, while systematic macro strategies have been hampered by trend reversals in areas such as foreign exchange and commodities.
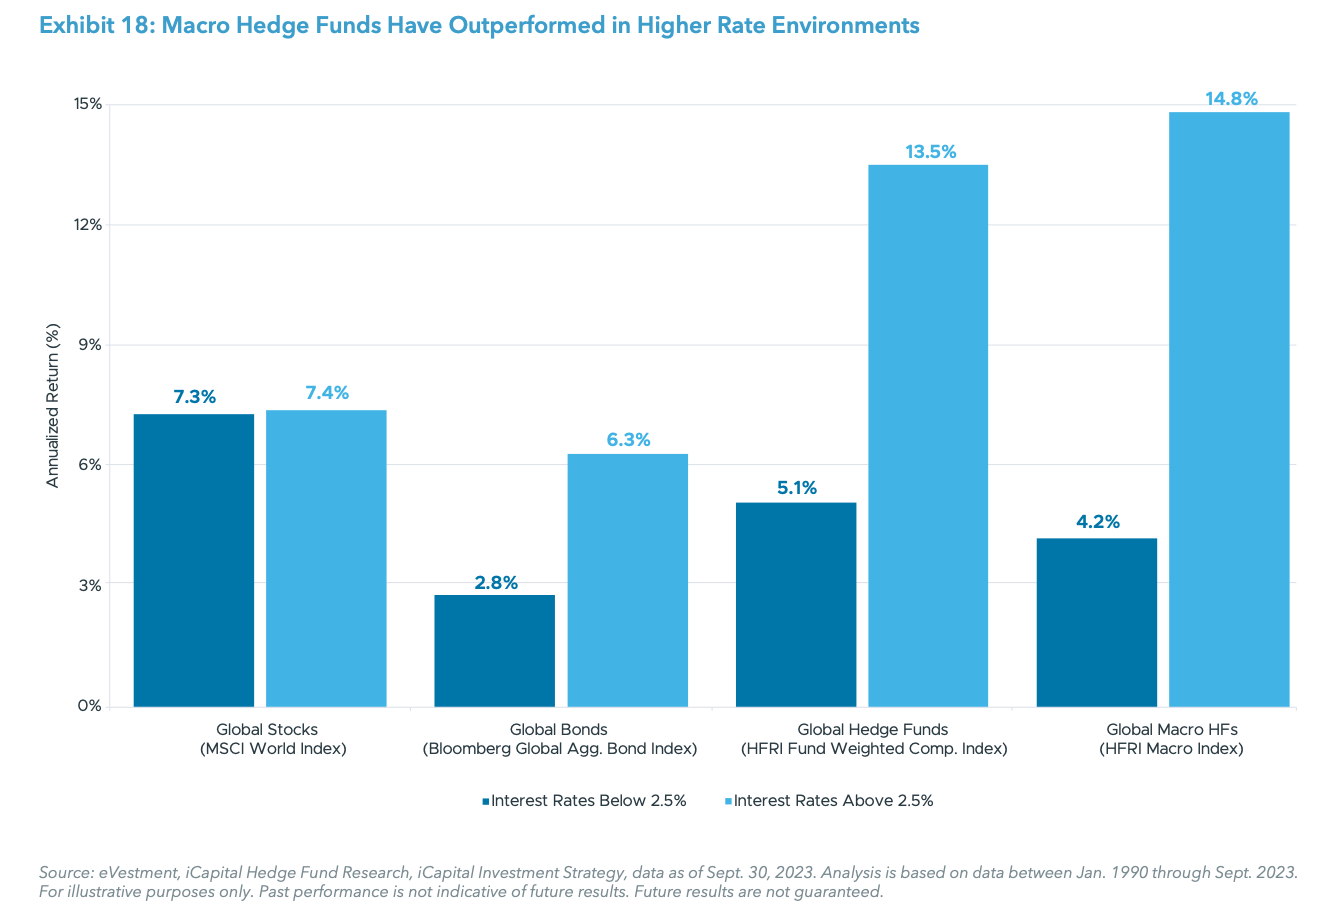
Volatility remains elevated, albeit below last year’s recent peak levels.91 Uncertainty around economic growth and the inflation outlook is likely to contribute to ongoing bouts of volatility across risk assets. While the current rate tightening cycle may be nearing an end, varied monetary responses across key global markets should continue to provide attractive trading opportunities for macro funds. Some central bankers may indeed ease rates in 2024, but rates are likely to remain elevated compared to prior cycles,
providing an attractive environment for macro strategies, which generally performed far better during periods of higher interest rates and market volatility.92
Additionally, geopolitical factors may exert a greater influence on the market backdrop in the coming year. Conflicts in Europe and the Middle East remain in the headlines and continue to impact supply/demand dynamics in certain markets, particularly in commodities. In the U.S., the upcoming presidential election will garner increasing attention from investors as they weigh the possible outcomes and potential shifts in fiscal policy.
Performance among individual macro funds remains widely varied, highlighting the importance of manager selection in the segment.
Risks: Dampened volatility across assets; sharp reversals in key investment themes; converging fiscal and monetary policies globally; return to “easy money” by global central banks; uncertain impact of anti- globalization/protectionist policies.
MULTI-STRATEGY
Current Outlook – Positive
Trend versus Q2 2023 – Same
Multi-strategy funds have generated modest positive returns in 2023,93 while maintaining low volatility and limited correlation to traditional stocks and bonds. Results across sub-strategies—and among practitioners— have been mixed. The leading funds have benefited from profitable trading in macro and long-short equity, while the backdrop for certain arbitrage and quantitative strategies has been more challenging.
The outlook for multi-strategy funds remains favorable. Tighter financial conditions and slowing economic growth should continue to drive dispersion both within and
across asset classes, providing an attractive backdrop for relative value trading opportunities. Globally diversified funds typically provide broad exposure across asset classes, sectors, and geographies, and can dynamically rotate capital among teams of trading specialists to take advantage of evolving market opportunities.
While the segment continues to attract new entrants, the leading multi-strategy platforms differentiate themselves through their growing and/or longer duration capital bases, flexible compensation structures, and access to robust technology resources.
Risks: Dampened volatility across asset classes; lower dispersion/higher correlation among individual issuers; unbalanced or excessive risk factor exposures; growing competition for investment talent; unconstrained AUM growth.
ENDNOTES
1. PitchBook, Q3 2023 U.S. PE Breakdown Summary, Oct. 10, 2023. Historical average includes data from 2008-2022.
2. PitchBook, as of June 30, 2023.
3. PitchBook, Q3 2023 U.S. PE Breakdown Summary, Oct. 10, 2023. Historical average includes data from 2008-2022.
4. Preqin, as of November 15, 2023.
5. PitchBook, Q2 2023 U.S. PE Middle Market Report, Sept. 12, 2023.
6. PitchBook, Q2 2023 U.S. PE Middle Market Report, Sept. 12, 2023.
7. PitchBook, Q2 2023 U.S. PE Middle Market Report, Sept. 12, 2023; PitchBook, Q2 2023 U.S. Public PE and GP Deal Roundup, Aug. 29, 2023.
8. FactSet Earnings Insight, Nov. 10, 2023.
9. McKinsey & Company, Private Equity Turns to Resiliency Strategies for Software Investments, Mar. 29, 2023.
10. PitchBook, Q3 2023 U.S. PE Breakdown, Oct. 9, 2023.
11. PitchBook, Q3 2023 PitchBook-NVCA Venture Monitor, Oct. 10, 2023. Data of Sept. 30, 2023. Venture growth categorized as Series E or later.
12. PitchBook, Q3 2023 PitchBook-NVCA Venture Monitor, Oct. 10, 2023. Data of Sept. 30, 2023. Venture growth categorized as Series E or later.
13. Bloomberg, iCapital Investment Strategy, as of Oct. 31, 2023.
14. PitchBook, Q3 2023 PitchBook-NVCA Venture Monitor, Oct. 10, 2023. Data of Sept. 30, 2023.
15. PitchBook, Q3 2023 PitchBook-NVCA Venture Monitor, Oct. 10, 2023. Data of Sept. 30, 2023.
16. PitchBook, Q3 2023 PitchBook-NVCA Venture Monitor, Oct. 10, 2023. Data of Sept. 30, 2023.
17. PitchBook, Q3 2023 PitchBook-NVCA Venture Monitor, Oct. 10, 2023. Data as of Sept. 30, 2023. Non-traditional investors include corporations, private equity buyout/growth, asset managers, hedge funds, mutual, funds, and sovereign wealth funds.
18. PitchBook, Q3 2023 PitchBook-NVCA Venture Monitor, Oct. 10, of Sept. 30, 2023.
19. PitchBook, Q3 2023 PitchBook-NVCA Venture Monitor, Oct. 10, of Sept. 30, 2023.
20. PitchBook, Q3 2023 PitchBook-NVCA Venture Monitor, Oct. 10, of Sept. 30, 2023.
21. PitchBook, Q3 2023 PitchBook-NVCA Venture Monitor, Oct. 10, of Sept. 30, 2023.
22. PitchBook, Q3 2023 PitchBook-NVCA Venture Monitor, Oct. 10, of Sept. 30, 2023.
23. PitchBook, Q3 2023 PitchBook-NVCA Venture Monitor, Oct. 10, of Sept. 30, 2023.
24. PitchBook, Q3 2023 PitchBook-NVCA Venture Monitor, Oct. 10, of Sept. 30, 2023.
25. PitchBook, Q3 2023 PitchBook-NVCA Venture Monitor, Oct. 10, of March 31, 2023.
26. Jefferies, H1 2023 Global Secondary Market Review, July 2023.
27. PitchBook, PitchBook Analyst Note: Secondaries and Liquifying Investment Webinar Recap, July 10, 2023.
28. Jefferies, H1 2023 Global Secondary Market Review, July 2023.
29. Jefferies, H1 2023 Global Secondary Market Review, July 2023.
30. Jeffries, H1 2023 Global Secondary Market Review, July 2023.
31. Jefferies, H1 2023 Global Secondary Market Review, July 2023.
32. Jefferies, H1 2023 Global Secondary Market Review, July 2023; Preqin, Strategy in Focus: Private Equity Secondaries, July 10, 2023.
33. Jefferies, H1 2023 Global Secondary Market Review, July 2023.
34. PitchBook, as of Sept. 30, 2023.
35. Preqin, as of Mar. 31, 2023.
36. Cliffwater, as of June 30, 2023.
37. eVestment, as of September 30, 2023.
38. Federal Reserve Bank of New York, Dec. 13, 2023.
39. Cliffwater, as of June 30, 2023.
40. PitchBook Q3 2023 U.S. PE Breakdown, Oct. 9, 2023.
41. PitchBook, Q3 2023 U.S. PE Breakdown, Oct. 9, 2023.
42. Proskauer, Proskauer’s Q3 2023 Private Credit Default Index Highlights the Resilience of Private Credit in a Turbulent Economy, Oct. 24, 2023.
43. eVestment, as of September 30, 2023.
44. Federal Reserve, as of Nov. 27, 2023.
45. Fitch Ratings, as of Oct. 30, 2023.
46. Marathon Asset Management, The 2023-2024 Credit Cycle: Public & Private Credit Outlook & Opportunities, as of June 30, 2022.
47. Monarch Capital Partners VI, May 2023.
48. Fitch Ratings, Leveraged Loan, High Yield Default Rates to Rise in 2024, Fall in 2025, Dec. 4, 2023.
49. Fitch Ratings, Leveraged Loan, High Yield Default Rates to Rise in 2024, Fall in 2025, Dec. 4, 2023.
50. NCREIF, as of Sept. 30, 2023.
51. Source: Altus Group, “Is low transaction volume masking office distress?” Aug. 21, 2023
52. Green Street, Spooky Commercial Real Estate Statistics Just in Time for Halloween, Oct. 25, 2023.
53. Trepp, CMBS Delinquency Report, Oct. 2023.
54. Mortgage Bankers Association, MBA NewsLInk, Mar. 13, 2023.
55. Mortgage Bankers Association, Chart of the Week, Mar. 10, 2023.
56. CBRE Research, Higher Rates Push Up Prime Multifamily Cap Rates in Q3, Oct. 5, 2023.
57. Preqin, June 1, 2022 to June 30, 2023.
58. Preqin, Dec. 1, 2023 to June 30, 2023.
59. Preqin, as of June 30, 2023.
60. Preqin, Infrastructure Q3 2023: Preqin Quarterly Update, Oct. 31, 2023. Data as of Mar. 31, 2023.
61. Preqin, Natural Resources Q3 2023: Preqin Quarterly Update, Oct. 31, 2023. 62. Bloomberg, iCapital Investment Strategy, as of November 2, 2023.
63. 35th OPEC and non-OPEC Ministerial Meeting, June 4, 2023.
64. Koyfin, as of Nov. 1, 2023.
65. Federal Reserve Bank of Dallas, Dallas Fed Survey Q1 2023, Mar. 29, 2023; S&P Global, as of April 12, 2023.
66. International Energy Agency, Critical Minerals, as of Nov. 28, 2023.
67. Ørsted, Ørsted Ceases Development of Ocean Wind 1 and Ocean Wind 2 and Takes Final Investment Decision on Revolution Wind, Oct. 31, 2023.
68. ExxonMobil, ExxonMobil Announces Merger with Pioneer Natural Resources in an All-stock Transaction, Oct. 11, 2023.
69. Chevron, Chevron Announces Agreement to Acquire Hess, Oct. 23, 2023. 70. Preqin, as of Sept. 30, 2023. Private equity excludes venture capital.
71. Preqin, as of Sept. 30, 2023.
72. PitchBook, Q3 2023 European PE Breakdown, Oct. 17, 2023. Data as of Sept. 30, 2023.
73. PitchBook, as of Sept. 30, 2023.
74. PitchBook, as of Sept. 30, 2023.
75. PitchBook, as of Sept. 30, 2023.
76. Preqin, as of Sept. 30, 2023.
77. Preqin, as of Sept. 30, 2023.
78. Preqin, as of Sept. 30, 2023.
79. Preqin, as of Sept. 30, 2023.
80. The White House, Executive Order on Addressing United States Investments in Certain National Security Technologies and Products in Countries of Concern, as of Aug. 9, 2023.
81. Preqin, as of Sept. 30, 2023.
82. International Monetary Fund, Regional Economic Outlook for Asia and Pacific, October 2023.
83. Goldman Sachs, The U.S. economy is on its Final Descent to a Soft Landing, Nov.15, 2023; European Commission, Autumn 2023 Economic Forecast: A Modest Recovery Ahead after a Challenging Year, Nov. 15, 2023.
84. The Magnificent Seven are Apple, Amazon, Alphabet, Nvidia, Meta, Microsoft, and Tesla.
85. eVestment, Bloomberg, iCapital Investment Strategy, as of Sept. 30, 2023. 86. eVestment, Bloomberg, iCapital Investment Strategy, as of Sept. 30, 2023. 87. GDP Estimate for Q3 2023: +5.2%, Bureau of Economic Analysis, U.S. Department of Commerce, as of Nov. 29, 2023.
88. GDP Estimate for Q3 2023: -.1%, Eurostat, European Union, as of Nov. 14, 2023. 89. eVestment, as of Sept. 30, 2023.
90. eVestment, HFRI Macro Index, as of Sept. 30, 2023.
91. Bloomberg, iCapital Investment Strategy, as of Sept. 30, 2023.
92. eVestment, iCapital Hedge Fund Research, iCapital Investment Strategy, as of Dec. 7, 2023.
93. eVestment, HFRI RV: Multi-Strategy Index, as of Sept. 30, 2023. Q2 2023 U.S. Public PE and GP Deal Roundup, Aug. 29, 2023.
INDEX DEFINITIONS
Bloomberg Global Aggregate Bond Index: A flagship measure of global investment grade debt from a multitude local currency markets. This multi-currency benchmark includes treasury, government-related, corporate and securitized fixed-rate bonds from both developed and emerging markets issuers.
Bloomberg U.S. Aggregate Bond Index: A broad base, market capitalization-weighted bond market index. The index includes Treasury securities, government agency bonds, mortgage-backed bonds, corporate bonds, and several foreign bonds traded in the United States.
Bloomberg U.S. Corporate Bond Index: Measures the investment grade, fixed-rate, taxable corporate bond market. It includes USD-denominated securities publicly issued by U.S. and non-U.S. industrial, utility, and financial issuers.
Cliffwater Direct Lending Index (CDLI): An asset-weighted index of over 11,000 directly originated middle market loans totaling $264B. It seeks to measure the unlevered, gross of fee performance of U.S. middle market corporate loans, as represented by the asset-weighted performance of the underlying assets of Business Development Companies (BDCs), including both exchange-traded and unlisted BDCs, subject to certain eligibility requirements.
Financial Impulse Growth Index: Measures the cumulative effect of changes in key indicators on the financial environment and quantifies this effect as the impact on GDP growth in the coming year. Positive values denote headwinds while negative values denote tailwinds to GDP growth over the next year.
Golub Capital Altman Index (GCAI): Measures the actual revenue and EBITDA (earnings before interest, taxes, depreciation and amortization) growth of U.S. middle market private companies for the first two months of each calendar quarter and provides insight into anticipated quarterly performance of U.S. public companies.
HFRI Fund Weighted Composite Index: A global, equal-weighted index of single-manager funds that report to HFR Database. Constituent funds report monthly net of all fees performance in US Dollar and have a minimum of $50 Million under management or $10 Million under management and a twelve (12) month track record of active performance. The HFRI Fund Weighted Composite Index does not include Funds of Hedge Funds.
HFRI Macro Index: Investment Managers which trade a broad range of strategies in which the investment process is predicated on movements in underlying economic variables and the impact these have on equity, fixed income, hard currency and commodity markets. Managers employ a variety of techniques, both discretionary and systematic analysis, combinations of top-down and bottom-up theses, quantitative and fundamental approaches and long and short term holding periods. Although some strategies employ RV techniques, Macro strategies are distinct from RV strategies in that the primary investment thesis is predicated on predicted or future movements in the underlying instruments, rather than realization of a valuation discrepancy between securities. In a similar way, while both Macro and equity hedge managers may hold equity securities, the overriding investment thesis is predicated on the impact movements in underlying macroeconomic variables may have on security prices, as opposes to EH, in which the fundamental characteristics on the company are the most significant are integral to investment thesis.
HFRI RV: Multi-Strategy Index: Multi-Strategies employ an investment thesis is predicated on realization of a spread between related yield instruments in which one or multiple components of the spread contains a fixed income, derivative, equity, real estate, MLP, or combination of these or other instruments. Strategies are typically quantitatively driven to measure the existing relationship between instruments and, in some cases, identify attractive positions in which the risk adjusted spread between these instruments represents an attractive opportunity for the investment manager. In many cases these strategies may exist as distinct strategies across which a vehicle which allocates directly, or may exist as related strategies over which a single individual or decision making process manages. Multi-strategy is not intended to provide broadest- based mass market investors appeal, but are most frequently distinguished from others arbitrage strategies in that they expect to maintain >30% of portfolio exposure in two or more strategies meaningfully distinct from each other that are expected to respond to diverse market influences.
ICE BofA U.S. High Yield Index: Tracks the performance of U.S. dollar denominated below investment grade rated corporate debt publicly issued in the U.S. domestic market. MSCI World Index: Captures large and mid-cap representation across 23 Developed Markets (DM) countries. With 1,633 constituents, the index covers approximately 85% of the free float-adjusted market capitalization in each country.
Morningstar LSTA US Leveraged Loan Index: Designed to deliver comprehensive, precise coverage of the US leveraged loan market. Underpinned by PitchBook | LCD data, the index brings transparency to the performance, activity, and key characteristics of the market.
NASDAQ Composite Index: A market capitalization-weighted index of more than 2,500 stocks listed on the Nasdaq stock exchange. It is a broad index that is heavily weighted toward the important technology sector. The index is composed of both domestic and international companies.
NCREIF Property Index (NPI): A quarterly, unleveraged composite total return for private commercial real estate properties held for investment purposes only. All properties in the NPI have been acquired, at least in part, on behalf of tax-exempt institutional investors and held in a fiduciary environment.
Preqin Infrastructure Index: Captures the return earned by investors on average in infrastructure funds within Preqin’s database, based on the actual amount of money invested in infrastructure funds. Performance is calculated from the pool of closed-end funds for which comprehensive performance data is held, as of both the start and end of the quarter.
Preqin Private Capital Index: Captures the return earned by investors on average in their private capital portfolios within Preqin’s database, based on the actual amount of money invested in private capital partnerships. Performance is calculated from the pool of closed-end funds for which comprehensive performance data is held, as of both the start and end of the quarter.
Proskauer Private Credit Default Index: Tracks senior-secured and unitranche loans in the U.S. and breaks down default rates by EBIDTA and industry as well as default type. S&P 500 Index: The S&P 500 is widely regarded as the best single gauge of large-cap U.S. equities. The index includes 500 of the top companies in leading industries of the U.S. economy and covers approximately 80% of available market capitalization.
S&P 500 Equal-Weighted Index: The equal-weight version of the widely-used S&P 500. The index includes the same constituents as the capitalization weighted S&P 500, but each company in the S&P 500 EWI is allocated a fixed weight - or 0.2% of the index total at each quarterly rebalance.
IMPORTANT INFORMATION
The material herein has been provided to you for informational purposes only by Institutional Capital Network, Inc. (“iCapital Network”) or one of its affiliates (iCapital Network together with its affiliates, “iCapital”). This material is the property of iCapital and may not be shared without the written permission of iCapital. No part of this material may be reproduced in any form, or referred to in any other publication, without express written permission of iCapital.
This material is provided for informational purposes only and is not intended as, and may not be relied on in any manner as, legal, tax or investment advice, a recommendation, or as an offer or solicitation to buy or sell any security, financial product or instrument, or otherwise to participate in any particular trading strategy. This material does not intend to address the financial objectives, situation, or specific needs of any individual investor. You should consult your personal accounting, tax and legal advisors to understand the implications of any investment specific to your personal financial situation.
ALTERNATIVE INVESTMENTS ARE CONSIDERED COMPLEX PRODUCTS AND MAY NOT BE SUITABLE FOR ALL INVESTORS. Prospective investors should be aware that an investment in an alternative investment is speculative and involves a high degree of risk. Alternative Investments often engage in leveraging and other speculative investment practices that may increase the risk of investment loss; can be highly illiquid; may not be required to provide periodic pricing or valuation information to investors; may involve complex tax structures and delays in distributing important tax information; are not subject to the same regulatory requirements as mutual funds; and often charge high fees. There is no guarantee that an alternative investment will implement its investment strategy and/or achieve its objectives, generate profits, or avoid loss. An investment should only be considered by sophisticated investors who can afford to lose all or a substantial amount of their investment.
iCapital Markets LLC operates a platform that makes available financial products to financial professionals. In operating this platform, iCapital Markets LLC generally earns revenue based on the volume of transactions that take place in these products and would benefit by an increase in sales for these products.
The information contained herein is an opinion only, as of the date indicated, and should not be relied upon as the only important information available. Any prediction, projection or forecast on the economy, stock market, bond market or the economic trends of the markets is not necessarily indicative of the future or likely performance. The information contained herein is subject to change, incomplete, and may include information and/or data obtained from third party sources that iCapital believes, but does not guarantee, to be accurate. iCapital considers this third-party data reliable, but does not represent that it is accurate, complete and/or up to date, and it should not be relied on as such. iCapital makes no representation as to the accuracy or completeness of this material and accepts no liability for losses arising from the use of the material presented. No representation or warranty is made by iCapital as to the reasonableness or completeness of such forward-looking statements or to any other financial information contained herein.
Securities products and services are offered by iCapital Markets, an SEC-registered broker-dealer, member FINRA and SIPC, and an affiliate of iCapital, Inc. and Institutional Capital Network, Inc. These registrations and memberships in no way imply that the SEC, FINRA, or SIPC have endorsed any of the entities, products, or services discussed herein. Annuities and insurance services are provided by iCapital Annuities and Insurance Services LLC, an affiliate of iCapital, Inc. “iCapital” and “iCapital Network” are registered trademarks of Institutional Capital Network, Inc. Additional information is available upon request.
© 2024 Institutional Capital Network, Inc. All Rights Reserved. | 2024.01.


