EXECUTIVE SUMMARY
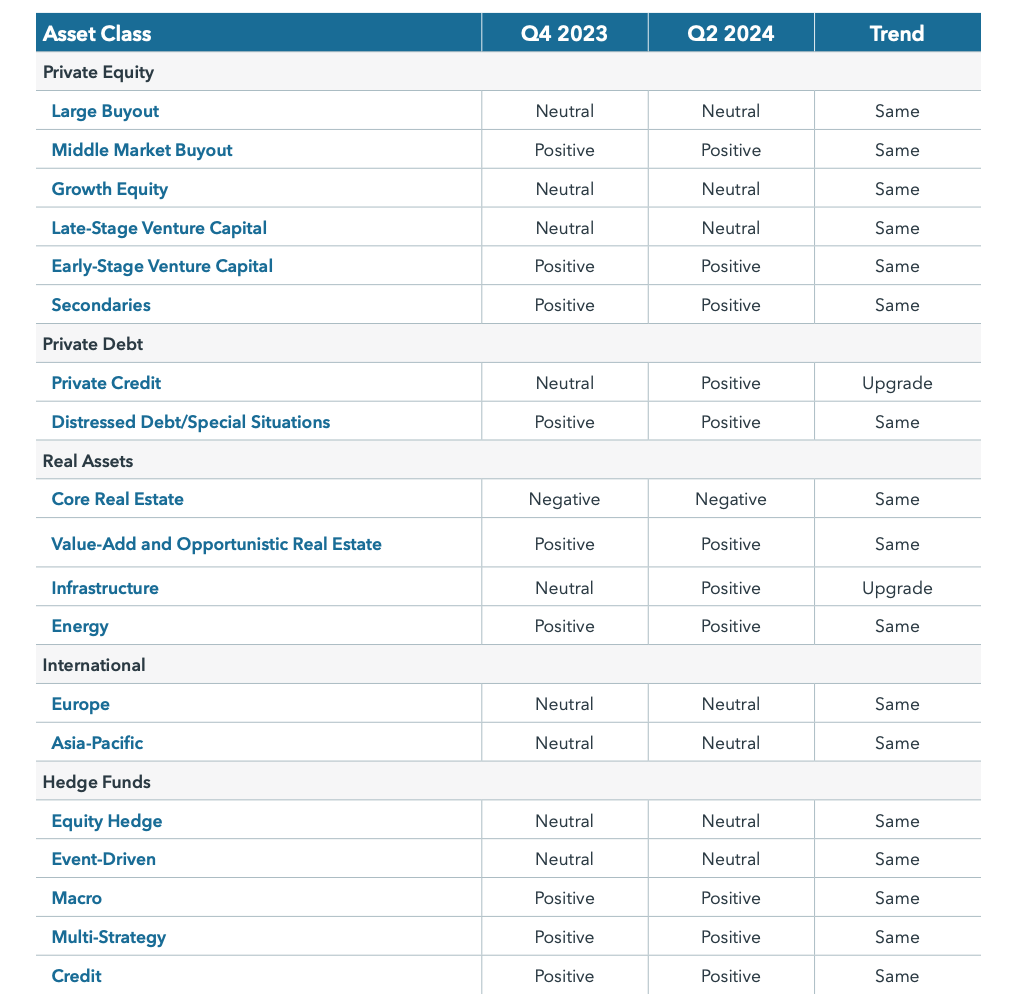
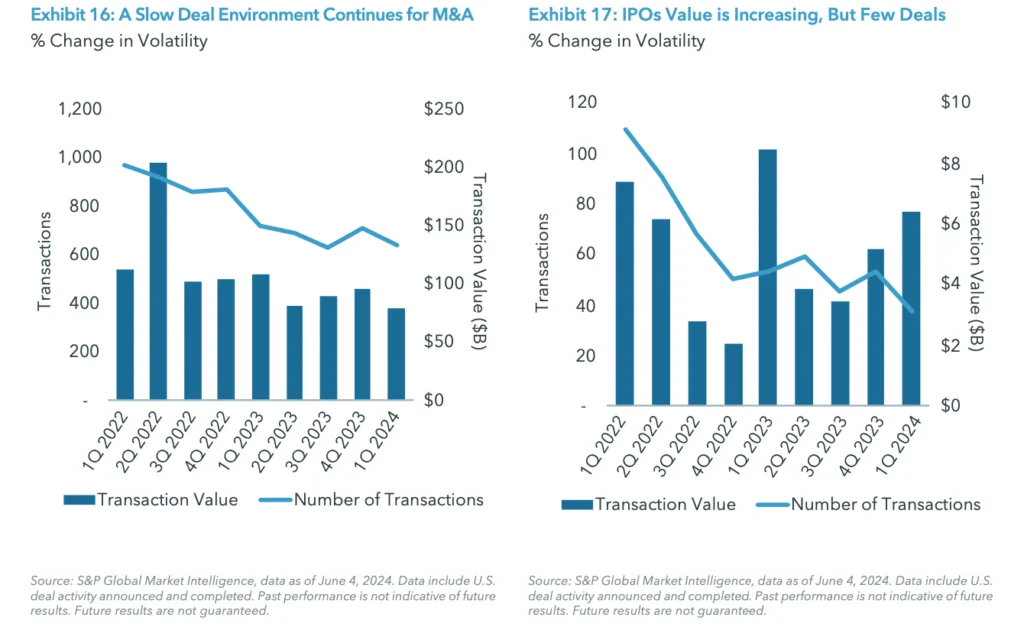
Midway through 2024, we’re largely in a wait and see mode. Interest rate reductions haven’t materialized as the U.S. Federal Reserve awaits firmer data on cooling inflation, which has restrained M&A and IPO activity. Yet, there could be catalysts ahead. Overall deal activity is stabilizing, and the pressure is mounting for long-owned private markets assets to be monetized.
Our mid-year strategy rating report, upgrades both private credit and infrastructure to Positive. We remain cautious on office real estate but believe other real estate areas are starting to regain their footing. And we could become more constructive on growth equity and event-driven strategies, both strategies could be better positioned in the back half of the year.
PRIVATE EQUITY
LARGE BUYOUT
Current Outlook – Neutral
Trend versus Q4 2023 – Same
We’re maintaining our Neutral rating as cyclical headwinds in the private equity space continue to take a toll on large buyout funds.
The U.S. Federal Reserve’s (“Fed”) rapid rate rising campaign (525 basis points increase between March 2022 and July 2023) and the resulting higher cost of debt continue to negatively affect new deal activity. This higher cost of debt to finance transactions has made deals of any size more expensive, particularly larger deals that tend to rely on more leverage. The debt-to-loan ratio for larger LBOs was 46% in 2023, compared to a 10-year average of 55%; the decline makes it harder to conduct larger LBOs.1 In fact, the number of $1 billion-plus transactions in 2023 was 9.8% below 2022 levels. However, despite this drop from 2022, it is only 3.5% below its 10-year average, as deal activity is starting to revert to more normalized levels.2 We also see a trend of funds using their dry powder to add to existing positions, rather than initiate new deals – another factor related to elevated interest rates.3
The exit environment also continues to face challenges. In 2023, large buyout exits were 21% below 2022 levels and 46% lower than the ten-year average; marking the most difficult year in a decade.4 In dollar terms, the value of exits in 2023 were 17% below 2022 levels and 27% lower than the ten-year average.5
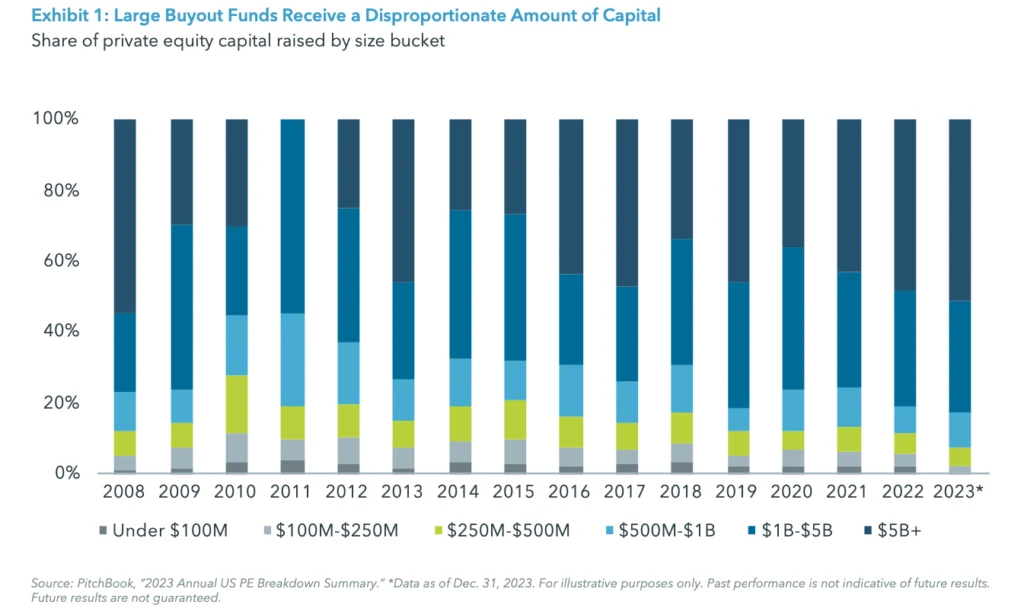
Despite the difficult backdrop, large buyout funds continue to receive a disproportionate amount of interest from LPs. For instance, even though funds targeting a $5 billion raise made up just 4.4% of total private equity funds in-market in 2023, they raised over half the capital in the space. This level of concentration towards larger funds hasn’t been seen since 2008.6 This capital is starting to trickle into new deals – both deal volumes and exits have inched higher in Q1 2024. However, deal activity hasn’t shown a sustainable recovery, which we believe is reliant on better visibility to the Fed’s timing on interest rate cuts and overall rate policy.
Risks: Uncertainty around the PE exit environment; unwillingness to finance larger deals due to a higher cost of debt.
MIDDLE MARKET BUYOUT
Current Outlook – Positive
Trend versus Q4 2023 – Same
Middle market buyout funds outperformed all other buyout strategies in 2023, with over 11% in net return.7 The multiple levers that middle market buyout strategies can capitalize on provides a support level and is a basis for our Positive rating.
This can be seen as over 90% of middle market buyout exits are sponsor-to-sponsor or strategic, which arguably provides a more sustainable runway to generate returns as they are less reliant on IPOs or debt financing.8 Many middle market portfolio companies are active with sponsor-to-sponsor tuck-in acquisitions to add product lines, expand geographically or acquire customers in an effort to grow and expand operations.9
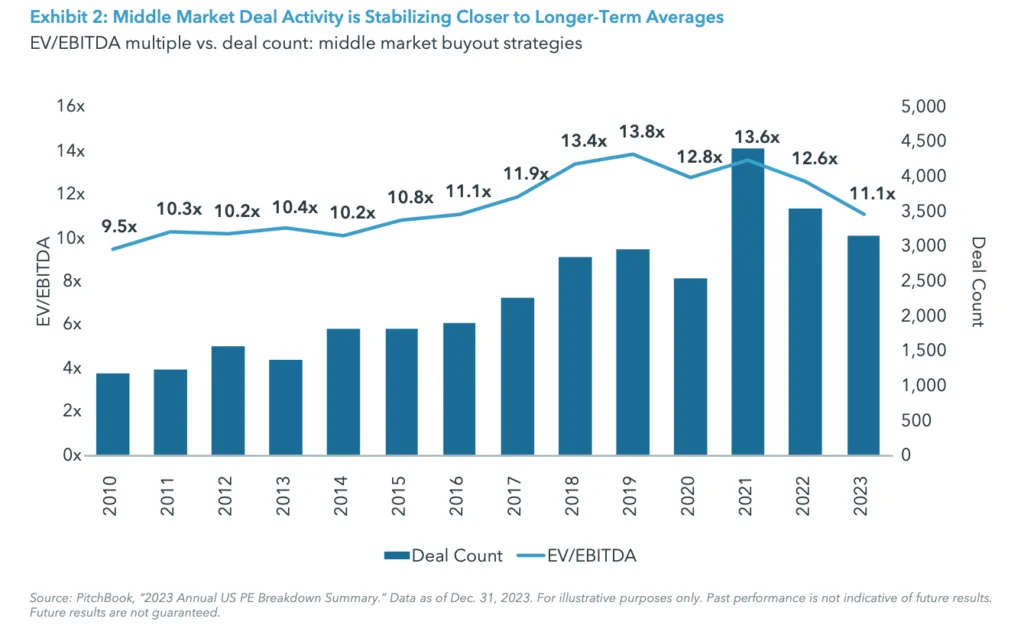
Notably, middle market deal activity is above pre- pandemic levels despite moderating from 2021 peak levels — 2023 deal count was 25% above the five-year pre-pandemic average (2016 – 2020).10 Further, nearly half of buyout funds’ portfolio companies are four years or older, a point at which fund managers start to look for an exit. Valuations are also narrowing to a more reasonable level, which could create a more sustainable pace for M&A activity.
Lastly, the overall fundamentals of middle market companies have been resilient. Based on the Golub Capital Altman Index , sponsor-backed, middle market companies reported 5% and 11% year-over-year revenue and earnings growth, respectively, for the first two months of 2024, which fares well compared to the S&P 500’s 4% increase in revenue and a 6% increase in earnings for Q1 2024.11
Risks: Valuation concerns driven by elevated interest rates and slowing economic growth; uncertainty around exit environment.
GROWTH EQUITY
Current Outlook – Neutral
Trend versus Q4 2023 – Same
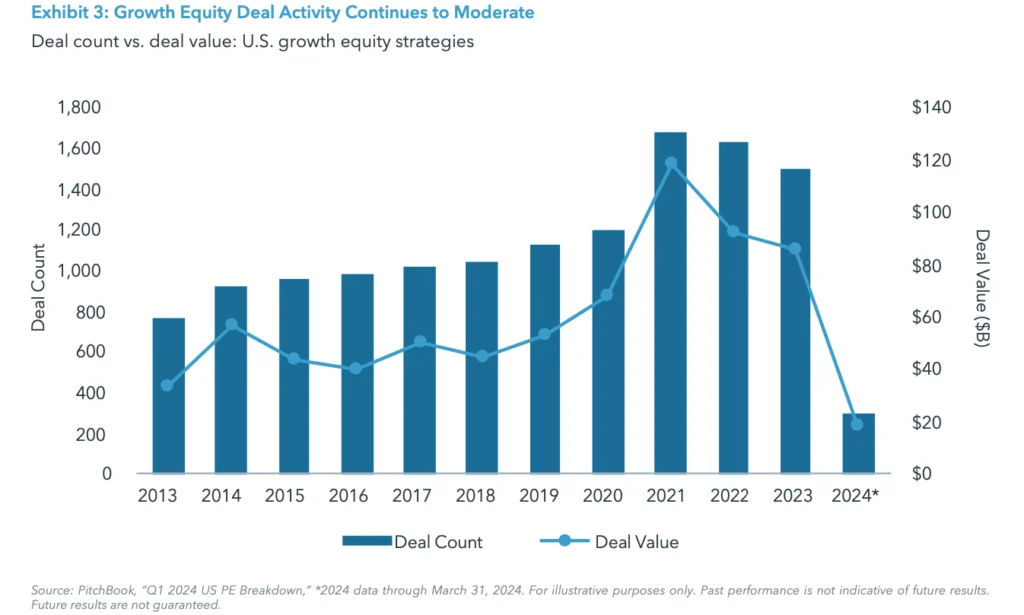
We maintain our Neutral rating on growth equity strategies as companies are shying away from a grow-at-all-cost approach, leaving many managers in a wait-and-see mode. Across growth equity, most measures, including fundraising, deal activity, and exits, continue to moderate from all-time highs seen in 2021. Aggregate value of growth equity capital fell by 33% from 2022 to 2023, while deal count and deal value were down by 31% and 48%, respectively, over the same time period.12 Despite a decrease in fundraising, dry powder has been building over the last decade and reached an all-time high in December 2023. This is in part due to the decline in deal activity as well as a strained exit environment.
The overall exit environment remains challenging as there are few options for cash-strapped companies to source liquidity and for managers to return capital to investors. Managers are maintaining their positions in investments as they wait to opportunistically exit and are focusing on company profitability and financial strength. Across private equity, exit count and value have decreased overall from peak in 2021 through year end 2023.
Despite these challenges, growth equity offers several investor-friendly features. These favorable characteristics include low leverage as well as downside protection through senior security positions, negotiating rights through control over IPO/sales, pro-rata follow-on rights, and occupancy of board seats.
Overall, our Neutral rating continues to reflect the downward trend of deal count and deal value and low levels of private equity-backed exits. However, as these trends begin to normalize, managers with long track records and large networks should be well positioned to create value.
Risks: Growth rate concerns driven by elevated interest rates and slowing economic growth; uncertainty around deal activity and exit environment; competition from built- up dry powder on the sidelines.
LATE-STAGE VENTURE CAPITAL
Current Outlook – Neutral
Trend versus Q4 2023 – Same
In recent quarters, late-stage venture deal activity has continued to show signs of stabilizing, as quarterly deal count aligns more with longer-term annual averages of roughly 850 annual transactions from 2014-2020.13 Total quarterly deal value has risen on a sequential basis for four consecutive quarters through Q1 2024, with Q1 2024 deal value of $19.1 billion, up 19% compared to the quarterly average deal value from 2014-2020.14
Late-stage median pre-money valuations increased 40% in Q1 2024 compared to average valuations in 2023, a stark reversal from the declines seen in 2022 and 2023.15 With only one quarter of data in 2024, it is difficult to determine if this rise is an outlier driven by higher quality companies and the boom in artificial intelligence (AI) funding or the start of a sustainable rise in valuations. Non-traditional investors participation in venture deals remains subdued, down over 60% from the peak. We view this as encouraging, as the recent rise in valuations does not appear to be driven by the speculation and investor frenzy seen in 2021 from non- traditional investors.16
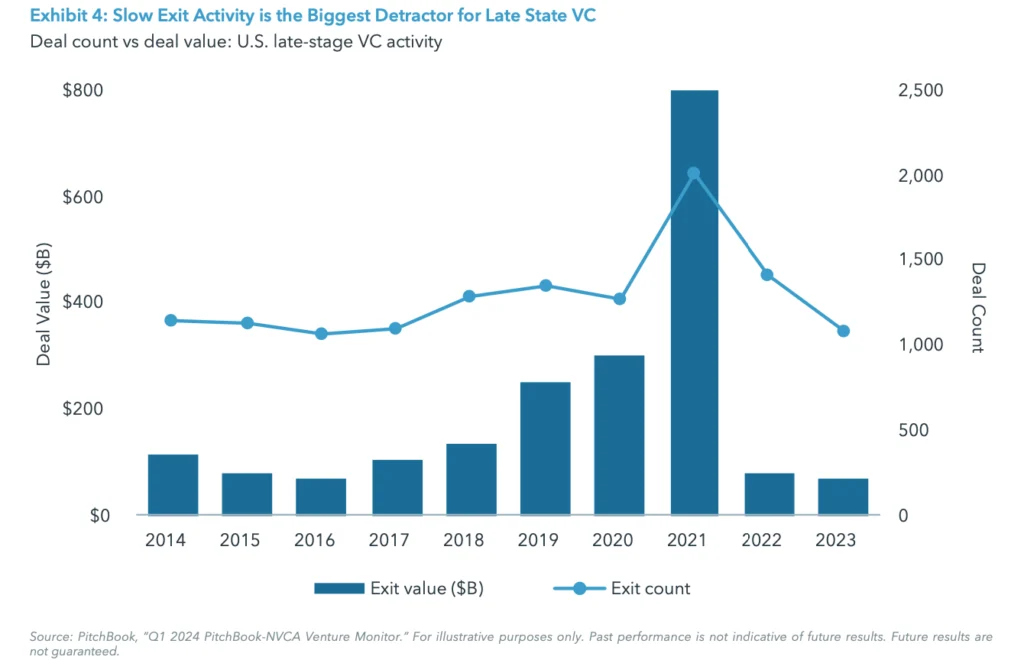
However, given the fact that late-stage venture companies tend to be larger and more mature, performance is more tightly tied to the exit environment, which has been significantly challenged in recent years. In 2021, the U.S. venture capital market saw a staggering 2,000 exits representing almost $800 billion in value, which was approximately three and a half times greater than the average annual exit value between 2014-2020.17 Even when looking past the 2021 outlier year, the annualized exit value for the first quarter of 2024 is on pace to be 50% below the 2014-2020 average.18
Risks: Valuation concerns driven by the recent spike in valuations, elevated interest rates, and slowing economic growth; uncertainty around the exit environment, longer hold periods.
EARLY-STAGE VENTURE CAPITAL
Current Outlook – Positive
Trend versus Q4 2023 – Same
Early-stage venture deal activity has also shown signs of stability in recent quarters with quarterly deal count more aligned with the longer-term average of roughly 1,075 transactions from 2014-2020.19 Quarterly deal value has risen sequentially for three consecutive quarters, with 1Q 2024 total deal value of $10.2 billion up 21% compared to the quarterly average deal value from 2014-2020.20
On the pricing front, we see a similar story to late-stage venture with median pre-money, early-stage venture valuations increasing in 1Q 2024, and above 2021 levels.21 While this is only one quarter of data, and it is not clear if this is a sustainable new trend, it does illustrate a clear bounce in valuations following a steep 20%-plus decline in 2023. It is important to note that the increase in valuations is likely driven by a surge in venture activity around AI and the significant amount of capital being deployed into these opportunities at high valuations.
We believe this is still an attractive entry point for early- stage venture managers, because new commitments to venture capital funds today will be allocated over the next three years and beyond.22 Notably, early-stage investments (typically before Series B) are often at the stage of creating a product/technology and identifying product-market fit, which, combined with scaling, are the primary drivers of value creation. Given this dynamic and higher underwritten returns, early-stage investments carry less valuation risk than other stages of venture capital. With the prior valuation reset, stabilizing activity, and long-term nature of the investment opportunity, we view the current market environment as an attractive entry point for new commitments to early- stage venture. We believe there continue to be long-term secular trends around cloud, cybersecurity, big data, AI, web3, fintech, and other themes that will provide ample opportunity for significant value creation.
Risks: Valuation concerns driven by recent the spike in valuations, elevated interest rates, and slowing economic growth; uncertainty around the exit environment; longer hold periods.
SECONDARIES
Current Outlook – Positive
Trend versus Q4 2023 – Same
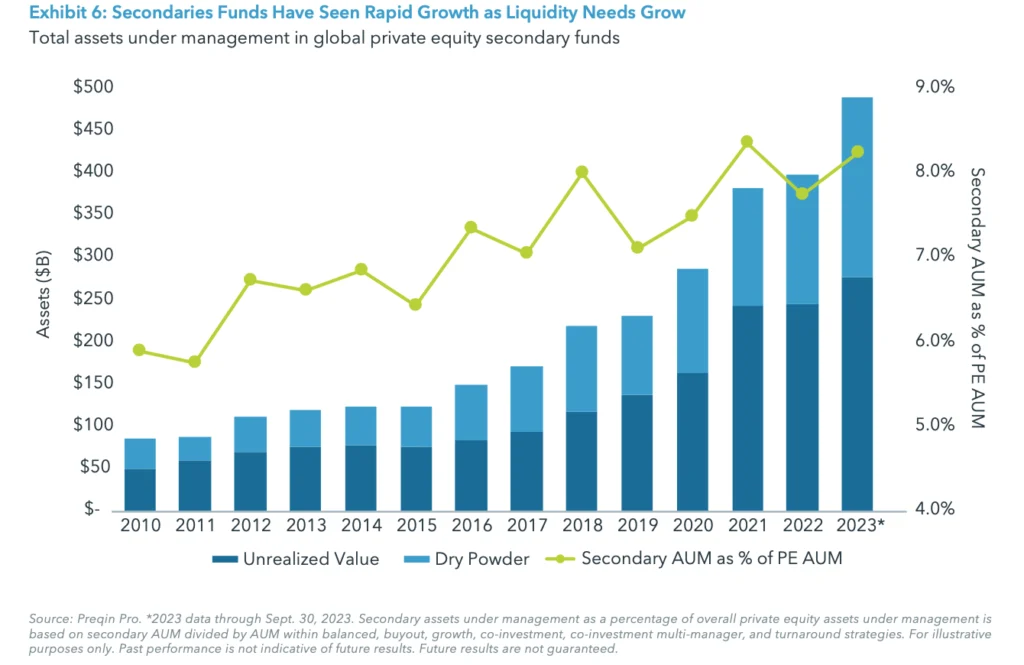
The secondaries market is becoming an important component of the overall private markets because it provides an effective mechanism to generate liquidity in a period when distributions are slow, which is a basis for our Positive rating. Secondary transaction volumes exceeded $100 billion for the third consecutive year in 2023, illustrating continued momentum in the secondaries market.23 This high level of volume was largely due to sellers seeking to raise cash given the dearth in exits created by funds selling off assets.
The primary driver for increased secondary transaction volume was from growth in the LP-led cohort, which increased 7% year-over-year ($56 billion in 2022 and $60 billion 2023), while GP-led volume remained the same ($52 billion).24 LP-led volume was driven by the need for liquidity, often due to the denominator effect resulting in a portfolio rebalancing exercise. Discounts on LP-led portfolios have narrowed as the markets have stabilized and rebounded, allowing for the average pricing to improve from 81% of NAV in 2022 to 85% of NAV in 2023.25 Additionally, higher valuations in the latter half of 2023 brought more sellers to the market. Secondaries continue to be an avenue for sponsors to generate liquidity, particularly since the M&A and IPO markets have not rebounded. As such, GP-led secondaries have become an enticing alternative exit path for GPs.
Secondary fundraising in 2023 exceeded the combined total for 2021 and 2022. In Q1 2024, secondary fundraising reached $35 billion, which is the highest amount in any first quarter since 2008 and represents a 6% year-over- year increase from the same time period in 2023.26 The secondaries asset class continues to be an attractive and growing opportunity within the private equity ecosystem as LPs and GPs continue to leverage this market.
Risks: Competition from built-up dry powder on the sidelines or broader exit activities (e.g., IPOs, M&A) narrowing discounts on secondaries sales.
PRIVATE DEBT
PRIVATE CREDIT
Current Outlook – Positive
Trend versus Q4 2023 – Upgrade
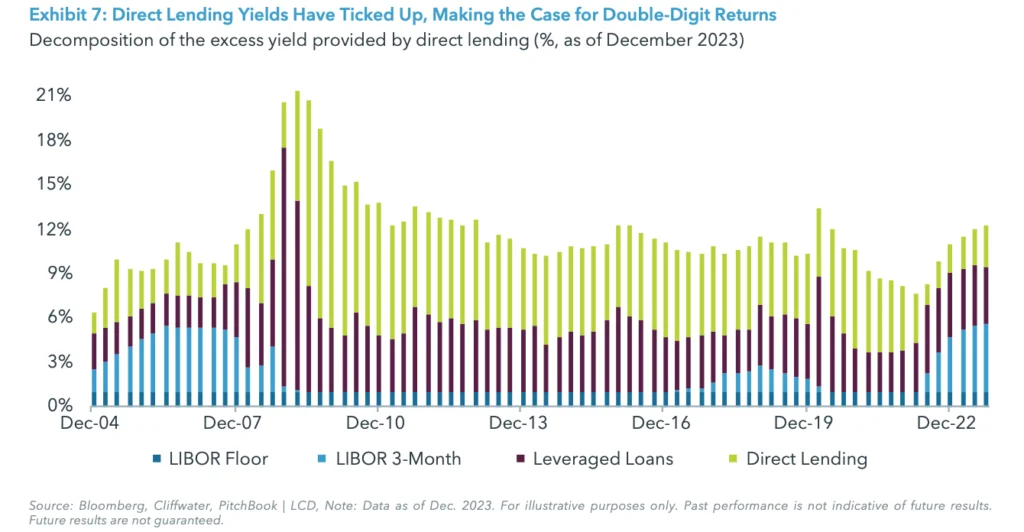
Following the Fed’s rapid rate rising campaign (525 basis points increase between March 2022 and July 2023), yields for direct lending strategies have increased accordingly, providing attractive income for investors. Expectations for a material economic slowdown or degradation of credit quality have not materialized as we expected, creating a more stable environment for direct lending than we previously expected. As such, we’re revising our outlook to Positive from Neutral.
While opportunities for direct lending strategies for sponsor-backed transactions are down from the robust 2021-2022 period, deal volumes of U.S. PE buyout/LBO remain at or above pre-pandemic levels.27 And even in the post-pandemic trough in deal activity, private credit performance has been resilient. The Cliffwater Direct Lending private credit benchmark reported a one-year 12.7% total through Q1 2024.28
Direct lenders are benefiting from greater absolute levels of yields and improved risk adjusted returns. Given the Secured Overnight Financing base rate of 5.3%, potential spreads ranging from 500 basis points to 700 basis points above the base rate, and original issue discounts of around 2% amortized over three years, we believe lenders can achieve gross yields greater than 12%. At the same time, lenders are able to generate these yields with lower overall leverage (debt/EBITDA) and lower loan-to-value (greater equity cushion). According to PitchBook, average debt/ EBITDA multiples in Q1 2024 were up slightly to 5.1x from the average 4.9x level in 2023, yet they are still meaningfully down from the 5.9x level in 2022. Further, equity sponsors are investing a greater amount of equity into new transactions, with the amount of debt financing for private equity deals dropping to 45.1% from 45.7% in 2023 and 50.8 in 2022%.29
Although underlying borrowers need to spend more of their earnings to service debt, the strength of the underlying economy, so far, has led to the improved health of borrowers in the market. Proskauer’s, quarterly Private Credit Default Index for senior-secured and unitranche loans had a default rate of 1.84% for Q1 2024, down from 2.15% in Q1 2023. Default rates can move quarter-to- quarter but have hovered in the 2% range and have not been a red flag for overall credit quality.30
Risks: Highter cost of debt, especially those that originated in the near-zero percent era, could lead to degradation in coverage ratios, slower deployment period, competitive segment.
DISTRESSED DEBT/SPECIAL SITUATIONS
Current Outlook – Positive
Trend versus Q4 2023 – Same
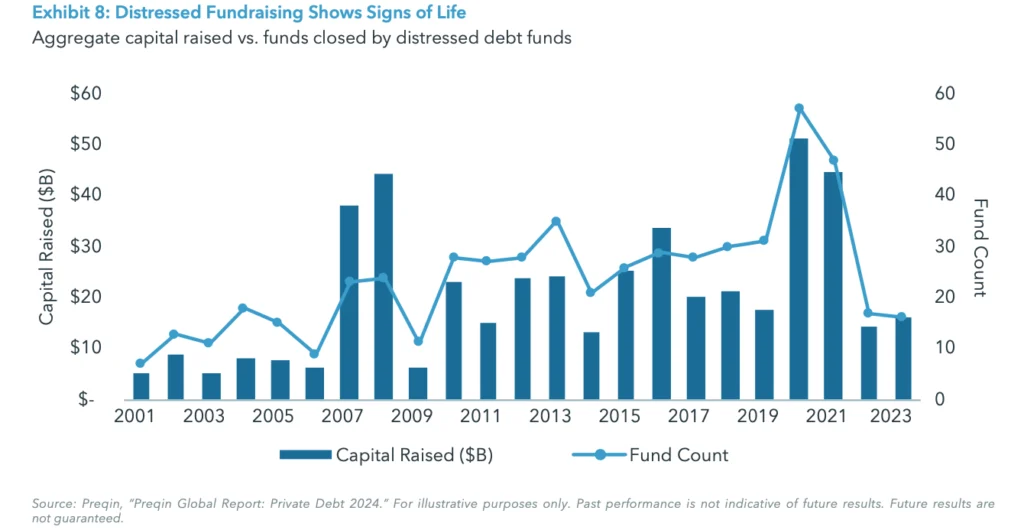
The absolute size of the market for distressed managers has diminished from 2023 levels. However, given the growth of the credit markets and a bifurcated market for winners and losers that is creating a need for capital solutions, distressed managers continue to have a robust opportunity set, particularly in light of limited capital raised by distressed fund managers.
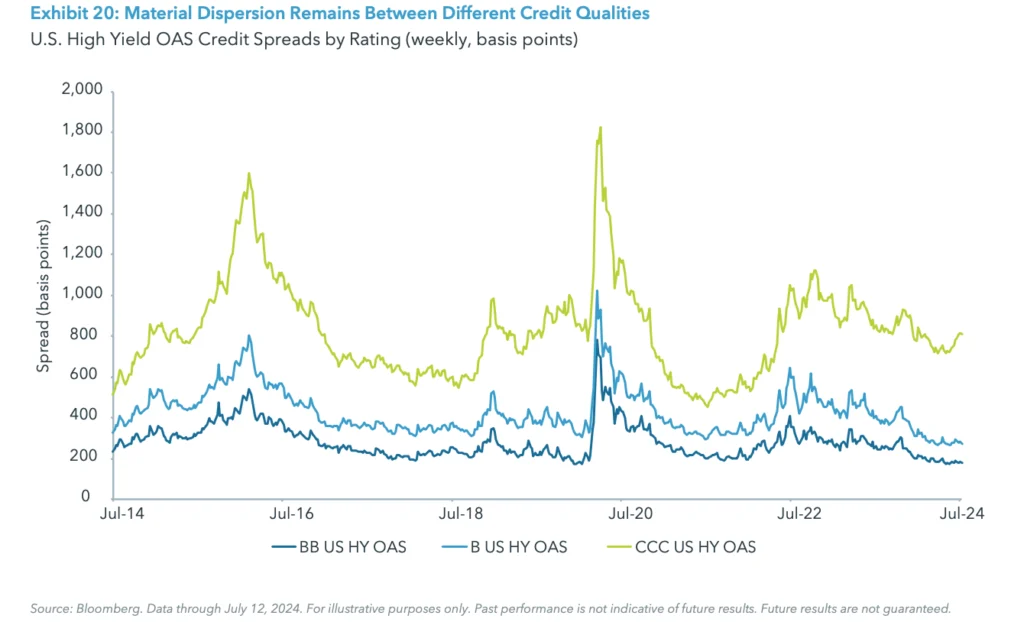
In looking at the opportunity size, there was approximately $1.4 trillion worth of debt coming to maturity between 2024 and 2026 (as of October 2023).31 But with the unexpected strength of underlying fundamentals and an opening up of the financing markets, many companies extended their financing to 2028 and beyond. Now, with approximately $400 billion of debt expected to mature between 2024 and 2027, the absolute number of companies that could face stress due to an upcoming maturity has declined.32 However, opportunities remain. According to Bloomberg data, approximately 45% of CCC-rated bonds are trading at stressed levels, which is down from 63% at the end of 2022, but still elevated compared to 2021. In absolute dollar terms, approximately $200 billion of U.S. corporate debt is trading in distressed territory, according to Bloomberg.
There continues to be room to find opportunities in defaulted companies and dislocations in corporate and real estate debt. And disciplined managers have been able to take advantage of this while avoiding some of the costs, extended hold periods, and uncertainties associated with Chapter 11 bankruptcy. Although the absolute market opportunity has declined, the relatively limited amount of capital raised in the distressed space continues to favor investors. Over the course of 2022 and 2023, only $30.7 billion was raised by distressed managers, compared to $95.9 billion over the course of 2020 and 2021 while investors were attempting to take advantage of COVID-era dislocations.33
Despite the opportunities in corporate credit and real estate, there are some headwinds to take note of. Given the recent flurry of refinancing activity, there is a smaller opportunity set over the next two years. In addition, a likely path for rate cuts could ease some pressures and help keep defaults low. Should these headwinds materialize further, we could revisit our rating.
Risks: Uncertain timing and the size of the forward opportunity set if material interest rate reductions occur.
REAL ASSETS
CORE REAL ESTATE
Current Outlook – Negative
Trend versus Q4 2023 – Same
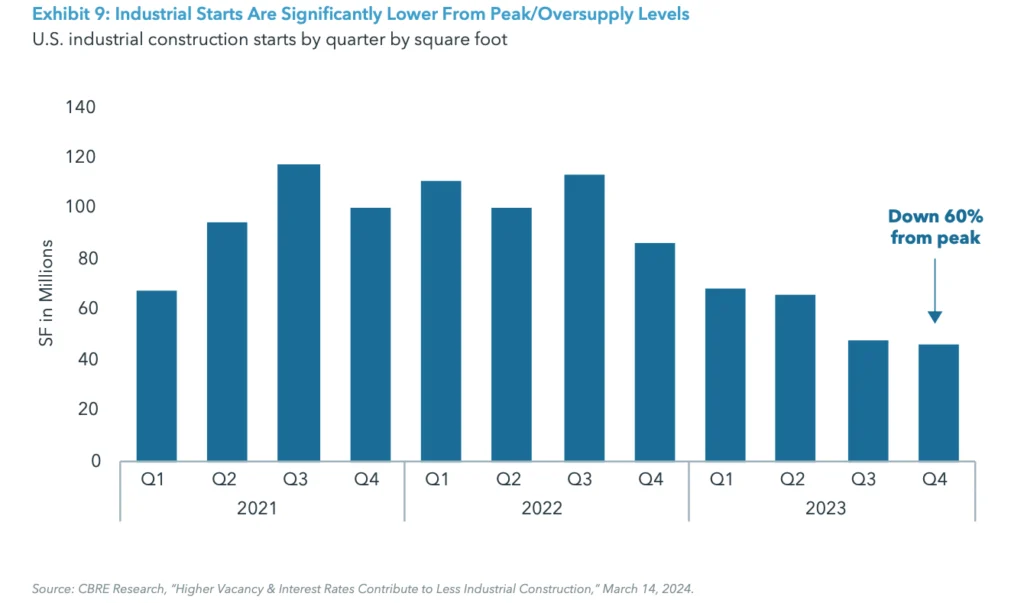
Core commercial real estate (CRE) continues to face cyclical weakness due to concerns of decreasing net operating income (NOI), high vacancies and near-term oversupply in certain sectors. In key areas such as multifamily and industrial, much of the oversupply is a function of elevated construction starts from 2021-2022. According to CBRE, construction starts during that period are resulting in record deliveries, with over 440,000 new multifamily units expected for delivery in 2024 and an added 900,000 units currently under construction.34 With a peak in supply still ahead, rent growth and valuations will likely remain under pressure.
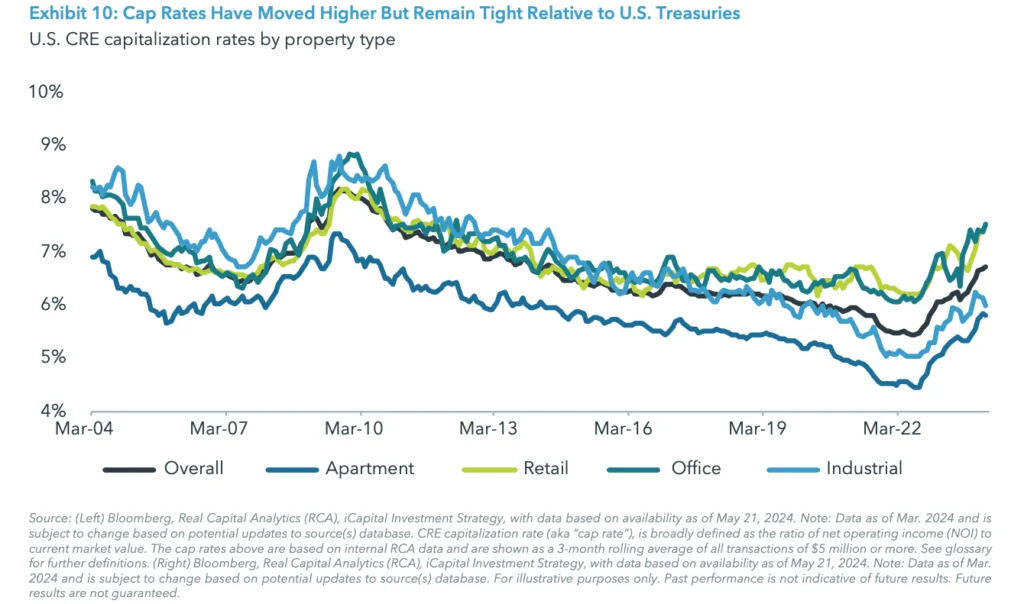
Rising capitalization rates (cap rates) are also complicating the CRE landscape. According to NCREIF, cap rates are at 4.7%, which is approximately 30 basis points higher than the current 10-year treasury yield.35 While the current spread to treasuries is an improvement, the spread is still tight compared to its long-term average of 200-300 basis points.
The combination of supply pressures and elevated cap rates headline the current challenges and are resulting in increased investor redemptions. Over the past two years, core real estate has experienced redemptions in excess of $45 billion. Should redemption pressures persist, funds may be forced to sell portfolio holdings at heightened discounts, broadly pushing real estate valuations down further.
Despite the current negative backdrop for core real estate, the longer-term fundamentals and secular trends for many properties (outside of office) remain constructive. Within multifamily, absorption of supply due to a chronic shortage of housing should alleviate the short-term oversupply gluts. In industrial, e-commerce growth and the shift to reshoring will continue to provide structural tailwinds. And more broadly speaking, sentiment regarding fiscal policy has shifted from its previous hawkish tone to one that is more balanced. As rate increase pressures subside over the medium-term, it can indicate a bottom for real estate valuations.
Risks: Distress cycle in office bleeds into other property types; economic slowdown affecting NOI growth further; investor flight in core funds.
VALUE-ADD AND OPPORTUNISTIC REAL ESTATE
Current Outlook – Positive
Trend versus Q4 2023 – Same
The cyclical weakness across CRE has led to valuation declines for most stabilized property types. The NCREIF ODCE Index, for example, has seen a 19.5% peak-to- trough valuation decline.36 Despite this revaluation, there is still the potential for further weakness. Cap rates on real estate, while having moved higher over the past year, remain tight relative to U.S. Treasuries and low compared to transaction cap rates.37
Despite the dour outlook for existing owners of real estate, we are positive on value-add and opportunistic real estate strategies that may take advantage of potential real estate dislocations. We believe value-generating capex investment, the longer horizons in putting dry powder to work, and flexibility in deploying capital in diverse property types and geographies can drive outperformance for the asset class. And as stated, entry cap rates for acquiring assets have reset in 2024 as property values continue to fall.
While we are positive on these real estate strategies, we acknowledge that the timing and severity of a potential dislocation are still playing out, particularly when assessing distressed or motivated sellers. Commercial mortgage-backed securities (CMBS) special servicing and delinquency volumes have increased considerably this year, reaching levels not seen since 2021. And for office loans, 39% of loans slated to mature in the first quarter of 2024 became delinquent.38 Banks aren’t coming to the rescue either. Total commercial real estate mortgage borrowing and lending is estimated to have totaled $429 billion in 2023, a 47% decrease from 2022.39 The scarcity of capital will eventually work its way through the market, with the expectation of more forced selling and defaults, however, the size of the total opportunity set remains elusive at this time.
Risks: Slowing economic growth impacting long-term valuations and affordability, prompting a deeper real estate correction, increase in supply of capital in response to expected rate cuts.
INFRASTRUCTURE
Current Outlook – Positive
Trend versus Q4 2023 – Upgrade
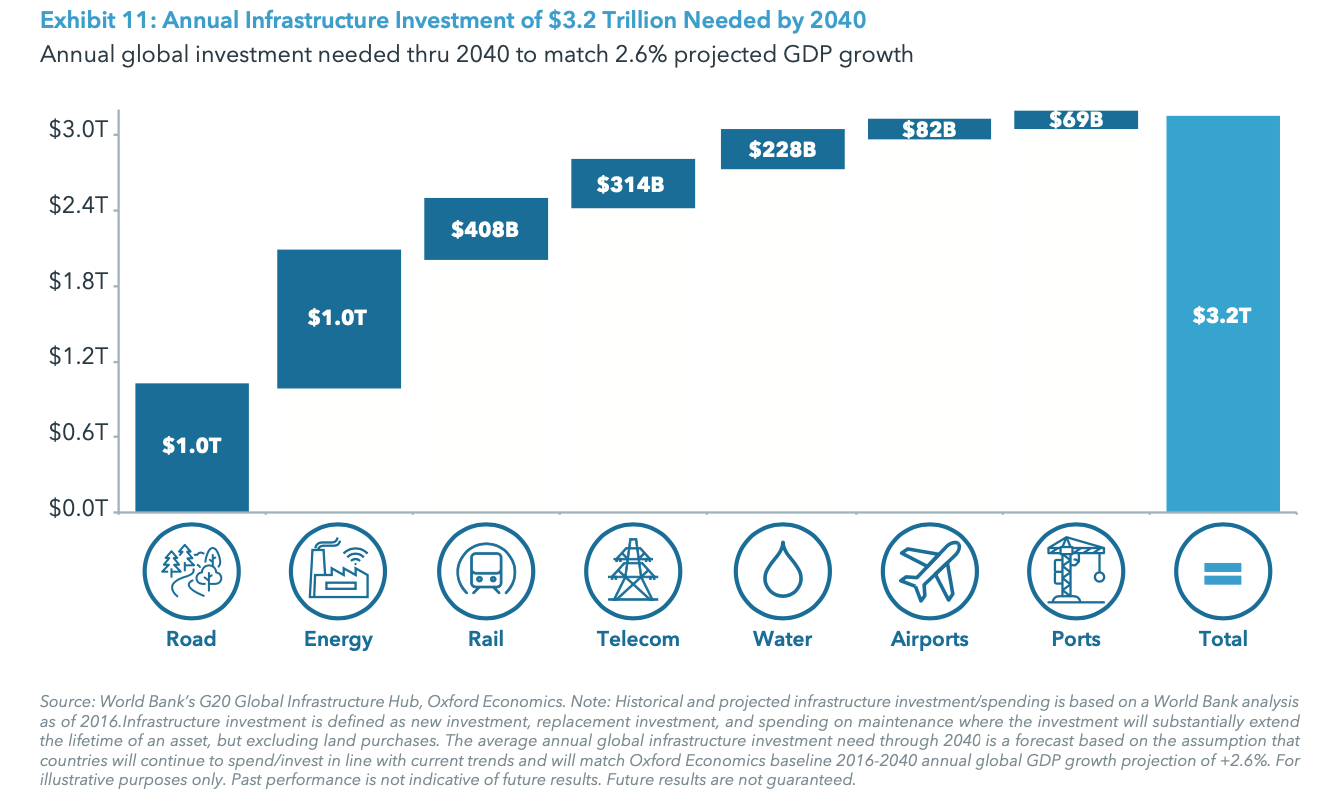
Infrastructure has the potential to provide investors with attractive yield and total return, driven by predictable, long-term cash flows. The asset class has gained attention in recent years with the recognition that there exists a significant “funding gap” requiring an annual investment of almost $3.2 trillion in infrastructure assets through 2040 to keep pace with demand.40 This demand is underpinned by secular trends such as increasing population and urbanization, an accelerating need for computing power (i.e. data centers), and efforts to increase sustainability and promote a transition towards green energy. Growing public deficits and the drive towards energy independence are providing opportunities for private capital to fund these critical infrastructure needs where governments cannot or will not, creating a supply/demand imbalance. These long-term secular drivers are the basis for our upgrade to a Positive rating.
Because infrastructure cash flows are often backed by inflation-linked contracts, the sector has generated strong recent performance: from June 2022 (when inflation peaked at 9.1%) through December 2023, the Preqin Infrastructure Index significantly outperformed Preqin’s Private Capital Index with a cumulative return of 17% (compared to 8% for Private Capital), or 11% on an annualized basis — exceeding the Infrastructure Index’s annualized return of 9.4% since its December 2007 inception. Despite this, infrastructure fundraising has seen a marked decline in 2023 from its all- time highs and has remained subdued for 2024 YTD.
Risks: Duration risk could weigh on valuations and performance in a higher-interest rate scenario; slower economic growth could impact GDP-sensitive sectors such as transportation.
ENERGY
Current Outlook – Positive
Trend versus Q4 2023 – Same
Despite volatility in oil and gas pricing during the first half of 2024, we remain positive on energy strategies. Throughout the first half of 2024, WTI crude oil prices rose to a high of $87/bbl before settling in at $80/bbl, while natural gas fell to a low of $1.56/MMBtu before settling in at or above $3/MMBtu. On average, both prices continue to track into profitable territory. Per the Dallas Federal Reserve surveys, breakeven pricing on new wells maxes out at $70/bbl while existing wells are much lower at $45/ bbl. Natural gas breakeven pricing in the Haynesville, the most resource rich basin for dry gas, were recently valued at $2.67/MMBtu. With both energy sources sitting in profitable territory, there is solid potential for continued production and positive cash flow generation.
Supply for oil remains constructive at current price levels through the end of 2024. Downward pressure could build until 2025 as OPEC announced it would extend its production cuts, but that pressure should be offset by the phasing out of a previously announced 2.2 million barrels per day cut that will begin in October 2024 and end in September 2025. Consensus expectations are that global prices may push modestly higher through the end of 2024 but stay range bound as production picks up. As for natural gas, supply constraints entered the market as major U.S. producers such as Chesapeake Energy and EQT announced production cuts in the first half of 2024 to ease stubbornly low prices. The Energy Information Administration’s recent reports suggest we’ll see a 1% drop in U.S. natural gas production in 2024, which should put upward pressure on natural gas prices.
The outlook for energy demand is particularly noteworthy in natural gas as we head into the second half of 2024. Speculation for record-high summer temperatures with the potential for weather disruption has inflated future demand (and pricing) expectations. This speculation follows pockets of increased demand for liquified natural gas from the international community as they look to the U.S. as an increasing source for natural gas supply.
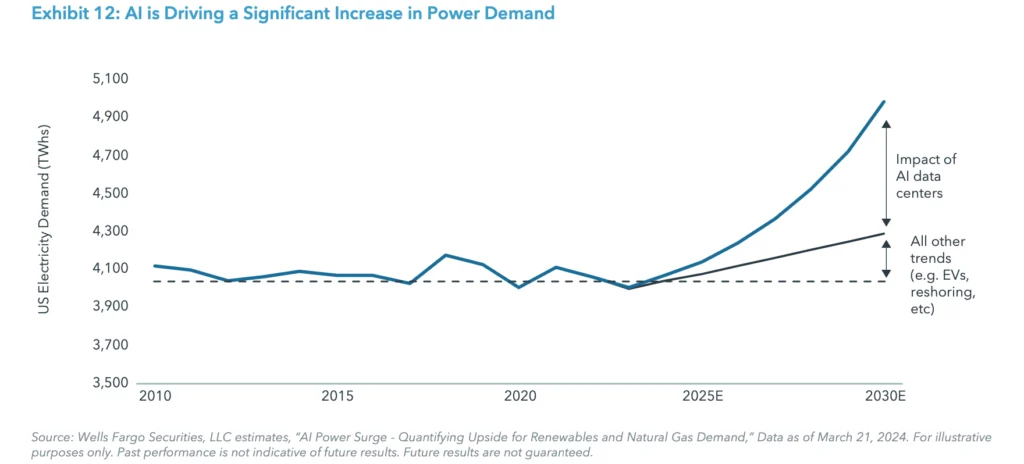
The most interesting shift in demand trends for natural gas is coming from the rise in AI and the resulting demand for data, data centers, and power. The expectation by notable energy producers such as Dominion and Williams indicate that the U.S. will see a doubling of data center power demand by 2030 to satisfy the energy needs as a result of AI. This increasing demand represents a structural shift that should prop up natural gas prices above its breakeven production and support a constructive view of investments in that space.
Risks: Slowing economic growth, bringing supply and demand back into balance; unpredictable supply side issues concerning OPEC; geopolitical risks increasing energy security concerns.
INTERNATIONAL
EUROPE
Current Outlook – Neutral
Trend versus Q4 2023 – Same
A reemergence in regional growth and cooling inflation is lifting Europe from a brief technical recession.41 Further, central banks in Switzerland, Sweden, and the European Union initiated rate cuts in Q1 2024 — after three years of policy rate hiking — which could help sustain growth. Yet, with deal activity still challenging, we maintain our neutral view on European-focused private market strategies.
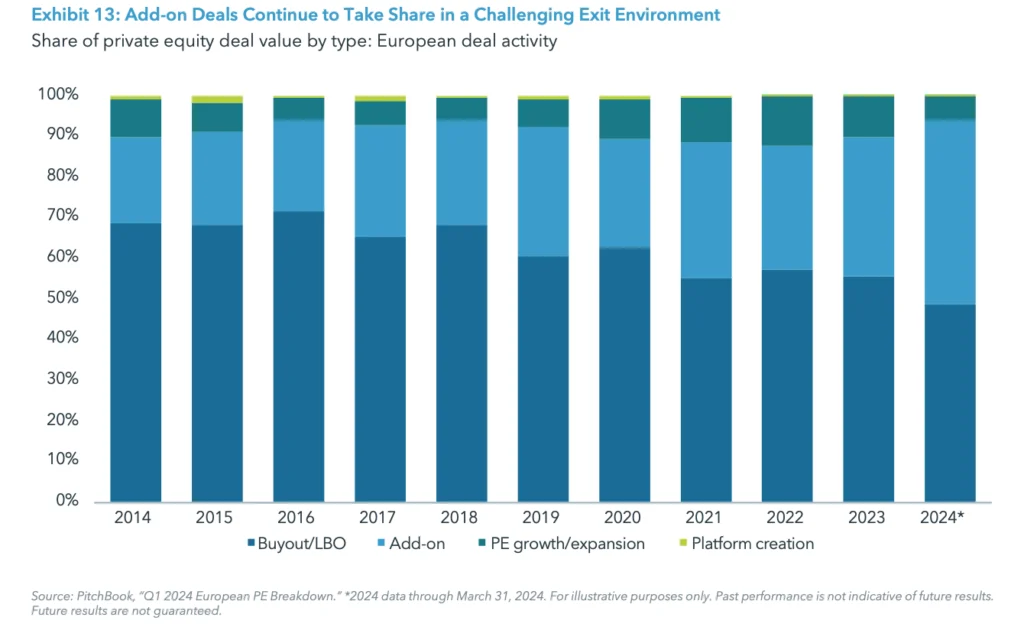
M&A activity across Europe in the first quarter of 2024 had a slower start of the year as compared to the previous three years; in terms of aggregate value, the trailing one-year deal value was up +15% to Q1 2023.42 In terms of deal size, focus remains on the smaller end of the spectrum with market players deploying 45% of Q1 2024 deal value in smaller add-on deals, compared with the 10-year average of 28%.43 With over 30 million SMEs in the EU alone44, Europe remains a fertile ground for pursuing buy-and-build rollouts. The number of mega-deals (defined as larger than $1 billion) is instead projected to be the lowest in over a decade: in the first quarter of 2024 there were only five deals larger than $1 billion, as compared to 43 in full year 2023 and 61 in 2022.45 From a sector perspective and consistently with the general trend of the last three years, PE activity in Europe remained substantially dominated by business-to-business and information technology, followed at a distance by consumer-facing and healthcare companies.46
Dry powder in Europe remains elevated and at record highs ($819 billion as of Q4 2023), with the potential to pressure on valuations, while exit activity is still awaiting a recovery with Q1 2024 being second worst quarter for European PE exit value since Q1 2013.47 While we’re optimistic about the pick-up in macro-growth, we remain neutral on our outlook for Europe given the stalled out exit environment and overall deal activity.
Risks: Higher borrowing costs; geopolitical volatility; and escalation of the conflict in Ukraine.
ASIA-PACIFIC
Current Outlook – Neutral
Trend versus Q4 2023 – Same
Asia-Pacific (APAC) continues to outpace economic growth relative to other global regions, with the IMF forecasting a GDP expansion of 4.5% for 2024 on the back of strong domestic demand and a supportive external environment.48 The two largest economies in the region, China and India, are expected to grow at 5.0% and 6.8%, respectively.49 Inflation has generally continued to decline, albeit at varying speeds, with some economies still seeing sustained price pressures and others acing deflationary risks.
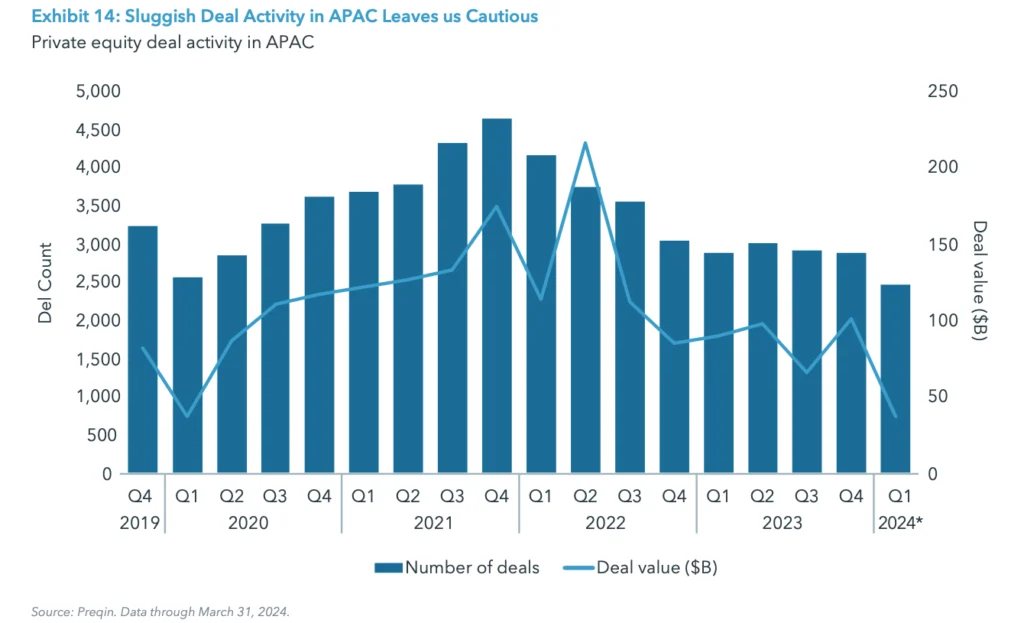
We remain neutral on APAC largely due to still slow deal activity. Due to geopolitical, regulatory and macro uncertainty in the region, deal value in Q1 2024 was roughly a third of Q4 2023 volumes, and a 40% reduction on a trailing one-year basis as compared to Q1 2023.50 Dry powder in the region remains at an all-time high at $765 billion.51Deal value fell across all major countries in APAC vs. the previous five-year average, with volumes in China dropping 58%52; foreign investors have been withdrawing from China on the back of continued uncertainties, adding another complication.
Japan was the notable exception, with private equity deal value increasing 183%, driven by large deals. According to Bain & Co, the resurgence in M&A activity in Japan is due to the large, untapped pool of target companies with performance improvement potential, a stable regulatory environment and persistently low interest rates.53 From a sector perspective, Technology remains the largest industry sector in terms of deal activity.
Risks: The region continues to provide investment opportunities, but cross-border complexities, ever- tightening regulation and escalating geopolitical tensions.
HEDGE FUNDS
EQUITY HEDGE
Current Outlook – Neutral
Trend versus Q4 2023 – Same
For equity hedge fund strategies, mixed signals on the economic outlook should result in an improved backdrop for stock picking – both on the long and short side – and allow fund managers to focus on company-specific fundamentals. Yet, alpha performance remains widely varied across managers and strategies, proving the difficulties for managers to deliver alpha beyond highly concentrated positions (i.e., Magnificent 7) and is a primary reason for our Neutral rating.
Overall, equity hedge funds have advanced, up 5.1% through Q1 2024, continuing on the 11.4% performance for 2023. The group has benefited from a net long bias amid a rising equity market backdrop, but, other than taking positions in a narrow part of the market, consistent alpha generation has been challenging.
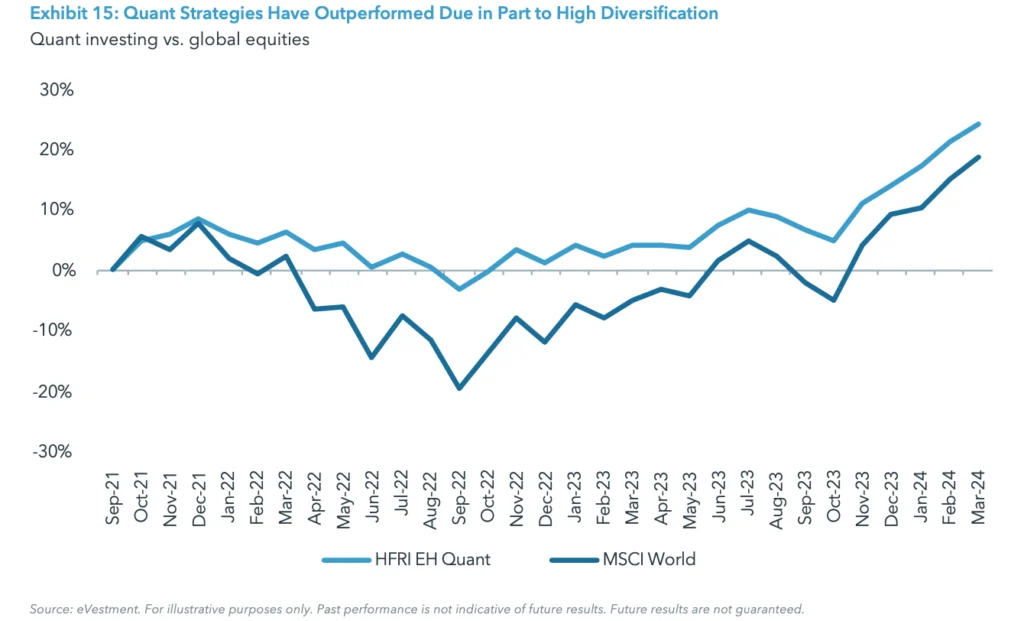
Should market breadth expand, we prefer broadly diversified quantitative strategies which tend to generate favorable long-short spreads while limiting factor and style biases. When looking at performance, the HFRI EH Quant Index has outperformed the MSCI World Index by over 800 basis points from October 2021 — when the Fed signaled its intention to raise rates — through February 2024, generating those returns with roughly half the risk.54 Because quant-based strategies utilize computational processes designed to handle extremely large data sets, portfolios for those quant funds are typically highly diversified, a key advantage when market risk and investor uncertainty are trending higher.
Managers with a quant focus, or those that can take advantage of wild swings in sector-focused market sentiment (such as technology), may prove to outperform during periods of mixed economic data and changes to economic policies.
Risks: Beta headwinds overshadow alpha generation; slowing economic growth in U.S. and abroad; macro factors dominating company fundamentals.
EVENT DRIVEN
Current Outlook – Neutral
Trend versus Q4 2023 – Same
We’re warming up to event driven strategies given the potential political and regulatory catalysts that could provide a more favorable environment for deal activity starting in 2025. However, until we see this catalyst, and with M&A and IPO deal volume still muted, we’re maintaining our Neutral rating.
Event driven funds advanced in 2023 (HFRI Event-Driven Index: +10.4%) and have started the 2024 year with a modest gain (HFRI: +2.3% through Q1 2024). Equity- focused strategies have generally outperformed, while credit-focused funds have posted modest gains.
Funds that invest across the capital structure remain well positioned to take advantage of ‘special situations’ in both equities and credit. Additionally, practitioners who can create their own catalysts (e.g. shareholder activism, capital solutions, restructurings) are likely to have an advantage should capital markets remain constrained.
Yet, the largest catalyst for event-driven funds likely rests with a sustainable uptick in M&A and capital markets activity, which has yet to break out. Borrowing costs and regulatory scrutiny for transaction approvals remain the larger concerns. Looking forward, the potential for any easing in the regulatory and antitrust scrutiny of deals could provide a more abundant backdrop for event driven opportunities.
Risks: A downturn in broader equity markets or a decrease in corporate confidence could create additional challenges for deal making activities.
MACRO
Current Outlook – Positive
Trend versus Q4 2023 – Same
Following a period of tepid results in 2023 (HFRI Macro Index declined by -0.3%), macro strategies have advanced 6.3% through Q1 2024 as managers have captured returns in areas such as global interest rates, equities and commodities.
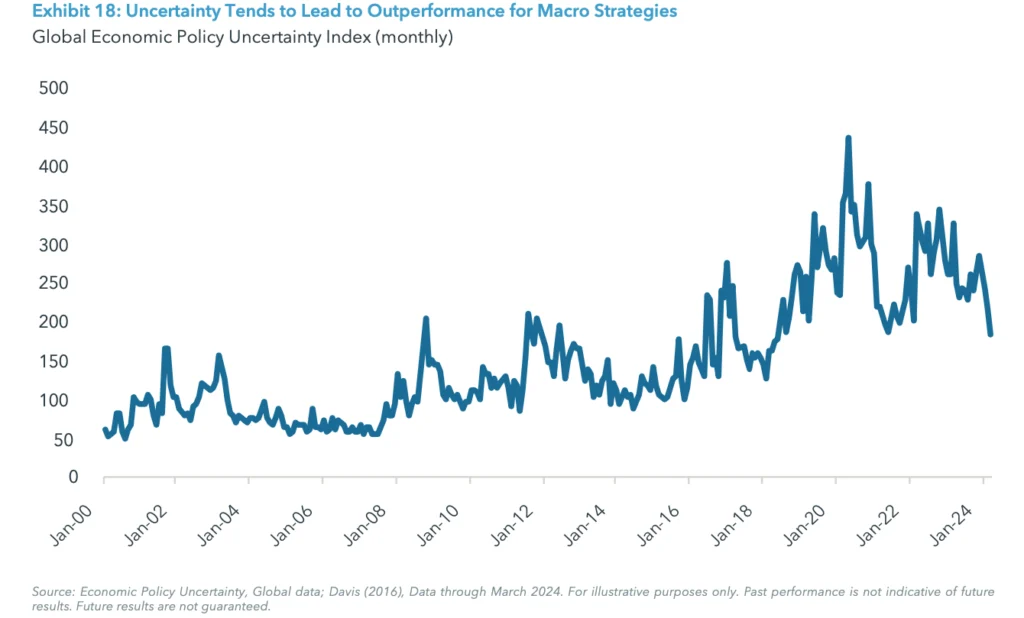
Particularly for macro strategies, uncertainty tends to lead to outperformance—or at least provides fertile ground for outperformance as asset volatility tends to rise in periods of uncertainty, creating pricing dislocations. It is this scenario that underpins our Positive rating.
A measure of uncertainty, while frustratingly difficult to identify, can often be observed from varied data points from different sources. The geopolitical risk index, a measure of adverse geopolitical events, has been on an upward trendline since mid-2022 and is 12% above its five- year average.55 Separately, the global market backdrop appears more likely to be influenced by staggered fiscal and monetary policy moves rather than the lockstep actions made by many central banks over the last several years. The complexity created by these different policy responses should provide attractive trading opportunities for macro strategists. With a less certain inflation and interest rate outlook, volatility is likely to hover on a higher plane in coming quarters.
As always, manager selection remains crucial. Notably for macro strategies, the broad ability to invest across multiple asset classes and countries has led to a wide dispersion of performance amongst individual macro managers. Managers who can trade across assets classes — as opposed to single-focus strategies in areas such as rates or commodities — remain better positioned to take advantage of opportunities across a range of markets.
Risks: Dampened volatility across assets; converging fiscal and monetary policies globally; return to “easy money” by global central banks.
MULTI-STRATEGY
Current Outlook – Positive
Trend versus Q4 2023 – Same
We continue to have a favorable outlook on multi- strategy funds based on our view that dispersion both within and across asset classes provides a beneficial environment for relative value trading opportunities.
So far in 2024, multi-strategy funds have produced modest gains with the HFRI RV: Multi-Strategy Index advancing 2.3% through Q1 2024 versus 6.3% for all of 2023. With an emphasis on broad diversification and rigorous risk management, the group has delivered steady performance with limited correlation to traditional stocks and bonds.
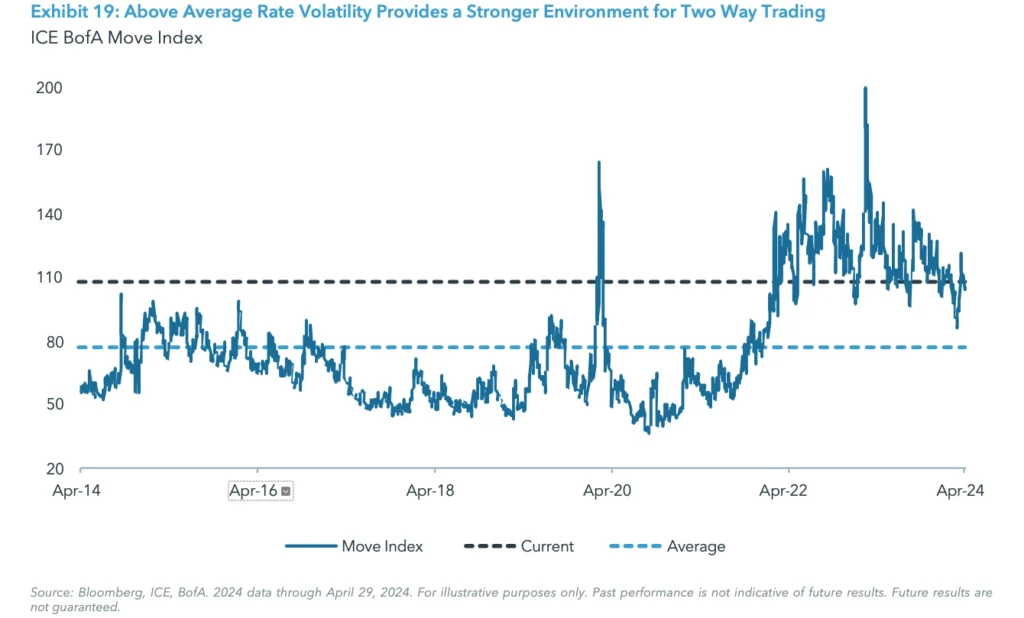
A non-directional trading construct relies on asset price dispersion and the relative movement between such asset prices. We believe there is a stronger environment for two-way trading when dispersion is on the rise, or elevated relative to historic averages, as seen with the interest rate volatility in Exhibit 19. What’s contributing to this wider dispersion? The conflicting outlook for global fiscal and monetary policies is driving volatility in the global rates markets with the potential for slowing economic activity. We believe each of these scenarios will develop further in 2024-25, providing even more diverse views on the relative value of different assets and ample opportunities for multi-strategy funds.
Investor interest in multi-strategy funds has continued unabated given their nimble mandate and ability to rotate capital to take advantage of the changing opportunity set across asset classes, sectors and geographies. The top-tier firms can attract talented specialist portfolio management teams through their growing asset bases, longer duration capital, flexible compensation structures, and access to research and technology resources.
Risks: Dampened volatility across asset classes; unbalanced or excessive risk factor exposures.
CREDIT
Current Outlook – Positive
Trend versus Q4 2023 – Same
Credit hedge funds outperformed in the first quarter of 2024 with the Hedge Fund Research Institute (HFR) Credit Index higher by 2.7% relative to a 2.1% decline for the Bloomberg Global Aggregate Bond Index. The strong relative performance of credit versus long-only funds was mainly due to spread tightening and issue selection. Lower quality credits have generally outperformed higher quality across the fixed income markets. Among high-yield bonds, spread tightening has more than offset the impact of rising rates, while leveraged loans, which are primarily floating rate instruments, have benefited from the lift in yields in recent quarters.
The outlook for securitized credit remains mixed. The underlying fundamentals of residential mortgage-backed securities (MBS) remain favorable amid continued strong demand from buyers, while CMBS faces fundamental weakness in certain high-profile segments (e.g. office, retail) and a wall of near-term maturities (~$1.5 trillion by the end of 2025). Regulatory capital trades also present opportunities as the banking sector continues to right-size its balance sheet amid an uncertain economic backdrop.
Near-term performance is still likely to be driven by attractive yields as stubborn inflation has kept an elevated benchmark rate in place. An upcoming wall of debt maturities could also lead to rising delinquencies which creates more opportunities to identify divergences between winners/losers and areas of distress. In fact, the percentage of bonds trading at stressed levels remains high, which should provide a tailwind of opportunities and support a positive outlook for credit.
Risks: Slowing economic growth; sharply widening spreads and a steeper default cycle; low dispersion and dampened volatility across fixed income; abrupt changes in liquidity in certain segments.
ENDNOTES
1. Pitchbook, 2023 Annual US PE Breakdown, January 8, 2024.
2. PitchBook. PitchBook US PE Breakdown Q1 2024 Report, March 31, 2024.
3. McKinsey & Company. “Global Private Markets Review 2024: Private Markets in a Slower Era,” March 28, 2024.
4. PitchBook. PitchBook US PE Breakdown Q1 2024 Report, as of March 31, 2024.
5. PitchBook. PitchBook US PE Breakdown Q1 2024 Report, as of March 31, 2024.
6. PitchBook. PitchBook US PE Breakdown 2023 Annual Report, as of December 31, 2023.
7. Preqin Quarterly Index, Data as of December 2022 to December 2023.
8. PitchBook. 2023 Annual US PE Middle Market Report.
9. PitchBook. 2023 Annual US PE Middle Market Report, McKinsey & Company, “Private Equity Turns to Resiliency Strategies for Software Investments,” March 29, 2023.
10. PitchBook. 2023 Annual US PE Middle Market Report, McKinsey & Company, “Private Equity Turns to Resiliency Strategies for Software Investments,” March 29, 2023.
11. FactSet Earnings Insight, May 24, 2024, and Golub Capital Middle Market Report Q1 2024. Note, Golub data provided on two months of data versus three months for S&P data.
12. Preqin Global Growth Equity, as of June 30, 2024.
13. Pitchbook, Q1 2024 PitchBook-NVCA Venture Monitor, June 10, 2024, as of March 31, 2024.
14. Pitchbook, Q1 2024 PitchBook-NVCA Venture Monitor, June 10, 2024, as of March 31, 2024.
15. Pitchbook, Q1 2024 PitchBook-NVCA Venture Monitor, June 10, 2024, as of March 31, 2024.
16. Pitchbook, Q1 2024 PitchBook-NVCA Venture Monitor, June 10, 2024, as of March 31, 2024. Note, non-traditional investors include corporations, private equity buyout/growth, asset managers, hedge funds, mutual funds, and sovereign wealth funds.
17. Pitchbook, Q1 2024 PitchBook-NVCA Venture Monitor, June 10, 2024, as of March 31, 2024.
18. Pitchbook, Q1 2024 PitchBook-NVCA Venture Monitor, June 10, 2024, as of March 31, 2024.
19. Pitchbook, Q1 2024 PitchBook-NVCA Venture Monitor, June 10, 2024, as of March 31, 2024.
20. Pitchbook, Q1 2024 PitchBook-NVCA Venture Monitor, June 10, 2024, as of March 31, 2024.
21. Pitchbook, Q1 2024 PitchBook-NVCA Venture Monitor, June 10, 2024, as of March 31, 2024.
22. Pitchbook, Q1 2024 PitchBook-NVCA Venture Monitor, June 10, 2024, as of March 31, 2024.
23. Jefferies, Global Secondary Market Review, January 2024.
24. Jefferies, Global Secondary Market Review, January 2024.
25. Jefferies, Global Secondary Market Review, January 2024.
26. Pitchbook, Global Private Market Fundraising Report, Q1 2024.
27. Pitchbook, as of March 31, 2024.
28. Cliffwater, iCapital.
29. Pitchbook Q4 2024 USPE Breakdown.
30. Proskauer Rose LLP,“Proskauer’s Private Credit Default Index Reveals Rate of 1.84% for Q1 2024”.
31. Pitchbook. Morningstar LSTAUS Leverage Loan Index – Maturity Breakdown.
32. Pitchbook. Morningstar LSTAUS Leverage Loan Index – Maturity Breakdown.
33. Preqin Private Debt Global Report 2024.
34. CBRE,“U.S. Real Estate Market Outlook 2024: Multifamily,” Dec. 12, 2023.
35. NCREIF Property Index.
36. AltunGroup, “Parsing the data: Altus Group’s Q1 2024 NCREIF ODCE index analysis,” May 23, 2024.
37. NCREIF Property Index.
38. Trepp.
39. Mortgage Banker’s Association, “Total Commercial Real Estate Borrowing and Lending Declined 47 Percent in 2023,” as of April 23, 2024.
40. WorldBank, G20 Global Infrastructure Hub, Oxford Economics, as of June 26, 2024.
41. Eurostat and Office for National Statistics. Note, in the Eurozone, GDP growth was -0.1% in Q3’23, -0.1% in Q4’23, +0.3% in Q1’24; in the UK, GDP growth was -0.1% in Q3’23, -0.3% in Q4’23, +0.6% in Q1’24. Annual inflation as of May 2024 was 2.6% in the Eurozone (HICP) and 2% in the UK (CPI).
42. Preqin, as of March 31, 2024.
43. PitchBook, as of March 31, 2024.
44. Eurostat.
45. PitchBook, as of March 31, 2024.
46. PitchBook, as of March 31, 2024.
47. PitchBook data, as of March 31, 2024.
48. Mergermarket, “Deal Drivers: APAC Q1 2024”.
49. IMF, as of as of April 2024.
50. Preqin data, as of March 31, 2024.
51. Preqin. As of Q2 2024.
52. Bain & Company, “Asia-Pacific Private Equity Report 2024”. Refers to 2023 data vs. five-year average in 2018-22.
53. Bain & Company, “Asia-Pacific Private Equity Report 2024”. Refers to 2023 data vs. five-year average in 2018-22.
54. Standard deviation of returns for the HFRI Quantitative Directional Index (9.4%), vs. standard deviation for the MSCI World (18.5%).
55. Caldara, Dario, and Matteo Iacoviello,“Measuring Geopolitical Risk,”Board of Governors of the Federal Reserve Board.
IMPORTANT INFORMATION
The material herein has been provided to you for informational purposes only by Institutional Capital Network, Inc. (“iCapital Network”) or one of its affiliates (iCapital Network together with its affiliates, “iCapital”). This material is the property of iCapital and may not be shared without the written permission of iCapital. No part of this material may be reproduced in any form, or referred to in any other publication, without express written permission of iCapital.
This material is provided for informational purposes only and is not intended as, and may not be relied on in any manner as, legal, tax or investment advice, a recommendation, or as an offer or solicitation to buy or sell any security, financial product or instrument, or otherwise to participate in any particular trading strategy. This material does not intend to address the financial objectives, situation, or specific needs of any individual investor. You should consult your personal accounting, tax and legal advisors to understand the implications of any investment specific to your personal financial situation.
ALTERNATIVE INVESTMENTS ARE CONSIDERED COMPLEX PRODUCTS AND MAY NOT BE SUITABLE FOR ALL INVESTORS. Prospective investors should be aware that an investment in an alternative investment is speculative and involves a high degree of risk. Alternative Investments often engage in leveraging and other speculative investment practices that may increase the risk of investment loss; can be highly illiquid; may not be required to provide periodic pricing or valuation information to investors; may involve complex tax structures and delays in distributing important tax information; are not subject to the same regulatory requirements as mutual funds; and often charge high fees. There is no guarantee that an alternative investment will implement its investment strategy and/or achieve its objectives, generate profits, or avoid loss. An investment should only be considered by sophisticated investors who can afford to lose all or a substantial amount of their investment.
iCapital Markets LLC operates a platform that makes available financial products to financial professionals. In operating this platform, iCapital Markets LLC generally earns revenue based on the volume of transactions that take place in these products and would benefit by an increase in sales for these products.
The information contained herein is an opinion only, as of the date indicated, and should not be relied upon as the only important information available. Any prediction, projection or forecast on the economy, stock market, bond market or the economic trends of the markets is not necessarily indicative of the future or likely performance. The information contained herein is subject to change, incomplete, and may include information and/or data obtained from third party sources that iCapital believes, but does not guarantee, to be accurate. iCapital considers this third-party data reliable, but does not represent that it is accurate, complete and/or up to date, and it should not be relied on as such. iCapital makes no representation as to the accuracy or completeness of this material and accepts no liability for losses arising from the use of the material presented. No representation or warranty is made by iCapital as to the reasonableness or completeness of such forward-looking statements or to any other financial information contained herein.
Securities products and services are offered by iCapital Markets, an SEC-registered broker-dealer, member FINRA and SIPC, and an affiliate of iCapital, Inc. and Institutional Capital Network, Inc. These registrations and memberships in no way imply that the SEC, FINRA, or SIPC have endorsed any of the entities, products, or services discussed herein. Annuities and insurance services are provided by iCapital Annuities and Insurance Services LLC, an affiliate of iCapital, Inc. “iCapital” and “iCapital Network” are registered trademarks of Institutional Capital Network, Inc. Additional information is available upon request.
©2024 Institutional Capital Network, Inc. All Rights Reserved. | 2024.01


